| Param | Original file | Final file |
|---|---|---|
| Filename | modeM0/AS1G05_230T04_9000000550_04415cztM0_level2.evt | modeM0/AS1G05_230T04_9000000550_04415cztM0_level2_quad_clean.evt |
| Size (bytes) | 729,483,840 | 87,183,360 |
| Size | 695.7 MB | 83.1 MB |
| Events in quadrant A | 4,334,830 | 564,666 |
| Events in quadrant B | 4,606,230 | 571,743 |
| Events in quadrant C | 2,716,565 | 600,550 |
| Events in quadrant D | 10,036,447 | 489,536 |
| Mode SS | |||
|---|---|---|---|
| Quadrant | BADHDUFLAG | Total packets | Discarded packets |
| A | 0 | 118 | 0 |
| B | 0 | 118 | 0 |
| C | 0 | 118 | 0 |
| D | 0 | 118 | 0 |
| Mode M9 | |||
|---|---|---|---|
| Quadrant | BADHDUFLAG | Total packets | Discarded packets |
| A | 0 | 13 | 0 |
| B | 0 | 13 | 0 |
| C | 0 | 13 | 0 |
| D | 0 | 13 | 0 |
| Mode M0 | |||
|---|---|---|---|
| Quadrant | BADHDUFLAG | Total packets | Discarded packets |
| A | 0 | 16724 | 2 |
| B | 0 | 17590 | 1 |
| C | 0 | 12125 | 1 |
| D | 0 | 33794 | 1 |
| Quadrant | Total seconds | Saturated seconds | Saturation percentage |
|---|---|---|---|
| A | 5901 | 600 | 10.167768% |
| B | 5901 | 597 | 10.116929% |
| C | 5901 | 90 | 1.525165% |
| D | 5901 | 2695 | 45.670225% |
Noise dominated data is calculated using 1-second bins in cleaned event files. If a bin has >2000 counts, and if more than 50% of those come from <1% of pixels, then it is considered to be noise-dominated and hence unusable.
| Quadrant | # 1 sec bins | Bins with >0 counts | Bins with >2000 counts | High rate bins dominated by noise | Noise dominated (total time) | Noise dominated (detector-on time) | Marked lightcurve |
|---|---|---|---|---|---|---|---|
| A | 7126 | 5902 | 376 | 376 | 5.28% | 6.37% | 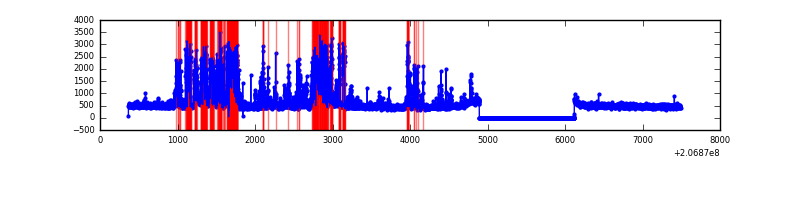 |
| B | 7126 | 5902 | 416 | 416 | 5.84% | 7.05% | 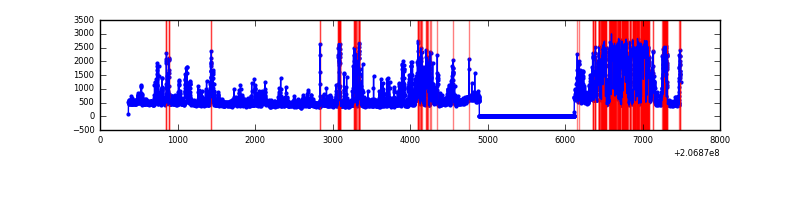 |
| C | 7126 | 5902 | 1 | 1 | 0.01% | 0.02% | 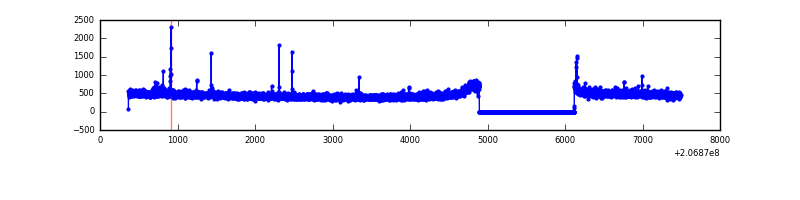 |
| D | 7126 | 5902 | 2893 | 2893 | 40.60% | 49.02% | 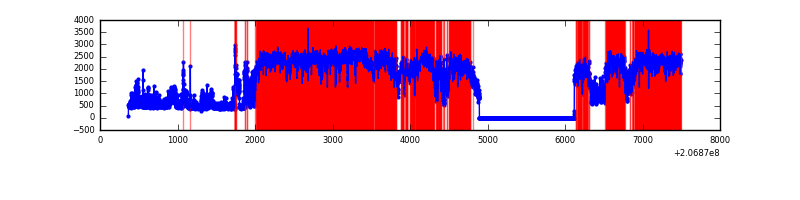 |
Top three noisy pixels from each quadrant. If the there are fewer than three noisy pixels in the level2.evt file, extra rows are filled as -1
| Pixel properties | Quadrant properties | ||||||
|---|---|---|---|---|---|---|---|
| Quadrant | DetID | PixID | Counts | Sigma | Mean | Median | Sigma |
| A | 0 | 13 | 1670964 | 12082.81 | 677 | 663 | 138.2 |
| A | 8 | 15 | 37860 | 269.08 | 677 | 663 | 138.2 |
| A | 14 | 111 | 14073 | 97.01 | 677 | 663 | 138.2 |
| B | 14 | 167 | 1928713 | 14953.52 | 685 | 669 | 128.9 |
| B | 12 | 111 | 10524 | 76.43 | 685 | 669 | 128.9 |
| B | 0 | 183 | 9857 | 71.26 | 685 | 669 | 128.9 |
| C | 9 | 247 | 21629 | 134.11 | 684 | 686 | 156.2 |
| C | 9 | 16 | 9831 | 58.56 | 684 | 686 | 156.2 |
| C | 12 | 4 | 8910 | 52.66 | 684 | 686 | 156.2 |
| D | 13 | 114 | 7442459 | 50910.69 | 620 | 602 | 146.2 |
| D | 13 | 239 | 106137 | 721.98 | 620 | 602 | 146.2 |
| D | 12 | 233 | 43235 | 291.66 | 620 | 602 | 146.2 |
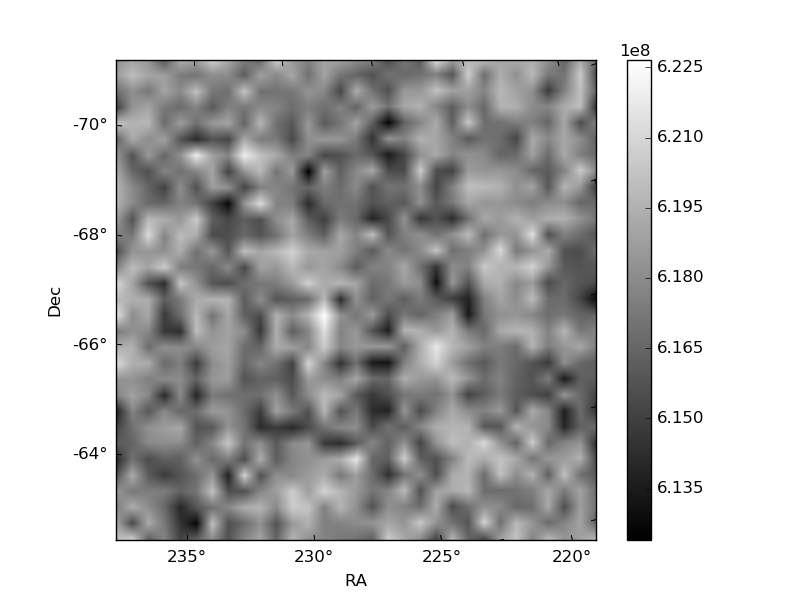
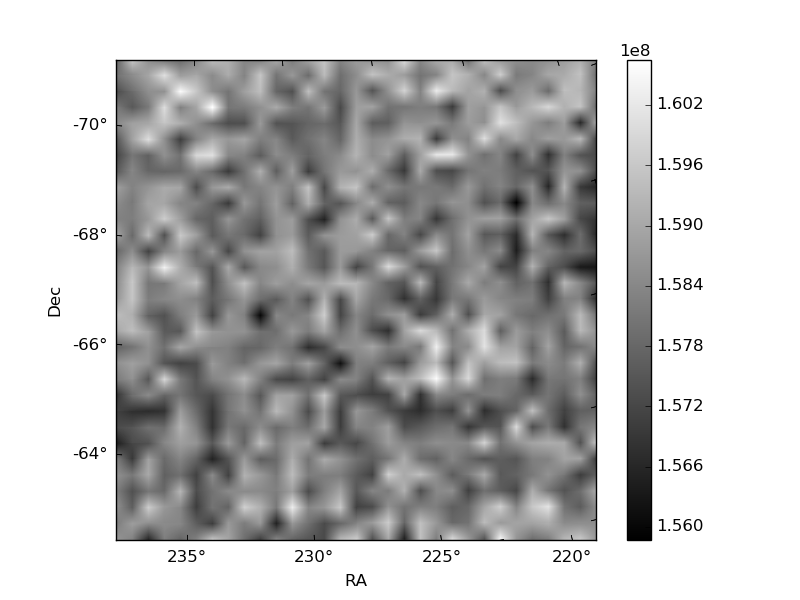
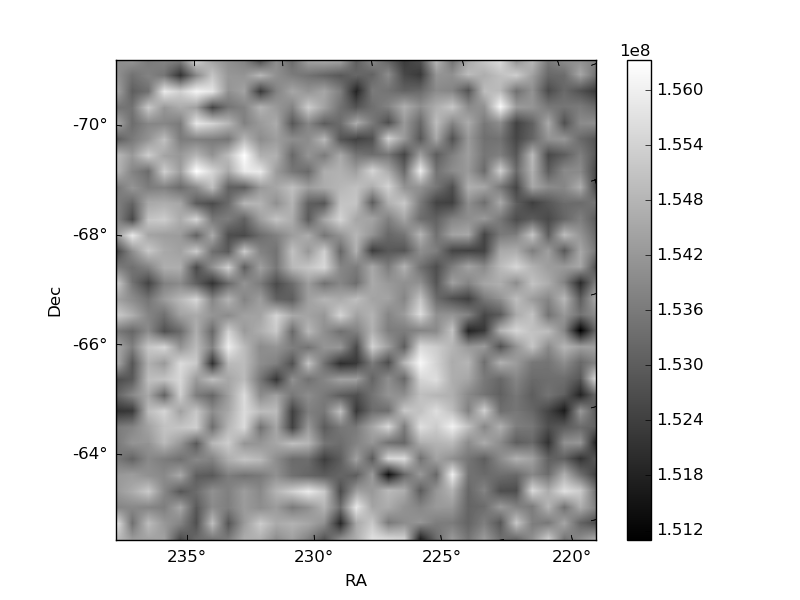
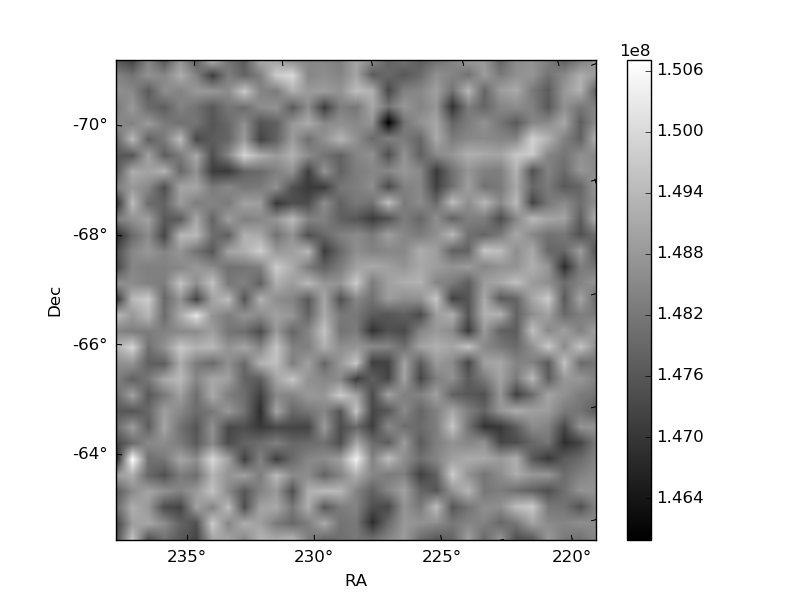
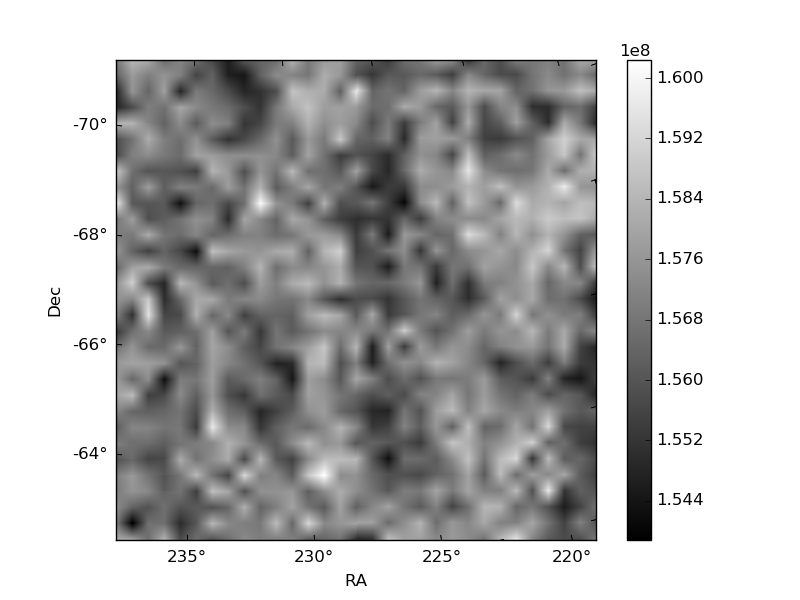
Histogram calculated using DETX and DETY for each event in the final _common_clean file
| Quadrant A | 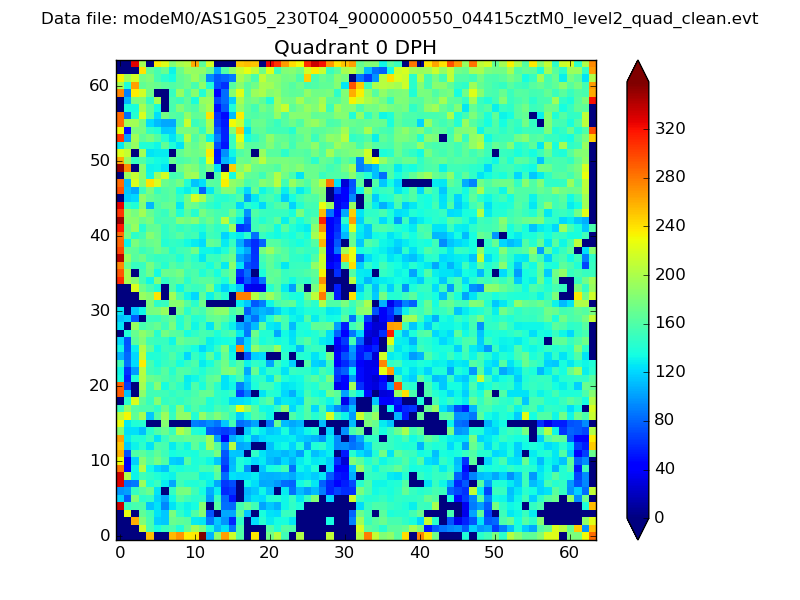 |
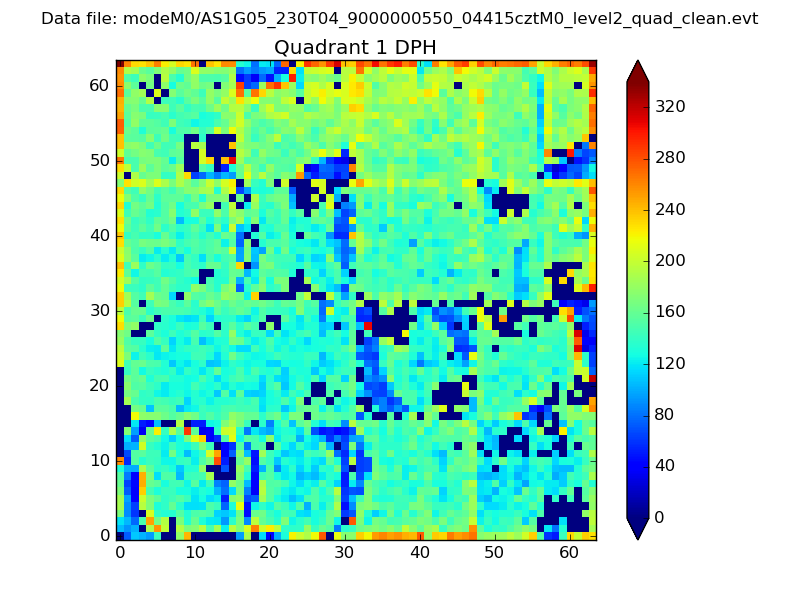 |
Quadrant B |
|---|---|---|---|
| Quadrant D | 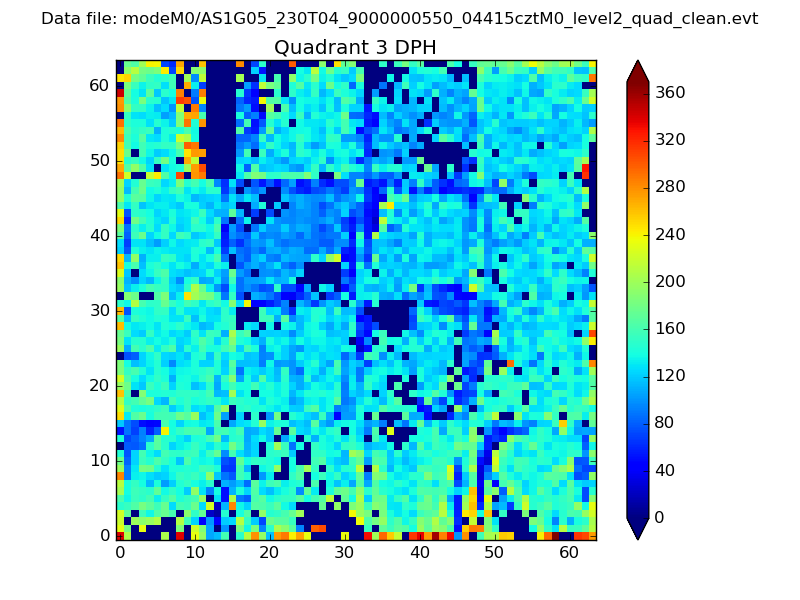 |
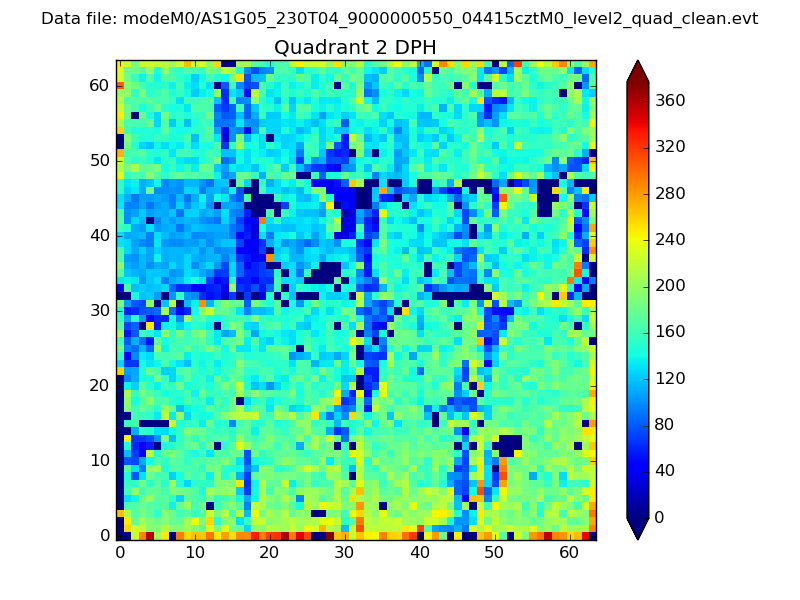 |
Quadrant C |
| Plot type | Count rate plots | Images |
|---|---|---|
| Comparison with Poisson distribution Blue bars denote a histogram of data divided into 1 sec bins. Red curve is a Poisson curve with rate = median count rate of data. |
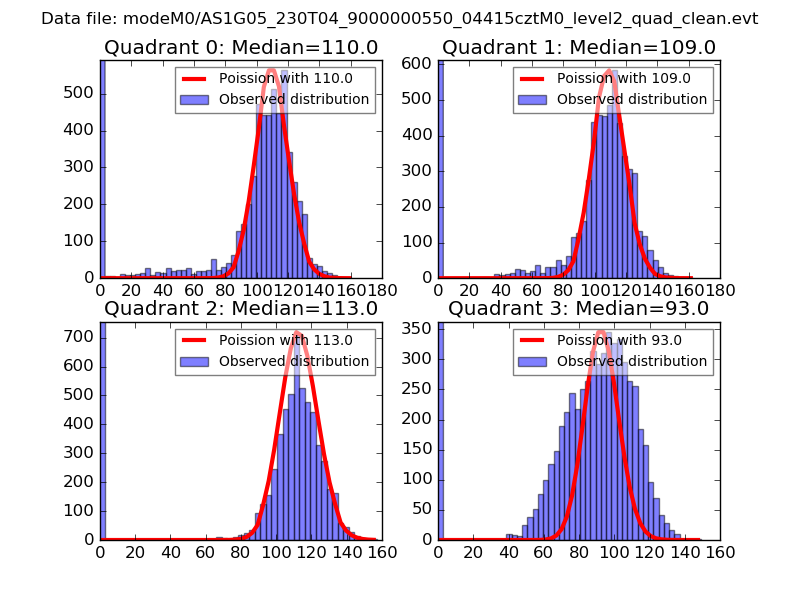 |
 |
| Quadrant-wise count rates Data is divided into 100 sec bins |
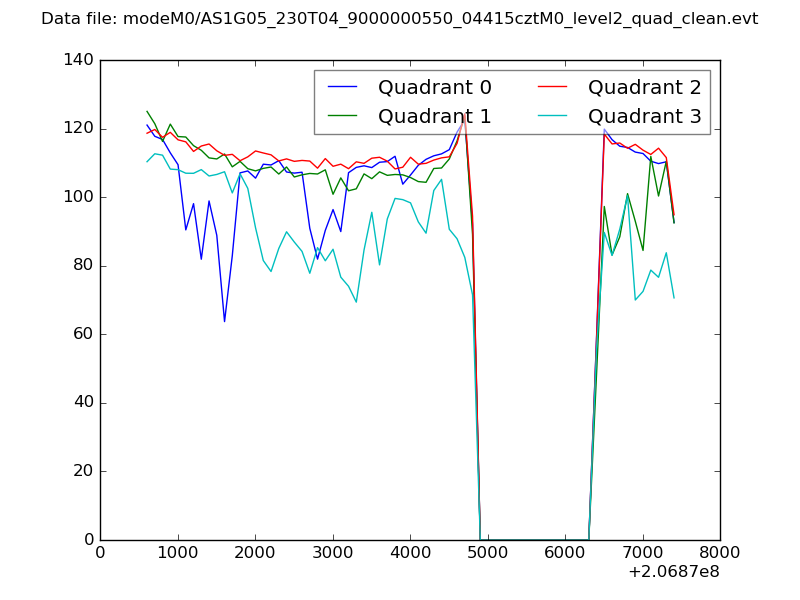 |
|
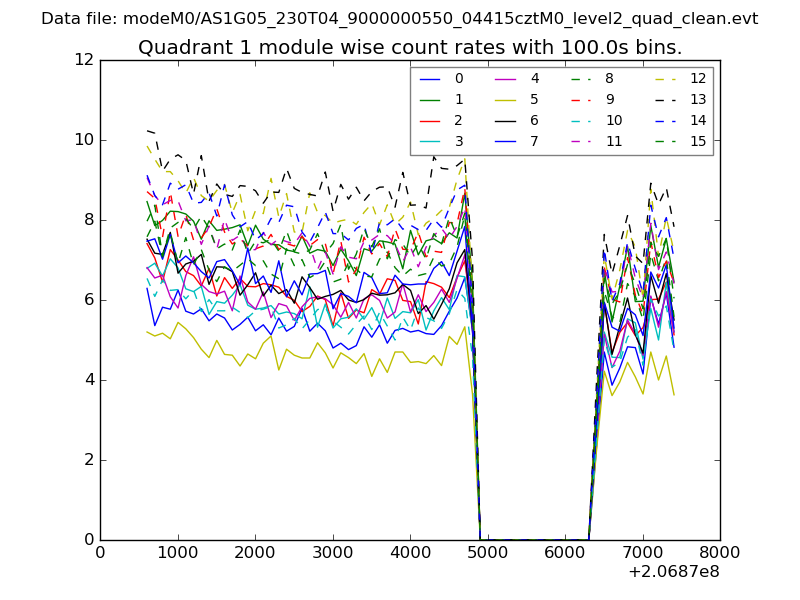
| Module-wise count rates for Quadrant A Data is divided into 100 sec bins |
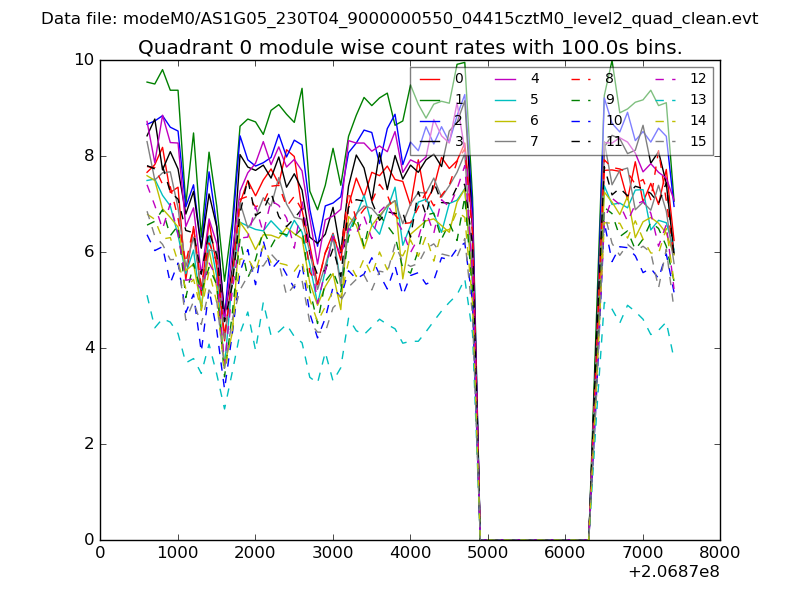 |
 |
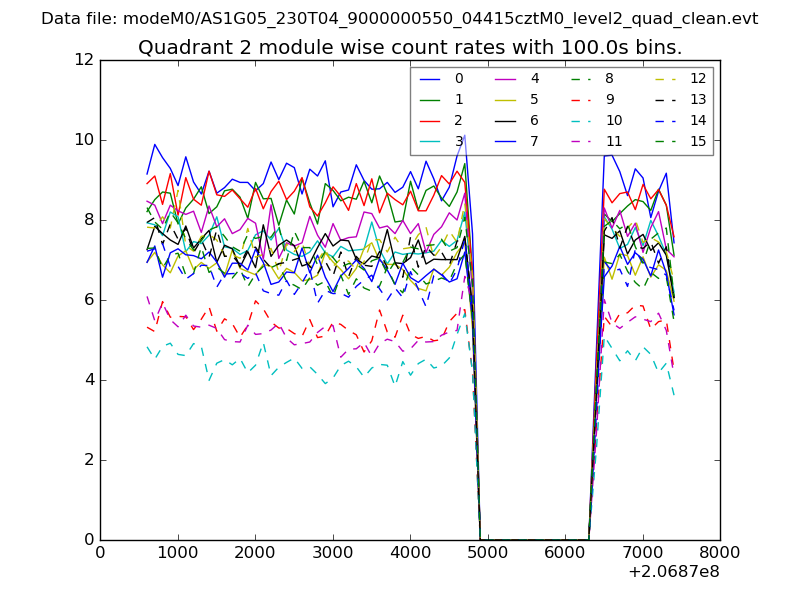
| Module-wise count rates for Quadrant B Data is divided into 100 sec bins |
 |
 |
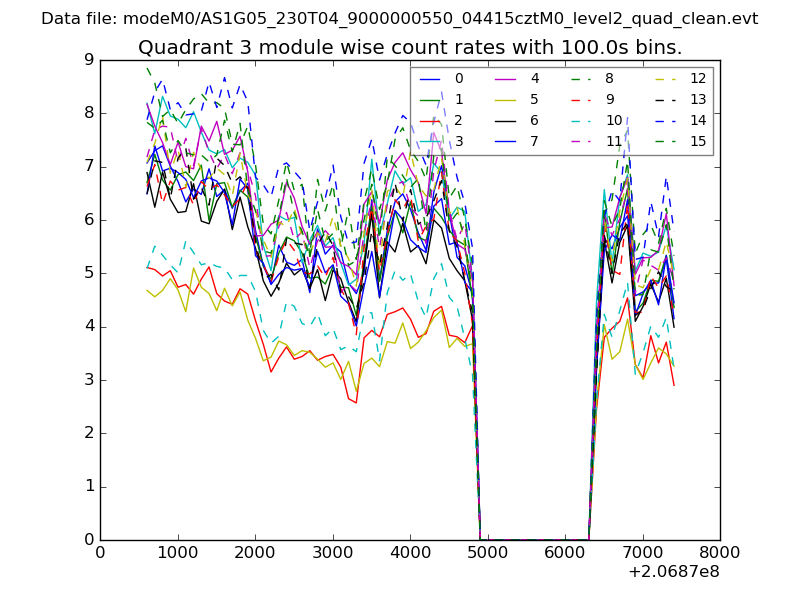
| Module-wise count rates for Quadrant C Data is divided into 100 sec bins |
 |
 |
| Module-wise count rates for Quadrant D Data is divided into 100 sec bins |
 |
 |
| Parameter | Plot |
|---|---|
| CZT HV Monitor | 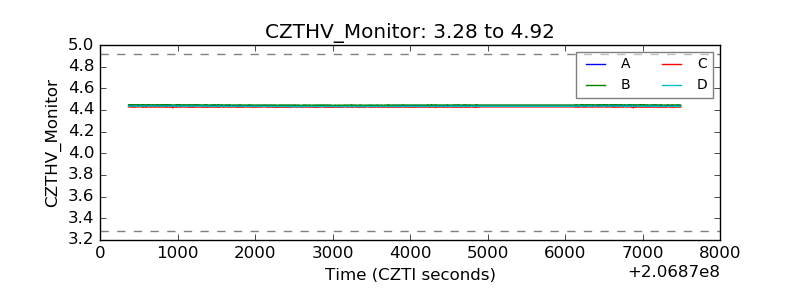 |
| D_VDD | 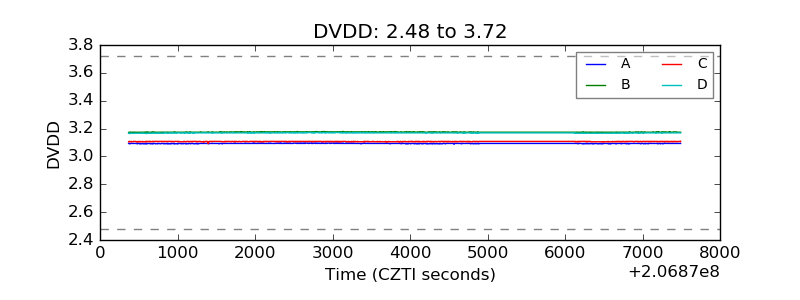 |
| Temperature 1 | 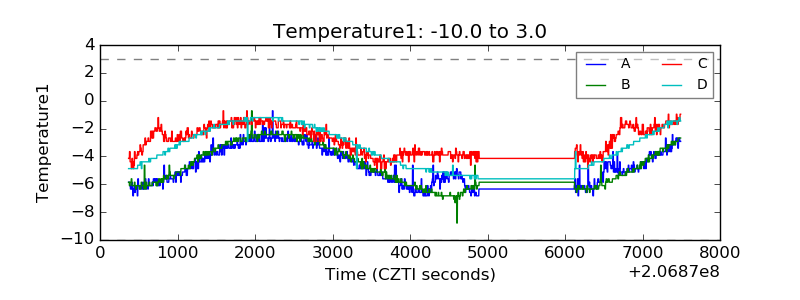 |
| Veto HV Monitor | 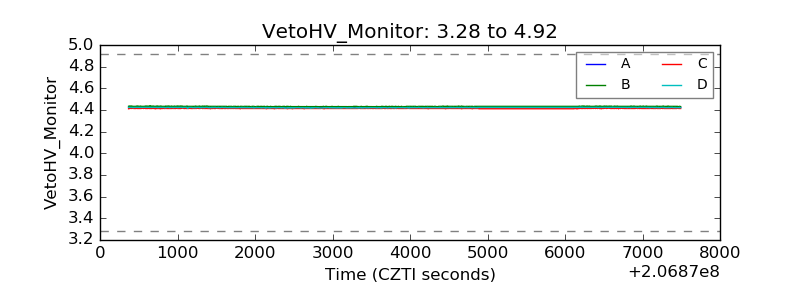 |
| Veto LLD | 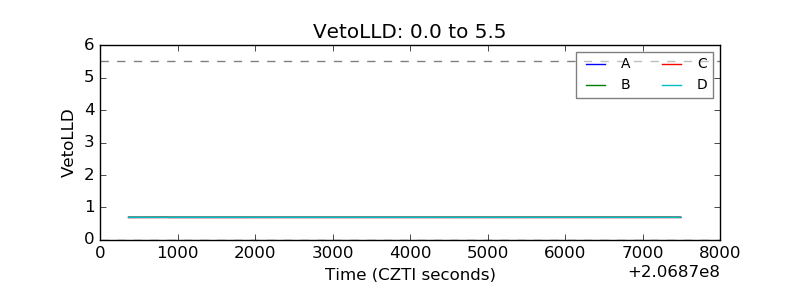 |
| Alpha Counter | 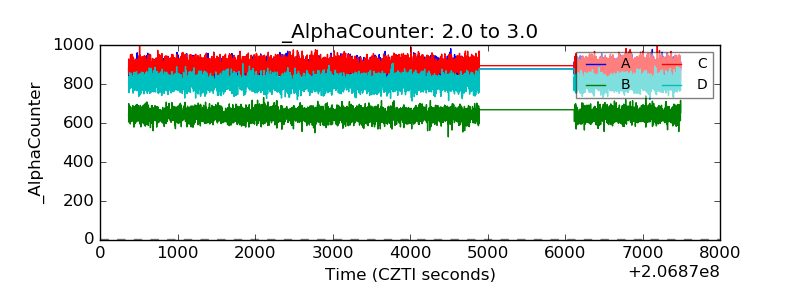 |
| _CPM_Rate | 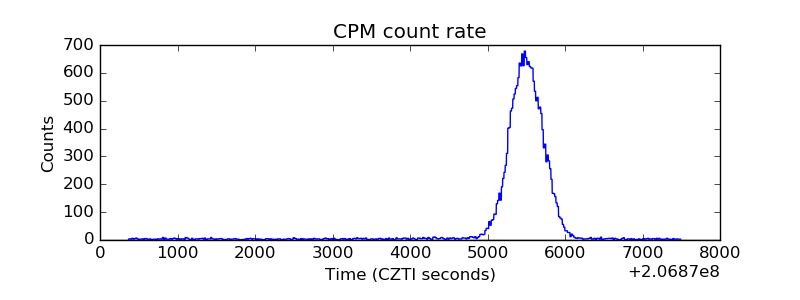 |
| CZT Counter | 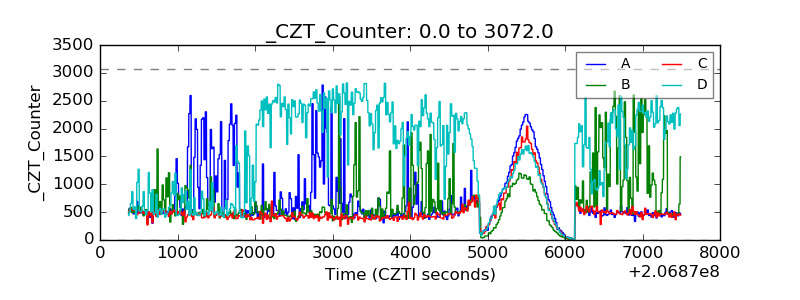 |
| +2.5 Volts monitor | 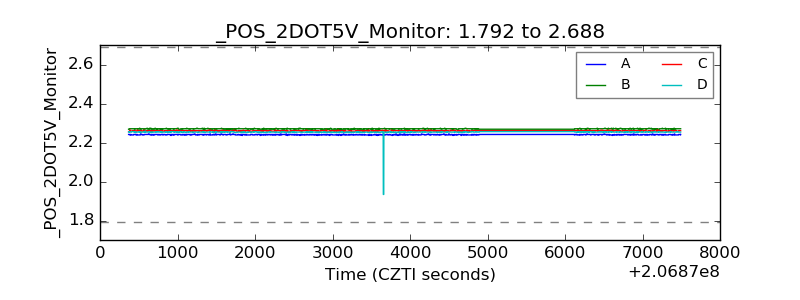 |
| +5 Volts monitor |  |
| _ROLL_ROT | 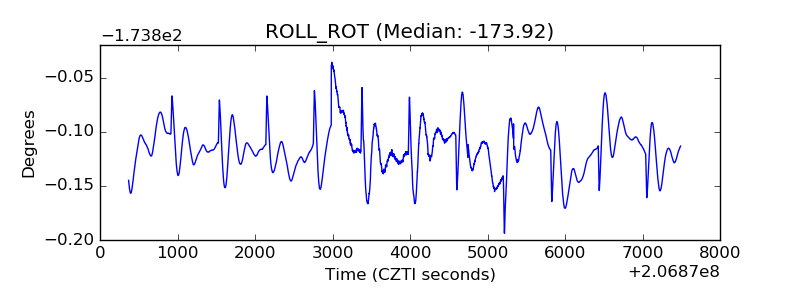 |
| _Roll_DEC | 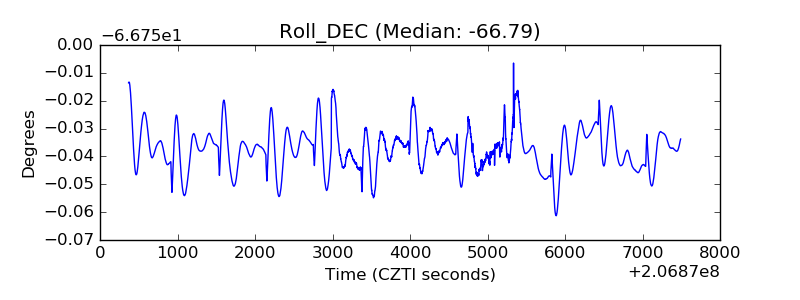 |
| _Roll_RA | 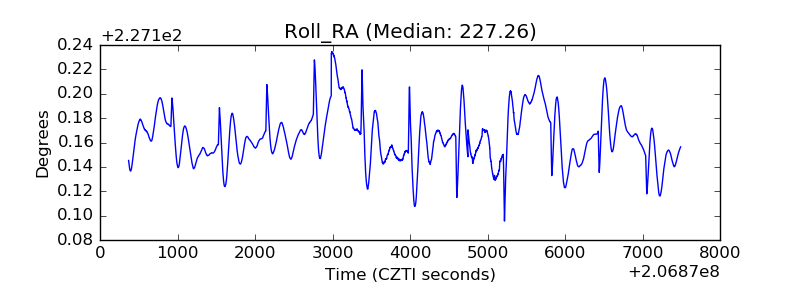 |
| Veto Counter | 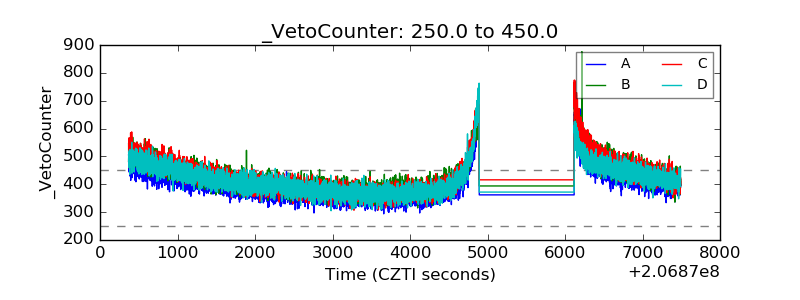 |