| Param | Original file | Final file |
|---|---|---|
| Filename | modeM0/AS1G05_230T04_9000000550_04416cztM0_level2.evt | modeM0/AS1G05_230T04_9000000550_04416cztM0_level2_quad_clean.evt |
| Size (bytes) | 640,828,800 | 92,698,560 |
| Size | 611.1 MB | 88.4 MB |
| Events in quadrant A | 2,629,409 | 630,899 |
| Events in quadrant B | 4,940,859 | 602,917 |
| Events in quadrant C | 2,594,589 | 635,039 |
| Events in quadrant D | 8,848,769 | 530,548 |
| Mode SS | |||
|---|---|---|---|
| Quadrant | BADHDUFLAG | Total packets | Discarded packets |
| A | 0 | 118 | 0 |
| B | 0 | 118 | 0 |
| C | 0 | 118 | 0 |
| D | 0 | 118 | 0 |
| Mode M9 | |||
|---|---|---|---|
| Quadrant | BADHDUFLAG | Total packets | Discarded packets |
| A | 0 | 11 | 0 |
| B | 0 | 11 | 0 |
| C | 0 | 11 | 0 |
| D | 0 | 11 | 0 |
| Mode M0 | |||
|---|---|---|---|
| Quadrant | BADHDUFLAG | Total packets | Discarded packets |
| A | 0 | 11899 | 2 |
| B | 0 | 18569 | 1 |
| C | 0 | 11954 | 1 |
| D | 0 | 30271 | 1 |
| Quadrant | Total seconds | Saturated seconds | Saturation percentage |
|---|---|---|---|
| A | 5818 | 93 | 1.598487% |
| B | 5818 | 614 | 10.553455% |
| C | 5818 | 76 | 1.306291% |
| D | 5818 | 2276 | 39.119972% |
Noise dominated data is calculated using 1-second bins in cleaned event files. If a bin has >2000 counts, and if more than 50% of those come from <1% of pixels, then it is considered to be noise-dominated and hence unusable.
| Quadrant | # 1 sec bins | Bins with >0 counts | Bins with >2000 counts | High rate bins dominated by noise | Noise dominated (total time) | Noise dominated (detector-on time) | Marked lightcurve |
|---|---|---|---|---|---|---|---|
| A | 6868 | 5819 | 0 | 0 | 0.00% | 0.00% | 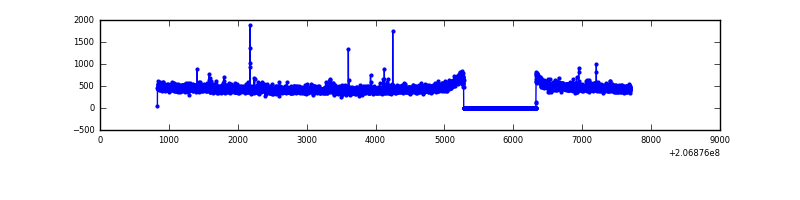 |
| B | 6868 | 5819 | 490 | 490 | 7.13% | 8.42% | 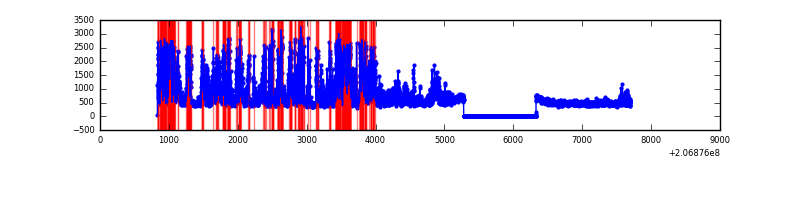 |
| C | 6868 | 5819 | 0 | 0 | 0.00% | 0.00% | 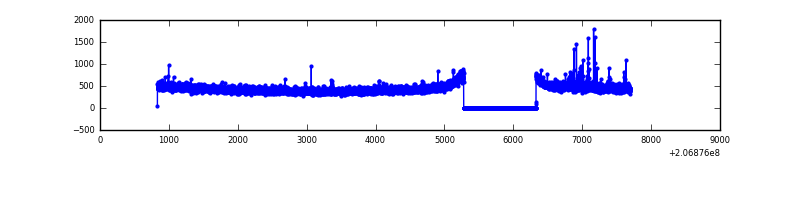 |
| D | 6868 | 5819 | 2335 | 2335 | 34.00% | 40.13% | 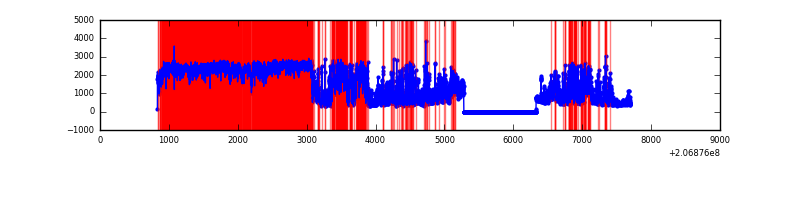 |
Top three noisy pixels from each quadrant. If the there are fewer than three noisy pixels in the level2.evt file, extra rows are filled as -1
| Pixel properties | Quadrant properties | ||||||
|---|---|---|---|---|---|---|---|
| Quadrant | DetID | PixID | Counts | Sigma | Mean | Median | Sigma |
| A | 8 | 15 | 10619 | 73.22 | 672 | 658 | 136.0 |
| A | 0 | 13 | 10038 | 68.95 | 672 | 658 | 136.0 |
| A | 13 | 251 | 7897 | 53.21 | 672 | 658 | 136.0 |
| B | 14 | 167 | 2306394 | 18535.44 | 658 | 642 | 124.4 |
| B | 0 | 172 | 40122 | 317.37 | 658 | 642 | 124.4 |
| B | 7 | 252 | 23298 | 182.13 | 658 | 642 | 124.4 |
| C | 9 | 16 | 34871 | 228.02 | 653 | 654 | 150.1 |
| C | 9 | 247 | 8538 | 52.54 | 653 | 654 | 150.1 |
| C | 13 | 61 | 5414 | 31.72 | 653 | 654 | 150.1 |
| D | 13 | 114 | 6323778 | 44531.39 | 597 | 579 | 142.0 |
| D | 13 | 239 | 63000 | 439.6 | 597 | 579 | 142.0 |
| D | 12 | 233 | 58286 | 406.4 | 597 | 579 | 142.0 |
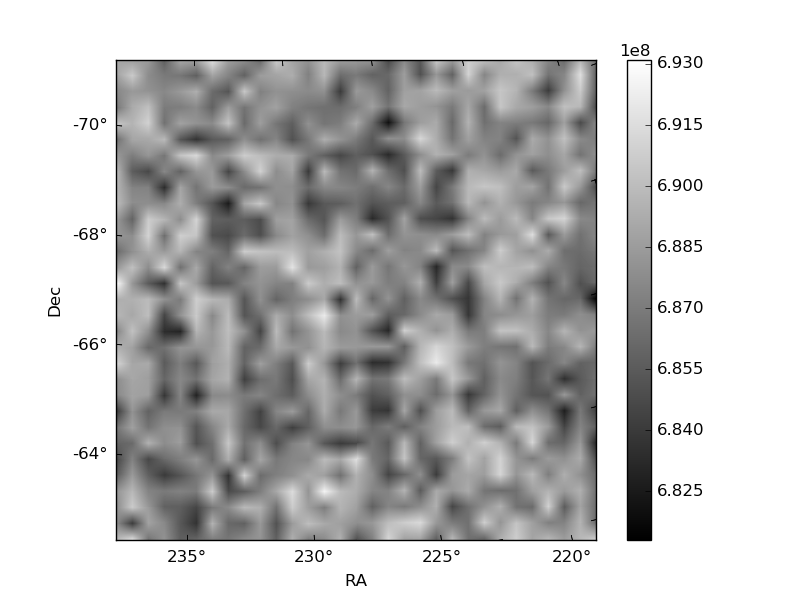
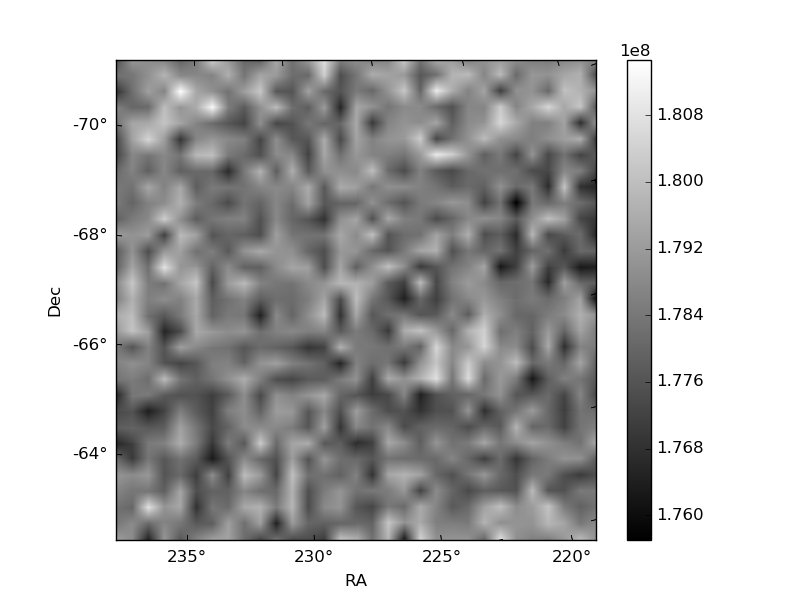
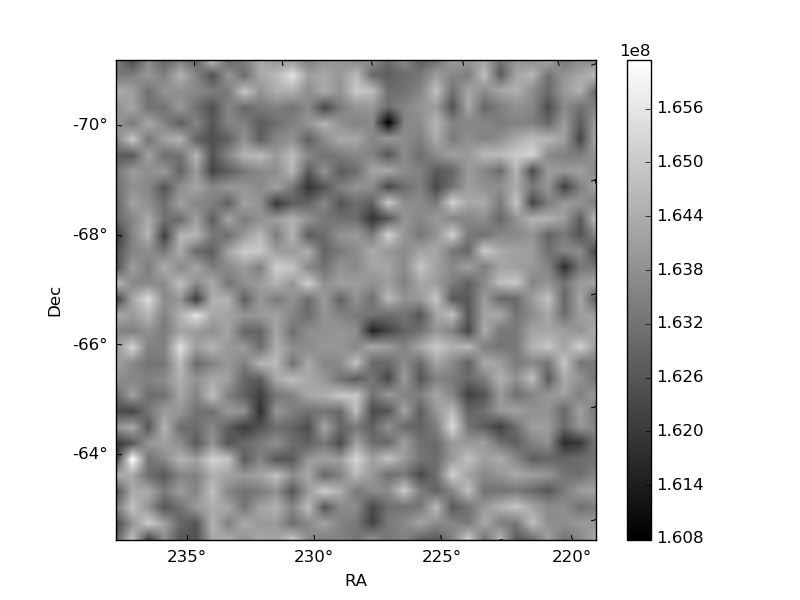
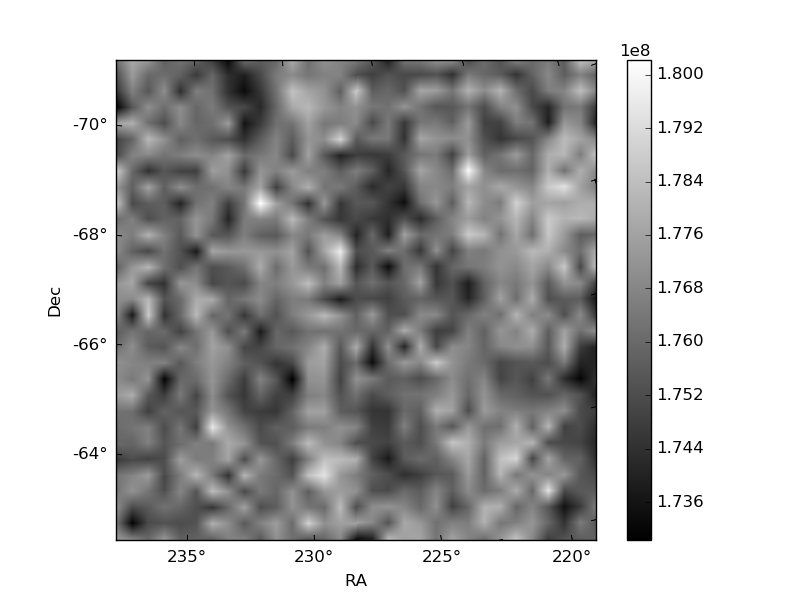
Histogram calculated using DETX and DETY for each event in the final _common_clean file
| Quadrant A | 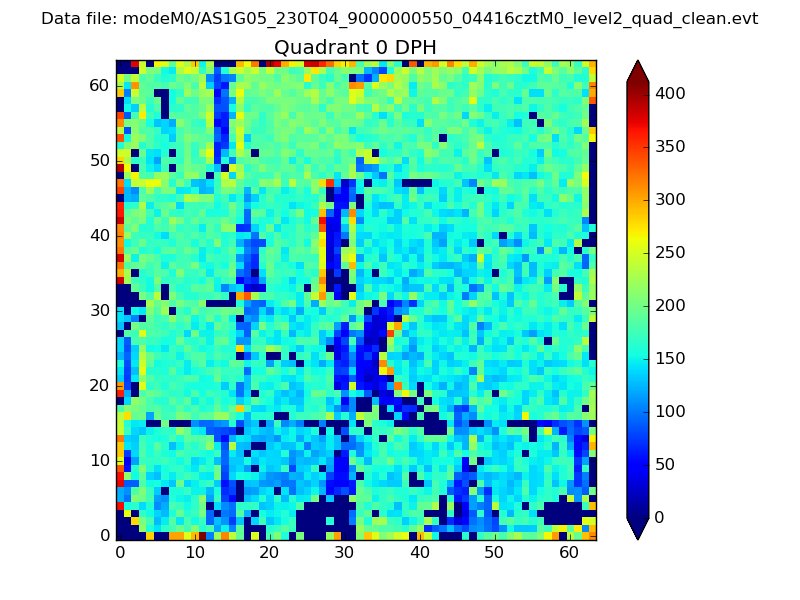 |
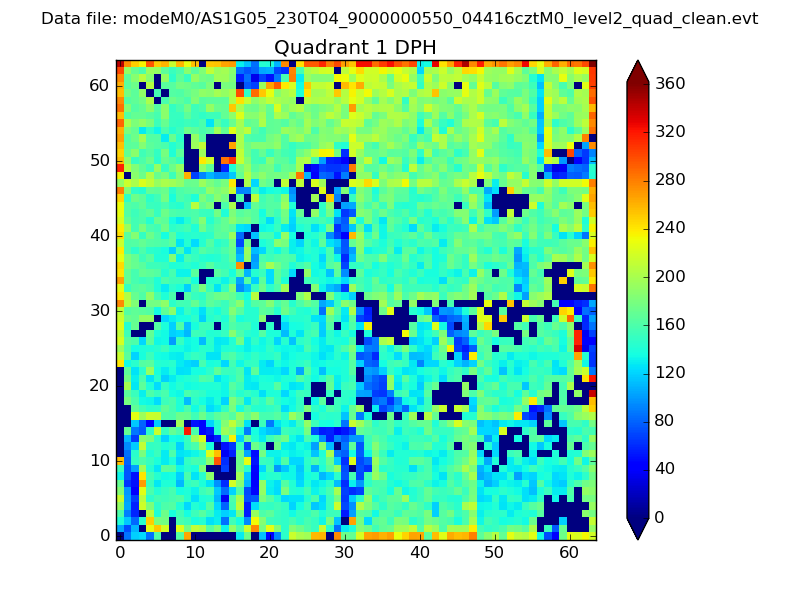 |
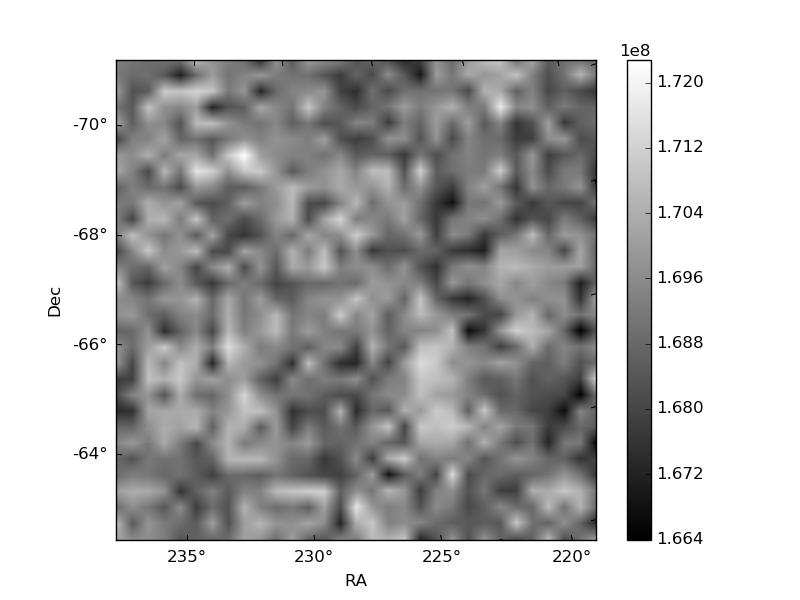
Quadrant B |
|---|---|---|---|
| Quadrant D | 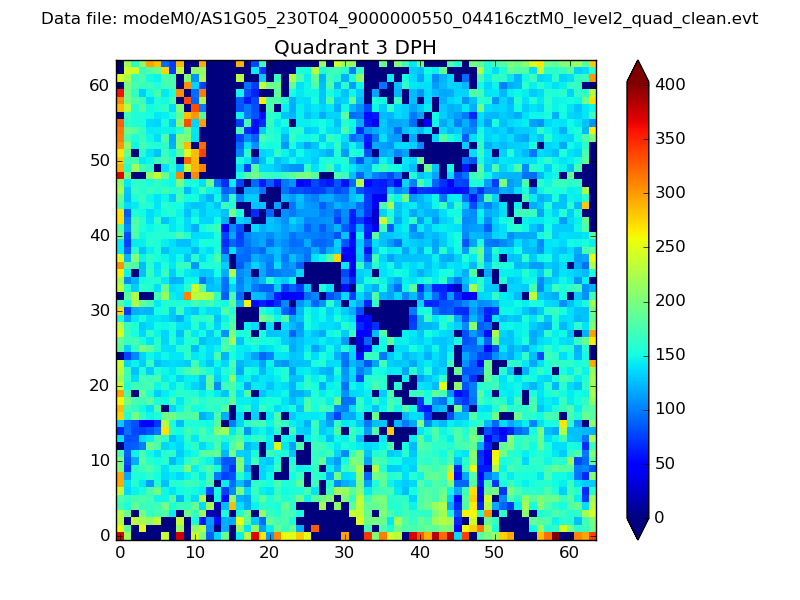 |
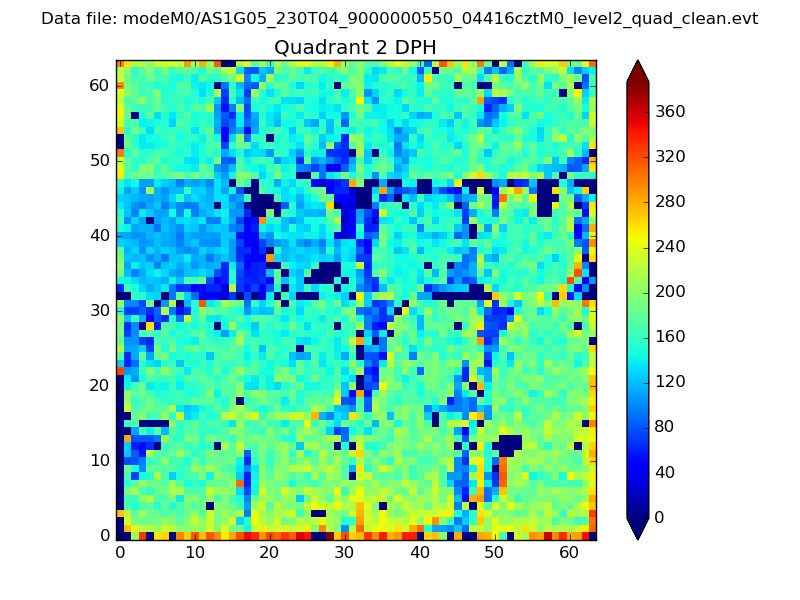 |
Quadrant C |
| Plot type | Count rate plots | Images |
|---|---|---|
| Comparison with Poisson distribution Blue bars denote a histogram of data divided into 1 sec bins. Red curve is a Poisson curve with rate = median count rate of data. |
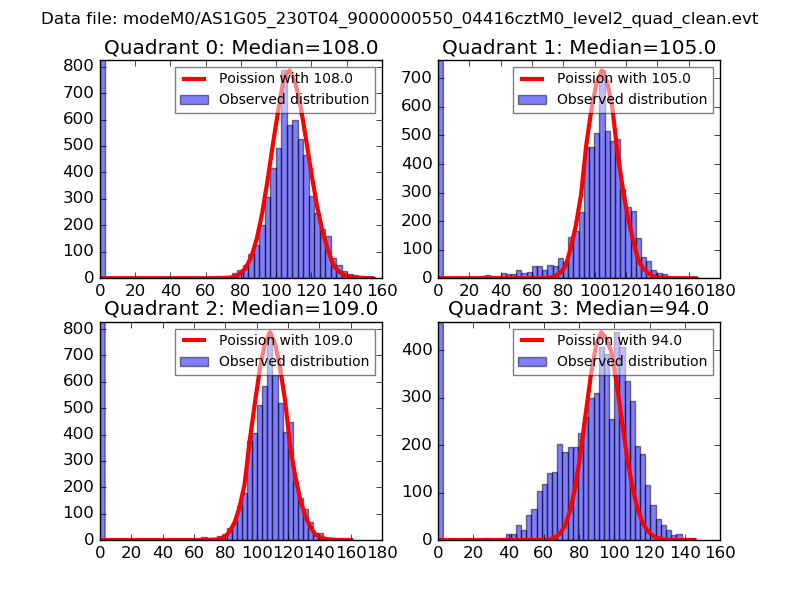 |
 |
| Quadrant-wise count rates Data is divided into 100 sec bins |
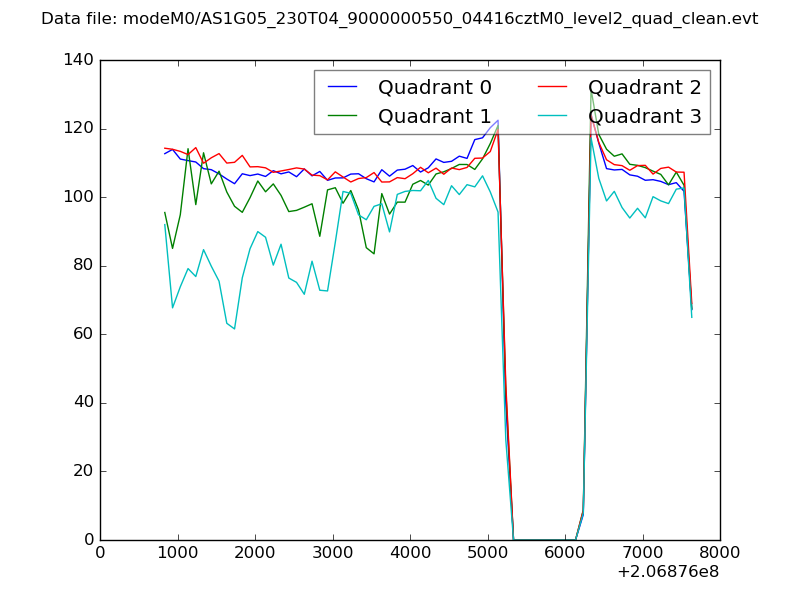 |
|
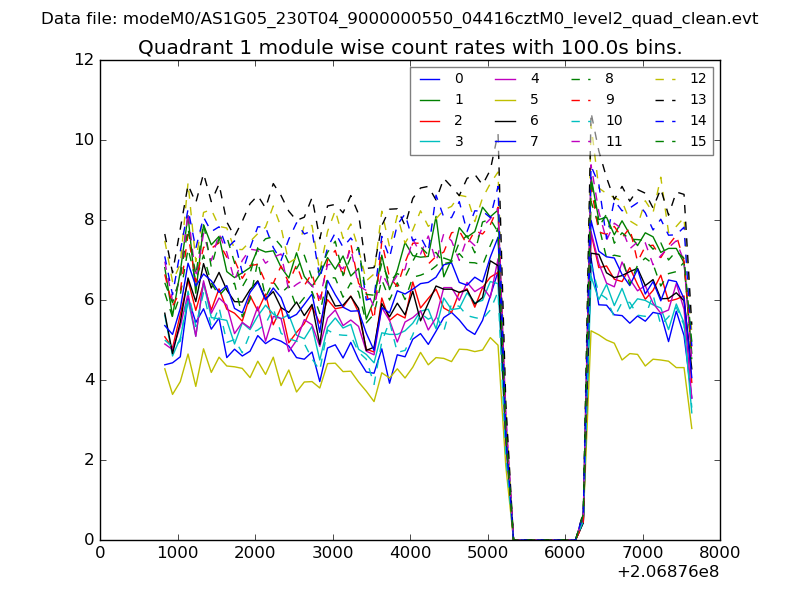
| Module-wise count rates for Quadrant A Data is divided into 100 sec bins |
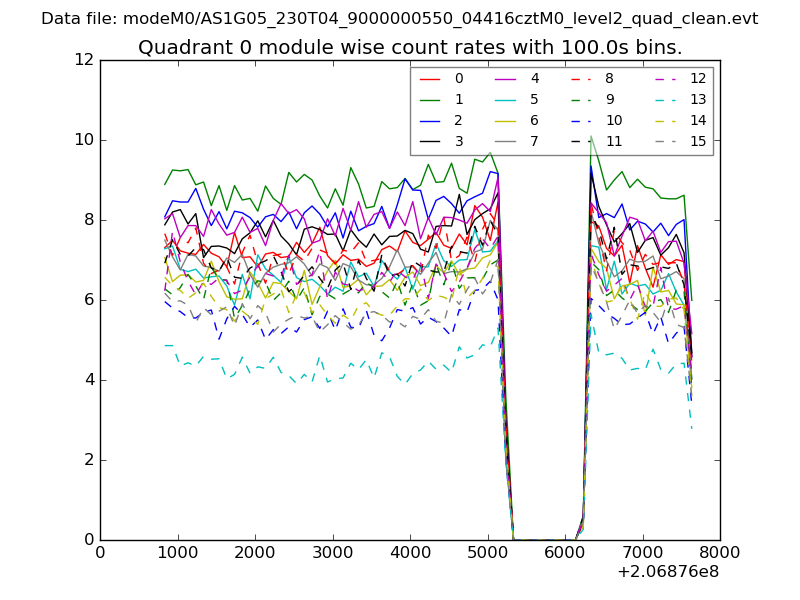 |
 |
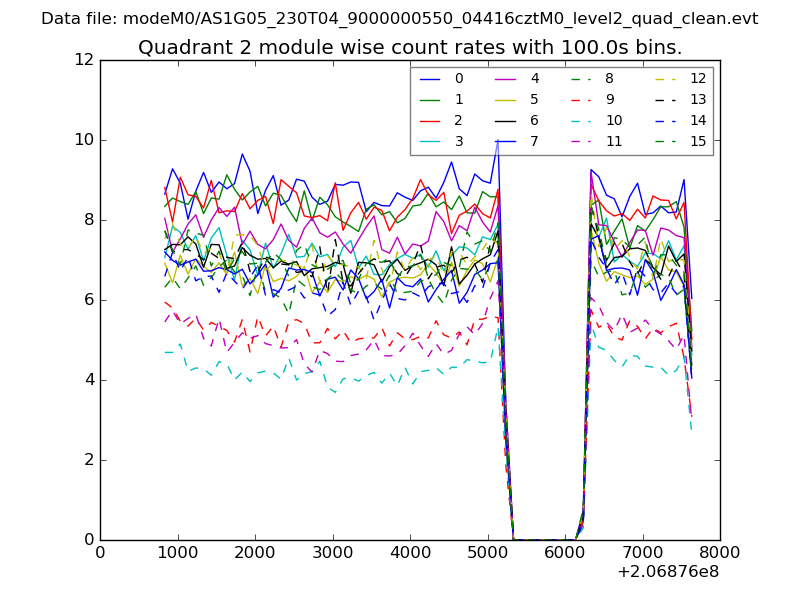
| Module-wise count rates for Quadrant B Data is divided into 100 sec bins |
 |
 |
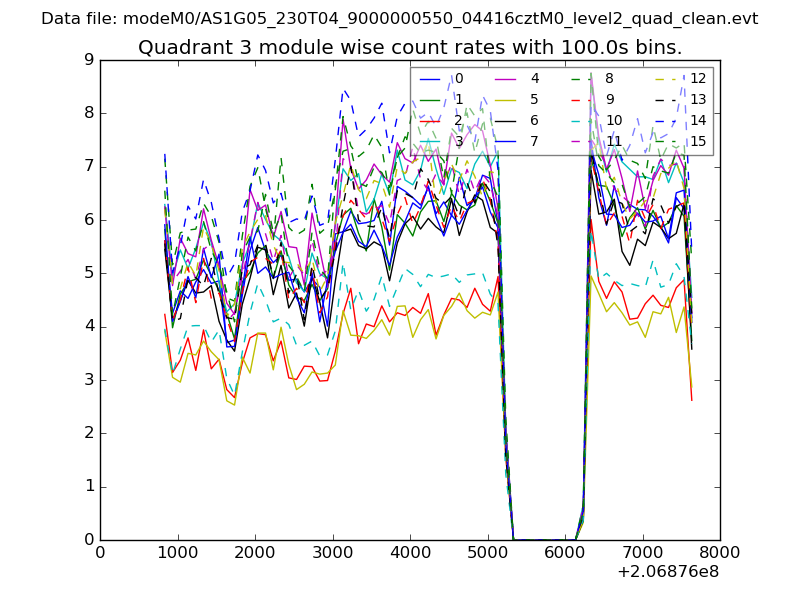
| Module-wise count rates for Quadrant C Data is divided into 100 sec bins |
 |
 |
| Module-wise count rates for Quadrant D Data is divided into 100 sec bins |
 |
 |
| Parameter | Plot |
|---|---|
| CZT HV Monitor | 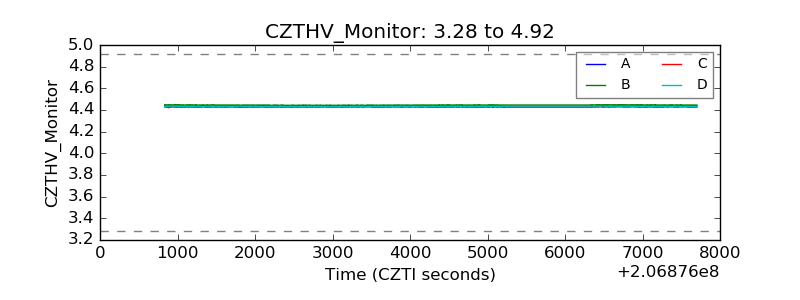 |
| D_VDD | 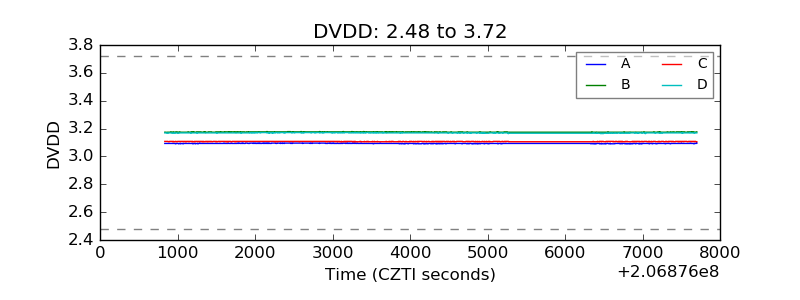 |
| Temperature 1 | 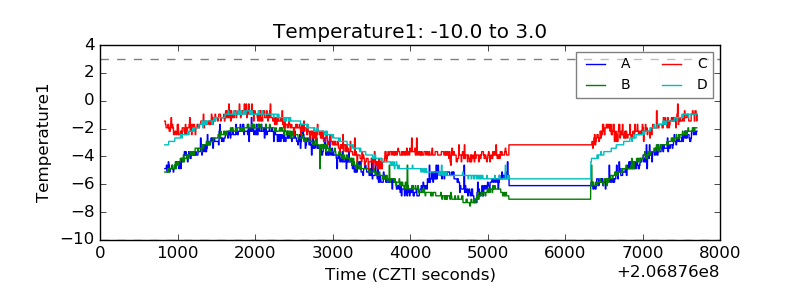 |
| Veto HV Monitor | 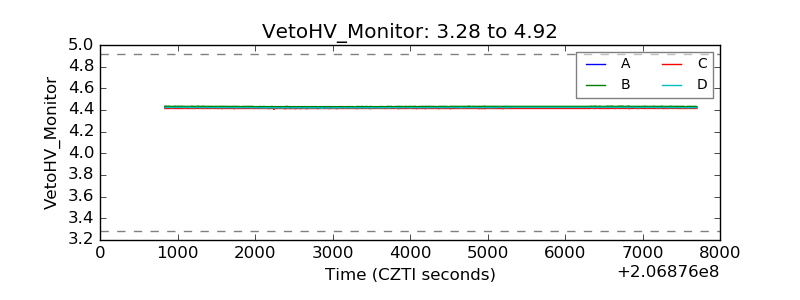 |
| Veto LLD | 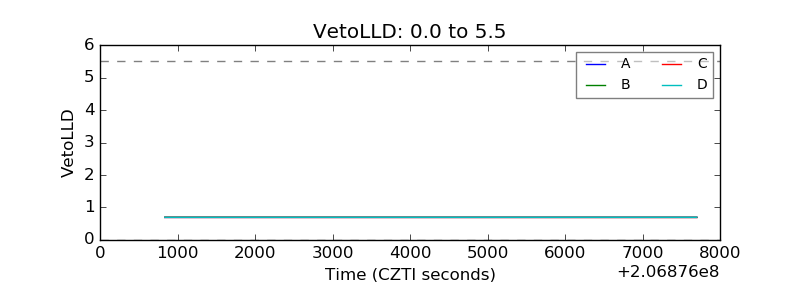 |
| Alpha Counter | 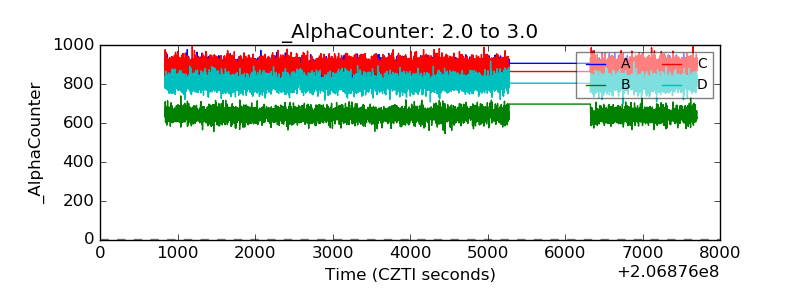 |
| _CPM_Rate | 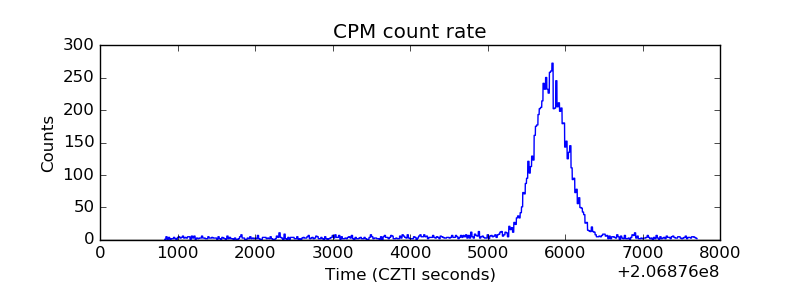 |
| CZT Counter | 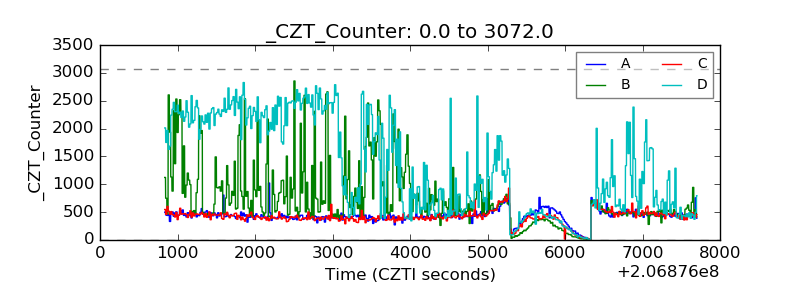 |
| +2.5 Volts monitor |  |
| +5 Volts monitor |  |
| _ROLL_ROT | 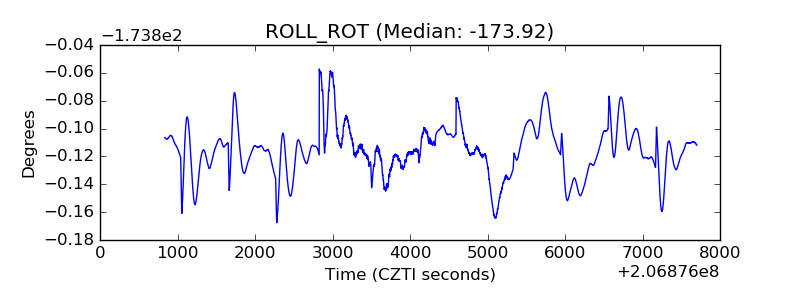 |
| _Roll_DEC | 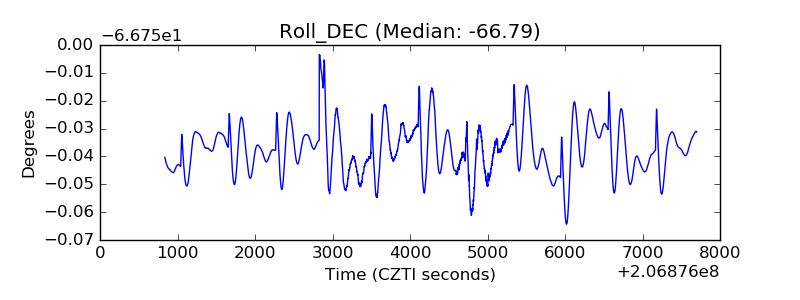 |
| _Roll_RA | 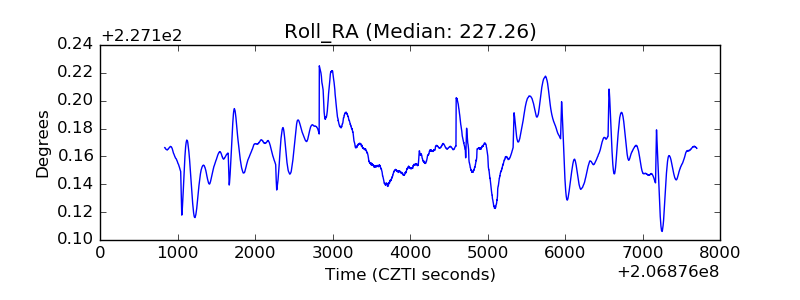 |
| Veto Counter | 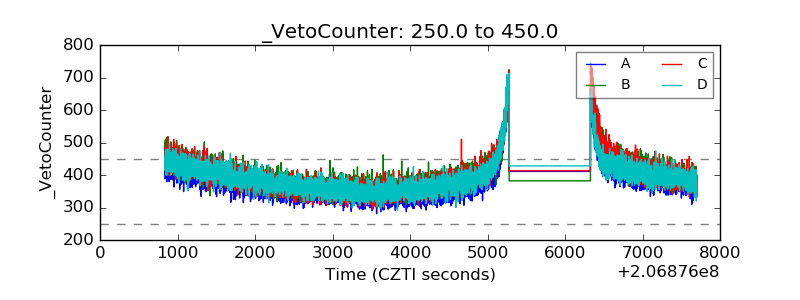 |