| Param | Original file | Final file |
|---|---|---|
| Filename | modeM0/AS1G05_230T04_9000000550_04417cztM0_level2.evt | modeM0/AS1G05_230T04_9000000550_04417cztM0_level2_quad_clean.evt |
| Size (bytes) | 591,361,920 | 100,808,640 |
| Size | 564.0 MB | 96.1 MB |
| Events in quadrant A | 3,023,938 | 660,903 |
| Events in quadrant B | 4,144,211 | 648,863 |
| Events in quadrant C | 3,275,880 | 660,646 |
| Events in quadrant D | 7,000,595 | 604,247 |
| Mode SS | |||
|---|---|---|---|
| Quadrant | BADHDUFLAG | Total packets | Discarded packets |
| A | 0 | 138 | 0 |
| B | 0 | 138 | 0 |
| C | 0 | 138 | 0 |
| D | 0 | 138 | 0 |
| Mode M9 | |||
|---|---|---|---|
| Quadrant | BADHDUFLAG | Total packets | Discarded packets |
| A | 0 | 9 | 0 |
| B | 0 | 9 | 0 |
| C | 0 | 9 | 0 |
| D | 0 | 9 | 0 |
| Mode M0 | |||
|---|---|---|---|
| Quadrant | BADHDUFLAG | Total packets | Discarded packets |
| A | 0 | 13976 | 2 |
| B | 0 | 16911 | 1 |
| C | 0 | 14541 | 1 |
| D | 0 | 25702 | 1 |
| Quadrant | Total seconds | Saturated seconds | Saturation percentage |
|---|---|---|---|
| A | 6864 | 72 | 1.048951% |
| B | 6864 | 183 | 2.666084% |
| C | 6864 | 55 | 0.801282% |
| D | 6864 | 902 | 13.141026% |
Noise dominated data is calculated using 1-second bins in cleaned event files. If a bin has >2000 counts, and if more than 50% of those come from <1% of pixels, then it is considered to be noise-dominated and hence unusable.
| Quadrant | # 1 sec bins | Bins with >0 counts | Bins with >2000 counts | High rate bins dominated by noise | Noise dominated (total time) | Noise dominated (detector-on time) | Marked lightcurve |
|---|---|---|---|---|---|---|---|
| A | 7674 | 6865 | 6 | 6 | 0.08% | 0.09% | 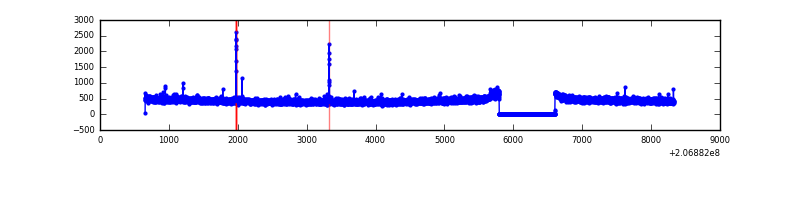 |
| B | 7674 | 6865 | 95 | 95 | 1.24% | 1.38% | 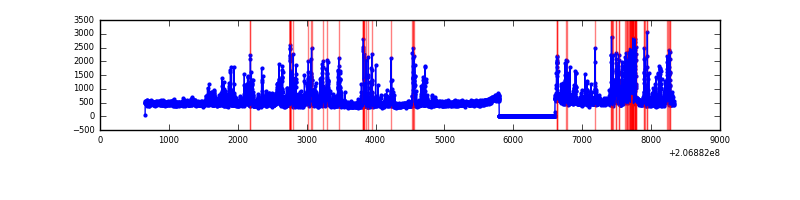 |
| C | 7674 | 6865 | 2 | 2 | 0.03% | 0.03% | 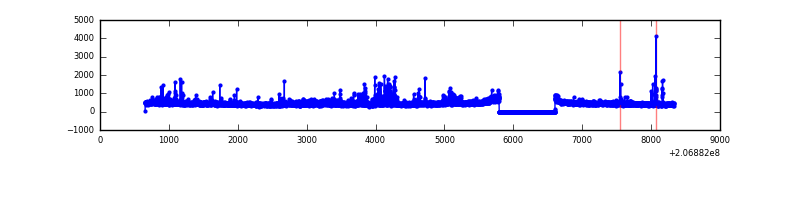 |
| D | 7674 | 6865 | 815 | 815 | 10.62% | 11.87% | 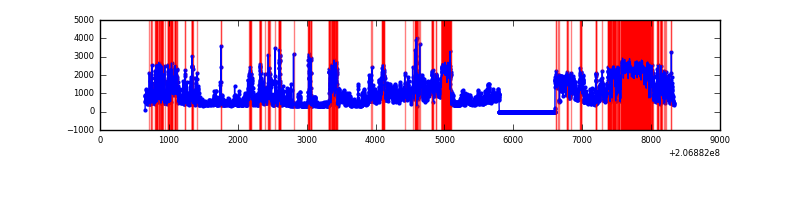 |
Top three noisy pixels from each quadrant. If the there are fewer than three noisy pixels in the level2.evt file, extra rows are filled as -1
| Pixel properties | Quadrant properties | ||||||
|---|---|---|---|---|---|---|---|
| Quadrant | DetID | PixID | Counts | Sigma | Mean | Median | Sigma |
| A | 14 | 111 | 16572 | 100.6 | 774 | 755 | 157.2 |
| A | 0 | 50 | 10507 | 62.03 | 774 | 755 | 157.2 |
| A | 12 | 194 | 8055 | 46.43 | 774 | 755 | 157.2 |
| B | 14 | 167 | 993649 | 6831.03 | 771 | 751 | 145.4 |
| B | 8 | 3 | 48867 | 331.03 | 771 | 751 | 145.4 |
| B | 0 | 231 | 47794 | 323.65 | 771 | 751 | 145.4 |
| C | 9 | 16 | 220935 | 1270.81 | 749 | 749 | 173.3 |
| C | 14 | 48 | 95277 | 545.57 | 749 | 749 | 173.3 |
| C | 9 | 247 | 31462 | 177.26 | 749 | 749 | 173.3 |
| D | 13 | 114 | 3688862 | 21006.24 | 727 | 705 | 175.6 |
| D | 12 | 233 | 174920 | 992.25 | 727 | 705 | 175.6 |
| D | 8 | 112 | 107293 | 607.08 | 727 | 705 | 175.6 |
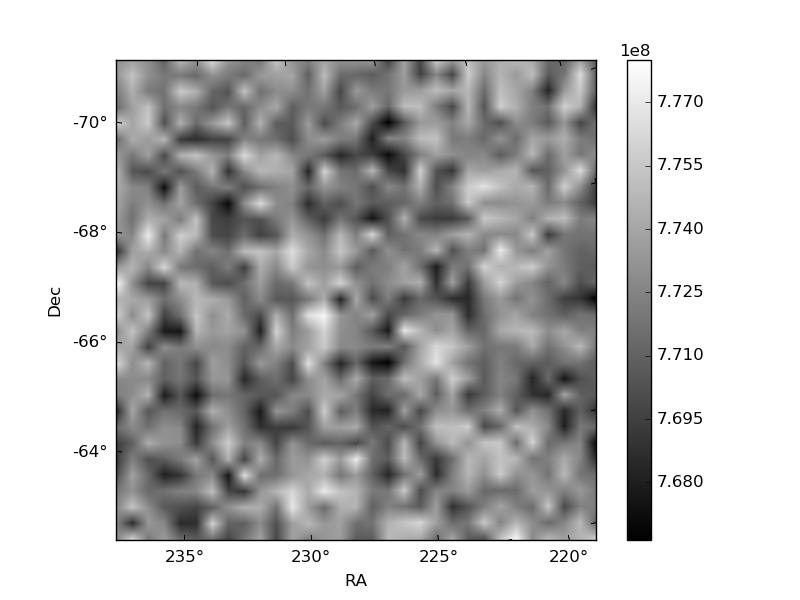
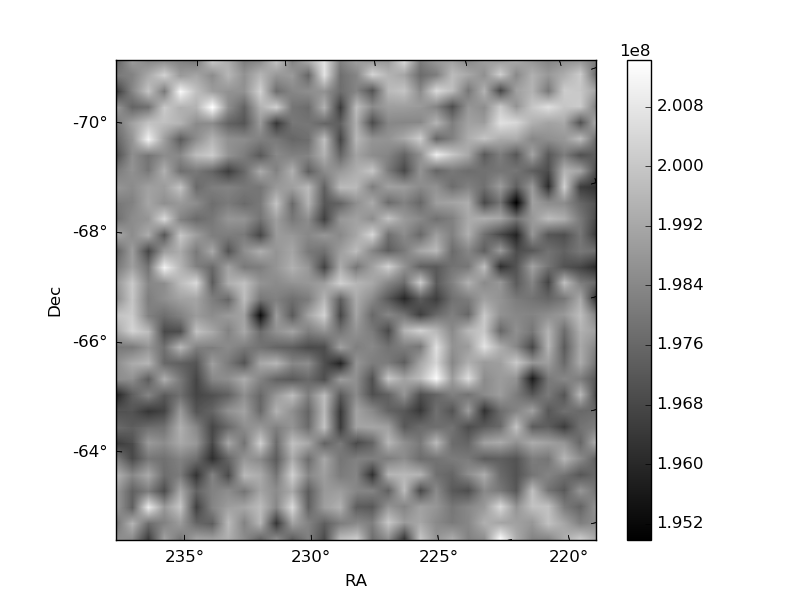
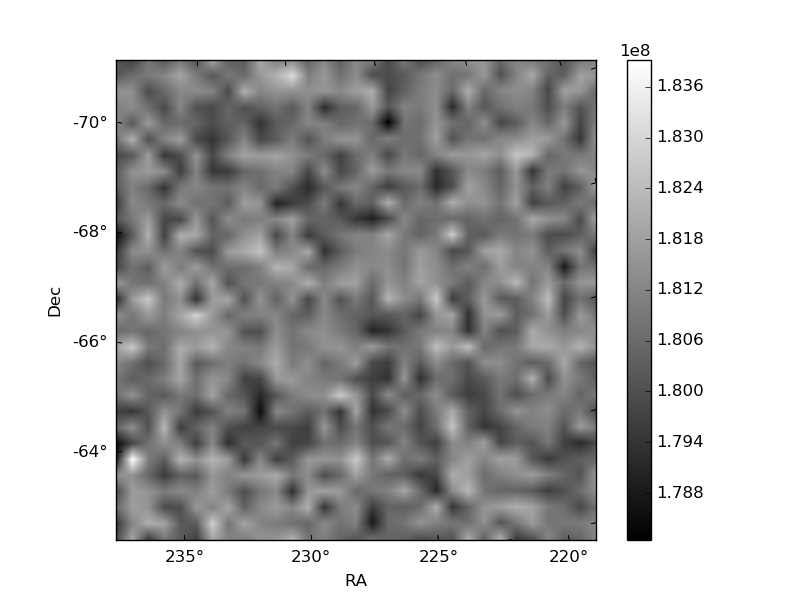
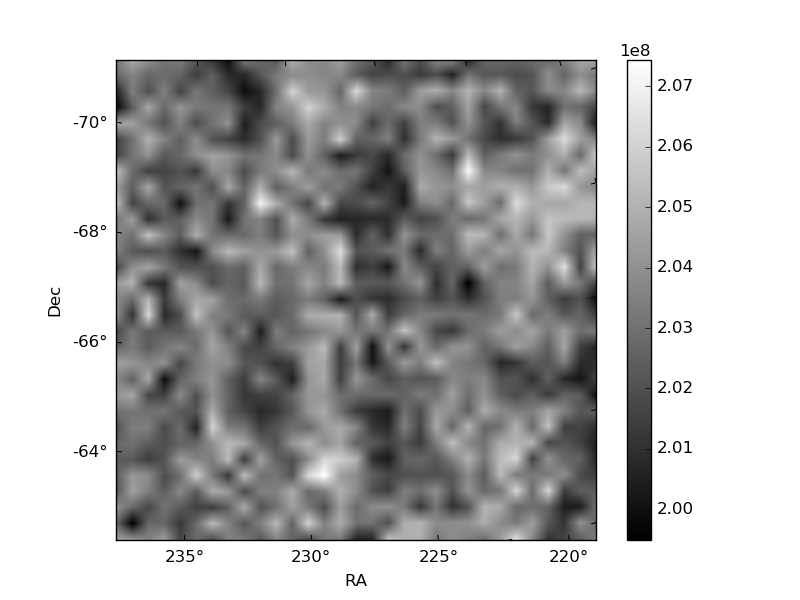
Histogram calculated using DETX and DETY for each event in the final _common_clean file
| Quadrant A | 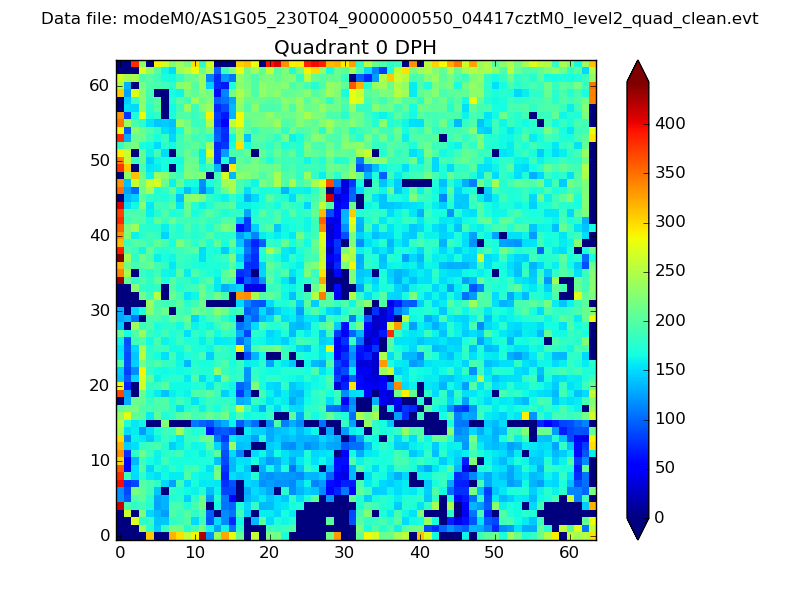 |
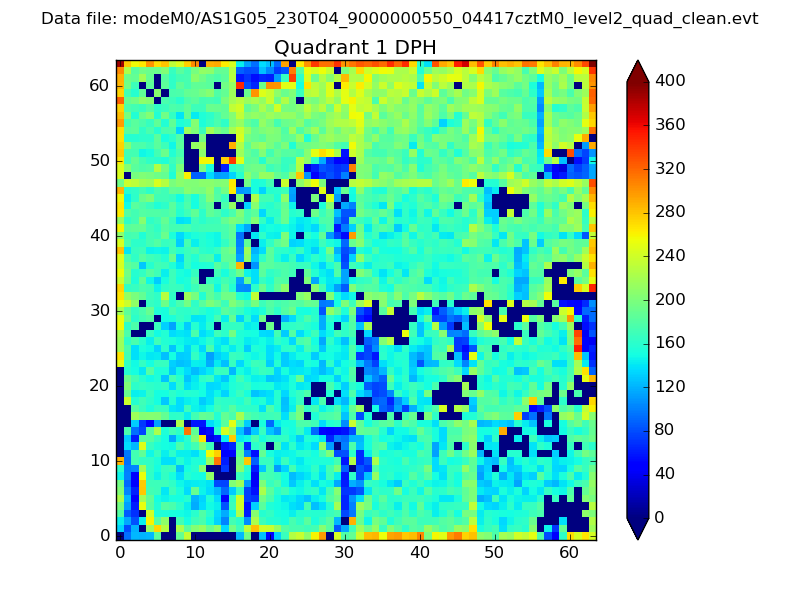 |
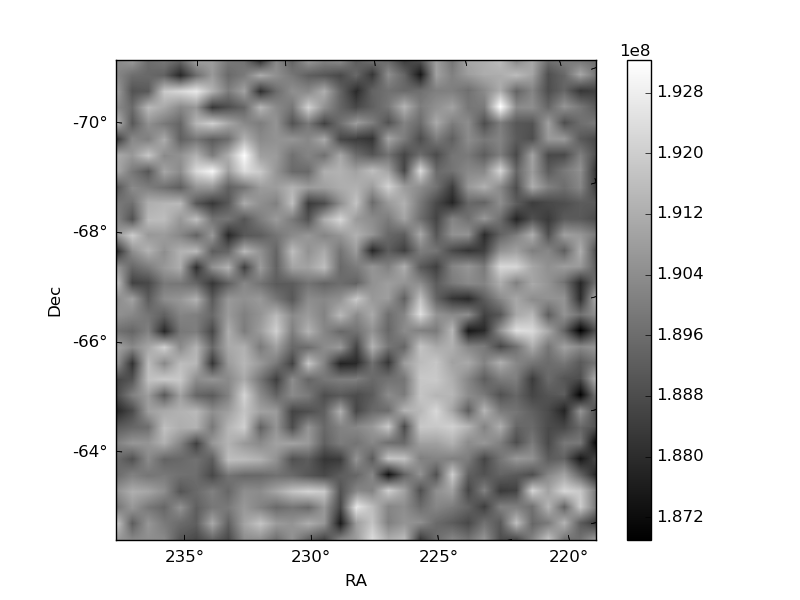
Quadrant B |
|---|---|---|---|
| Quadrant D | 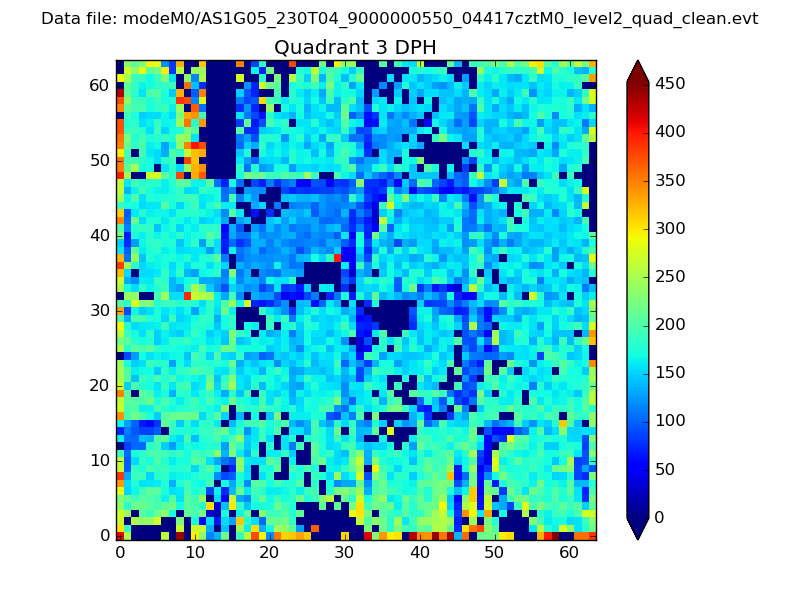 |
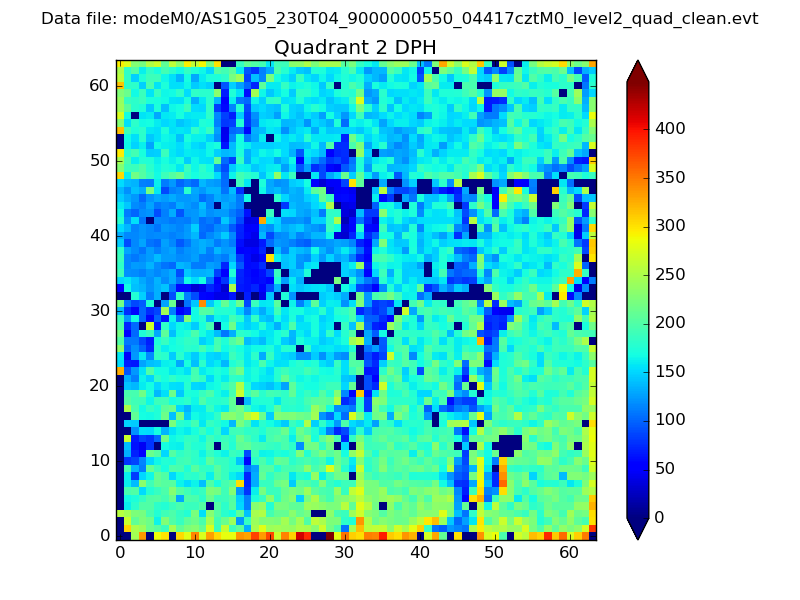 |
Quadrant C |
| Plot type | Count rate plots | Images |
|---|---|---|
| Comparison with Poisson distribution Blue bars denote a histogram of data divided into 1 sec bins. Red curve is a Poisson curve with rate = median count rate of data. |
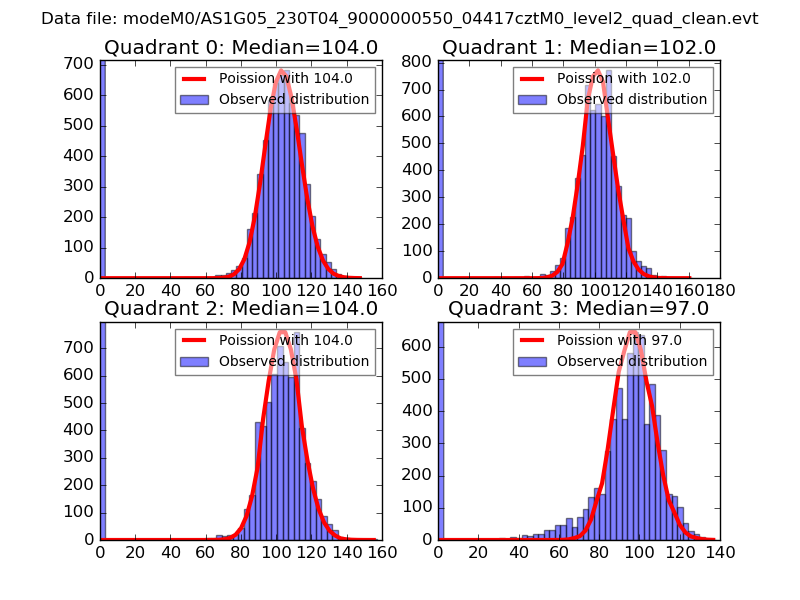 |
 |
| Quadrant-wise count rates Data is divided into 100 sec bins |
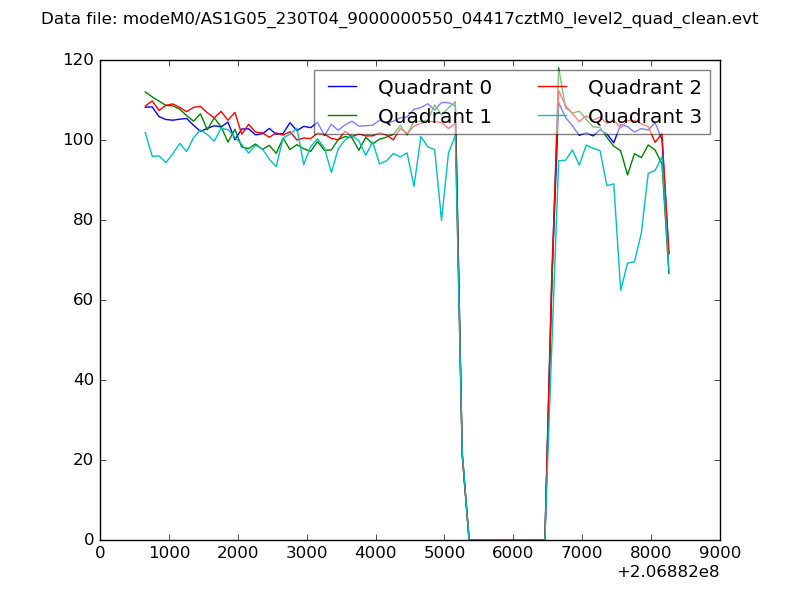 |
|
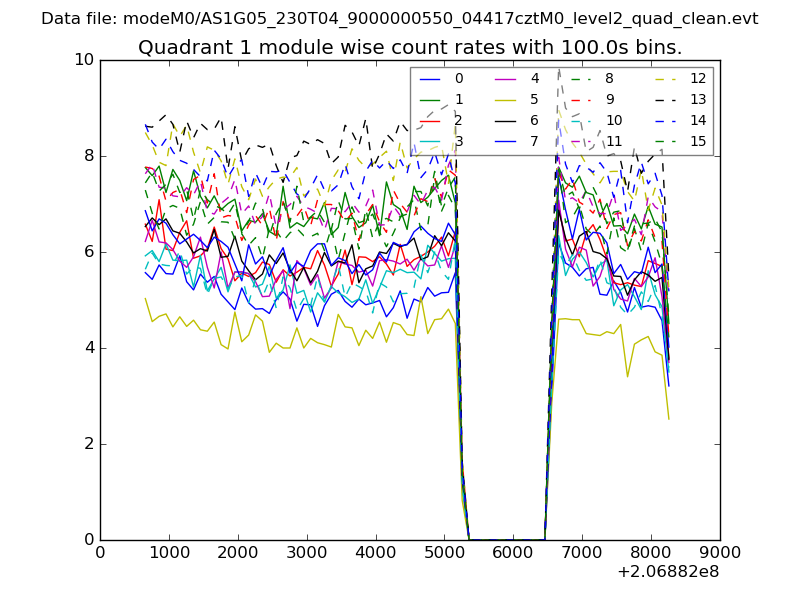
| Module-wise count rates for Quadrant A Data is divided into 100 sec bins |
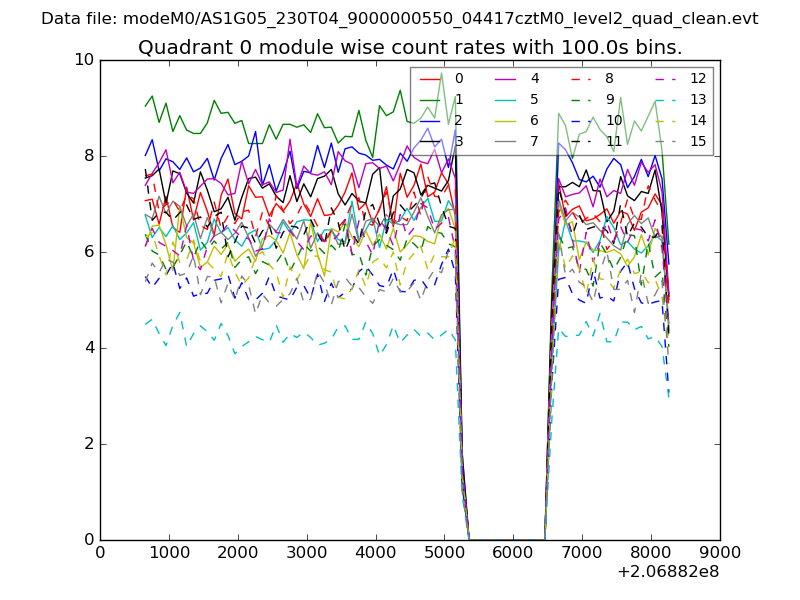 |
 |
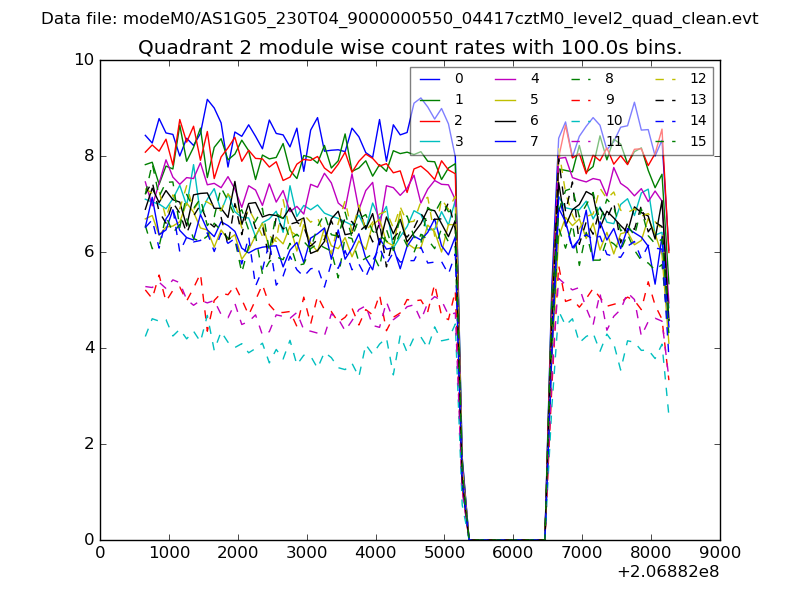
| Module-wise count rates for Quadrant B Data is divided into 100 sec bins |
 |
 |
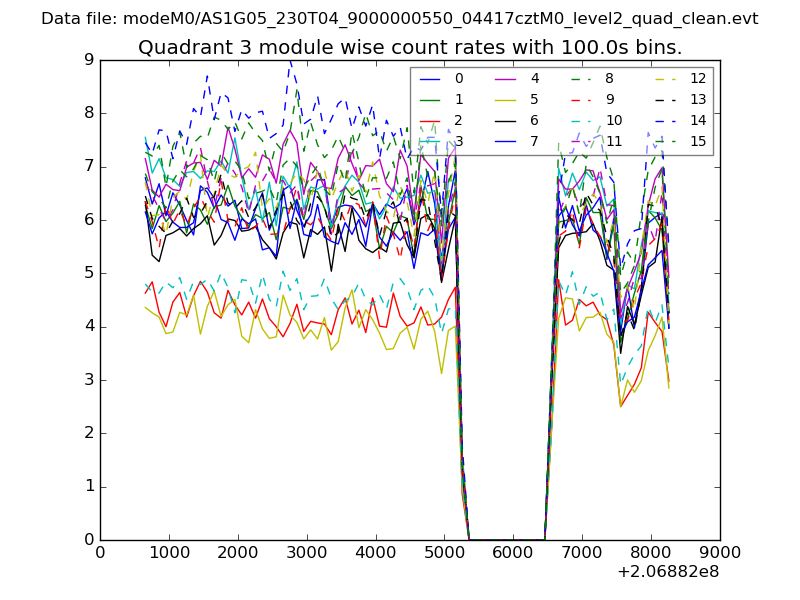
| Module-wise count rates for Quadrant C Data is divided into 100 sec bins |
 |
 |
| Module-wise count rates for Quadrant D Data is divided into 100 sec bins |
 |
 |
| Parameter | Plot |
|---|---|
| CZT HV Monitor | 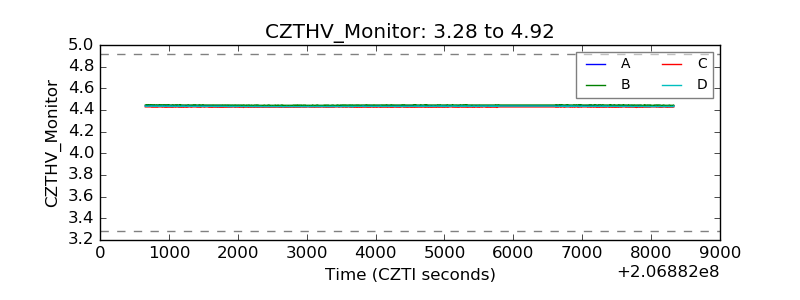 |
| D_VDD | 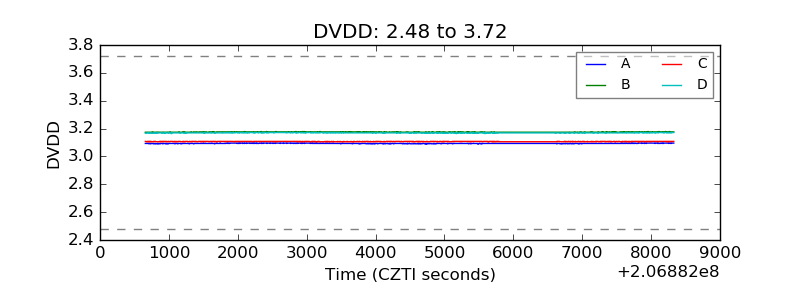 |
| Temperature 1 | 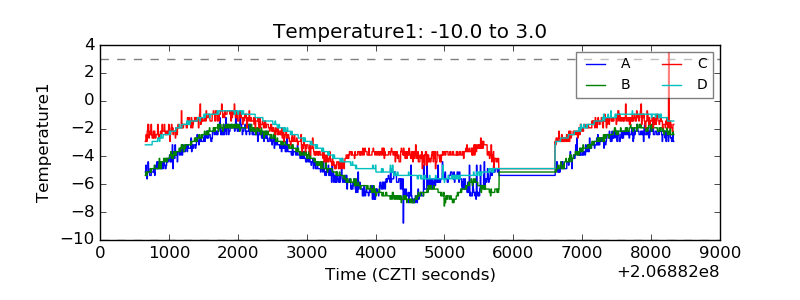 |
| Veto HV Monitor | 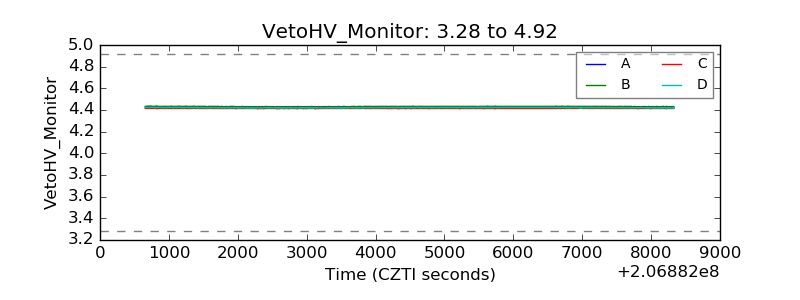 |
| Veto LLD | 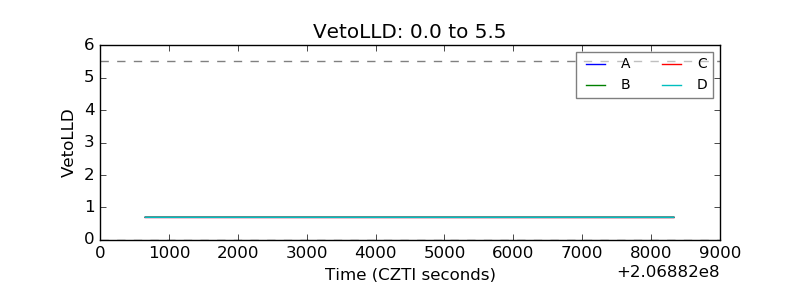 |
| Alpha Counter | 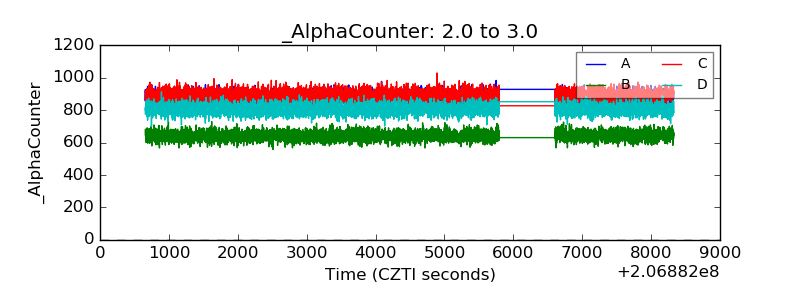 |
| _CPM_Rate | 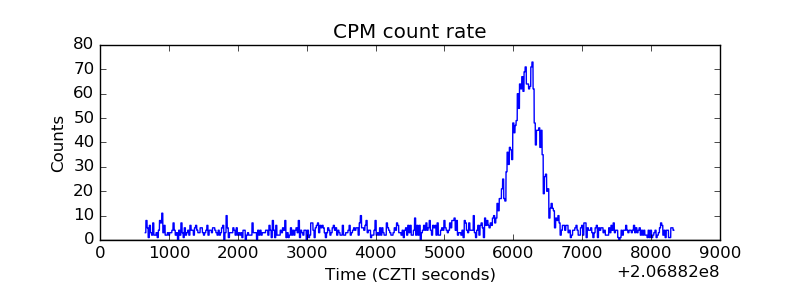 |
| CZT Counter | 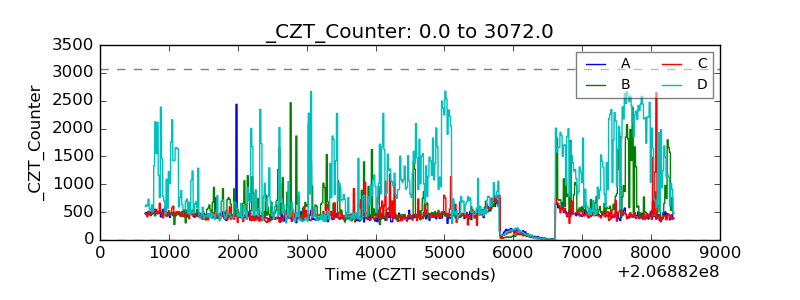 |
| +2.5 Volts monitor |  |
| +5 Volts monitor |  |
| _ROLL_ROT | 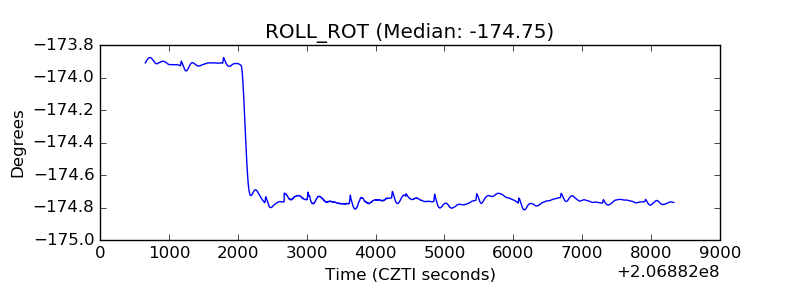 |
| _Roll_DEC | 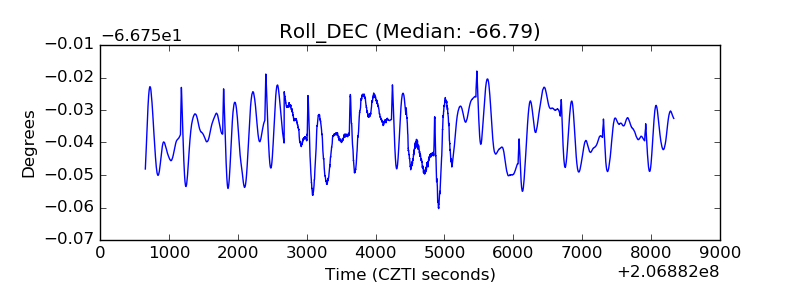 |
| _Roll_RA | 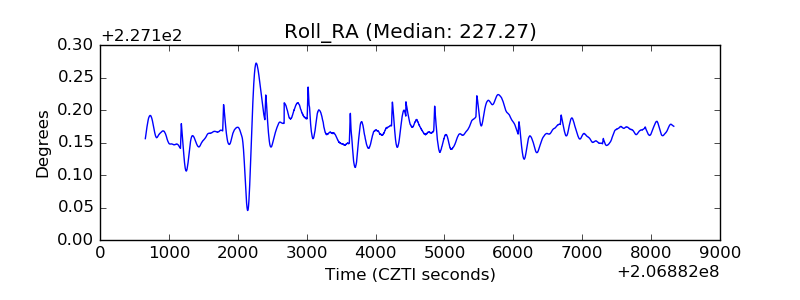 |
| Veto Counter | 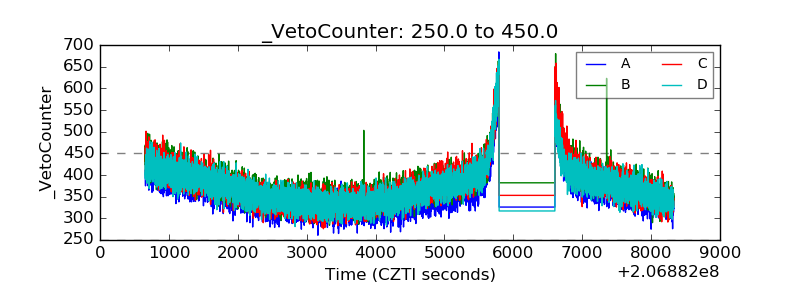 |