| Param | Original file | Final file |
|---|---|---|
| Filename | modeM0/AS1G05_230T04_9000000550_04419cztM0_level2.evt | modeM0/AS1G05_230T04_9000000550_04419cztM0_level2_quad_clean.evt |
| Size (bytes) | 622,886,400 | 107,153,280 |
| Size | 594.0 MB | 102.2 MB |
| Events in quadrant A | 3,453,673 | 694,719 |
| Events in quadrant B | 4,687,697 | 675,924 |
| Events in quadrant C | 3,437,836 | 694,592 |
| Events in quadrant D | 6,763,635 | 644,530 |
| Mode SS | |||
|---|---|---|---|
| Quadrant | BADHDUFLAG | Total packets | Discarded packets |
| A | 0 | 156 | 0 |
| B | 0 | 156 | 0 |
| C | 0 | 156 | 0 |
| D | 0 | 156 | 0 |
| Mode M9 | |||
|---|---|---|---|
| Quadrant | BADHDUFLAG | Total packets | Discarded packets |
| A | 0 | 1 | 0 |
| B | 0 | 1 | 0 |
| C | 0 | 1 | 0 |
| D | 0 | 1 | 0 |
| Mode M0 | |||
|---|---|---|---|
| Quadrant | BADHDUFLAG | Total packets | Discarded packets |
| A | 0 | 15894 | 3 |
| B | 0 | 19302 | 2 |
| C | 0 | 16043 | 2 |
| D | 0 | 25586 | 2 |
| Quadrant | Total seconds | Saturated seconds | Saturation percentage |
|---|---|---|---|
| A | 7689 | 68 | 0.884380% |
| B | 7689 | 361 | 4.695019% |
| C | 7689 | 59 | 0.767330% |
| D | 7689 | 890 | 11.574977% |
Noise dominated data is calculated using 1-second bins in cleaned event files. If a bin has >2000 counts, and if more than 50% of those come from <1% of pixels, then it is considered to be noise-dominated and hence unusable.
| Quadrant | # 1 sec bins | Bins with >0 counts | Bins with >2000 counts | High rate bins dominated by noise | Noise dominated (total time) | Noise dominated (detector-on time) | Marked lightcurve |
|---|---|---|---|---|---|---|---|
| A | 7814 | 7691 | 6 | 6 | 0.08% | 0.08% | 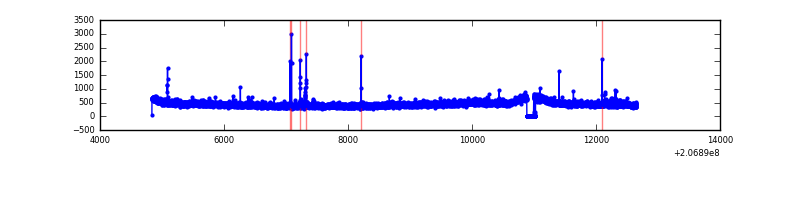 |
| B | 7814 | 7691 | 178 | 178 | 2.28% | 2.31% | 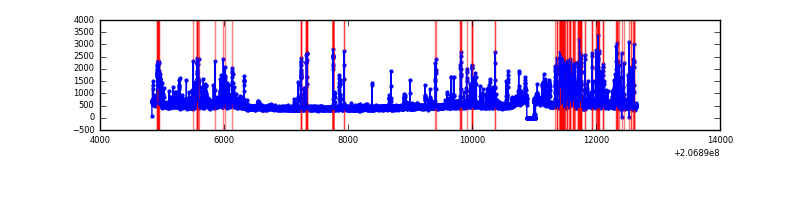 |
| C | 7814 | 7691 | 19 | 19 | 0.24% | 0.25% | 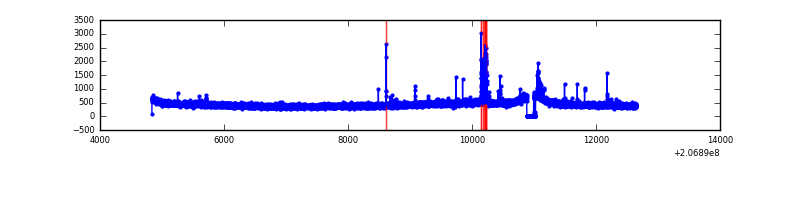 |
| D | 7814 | 7691 | 1150 | 1150 | 14.72% | 14.95% | 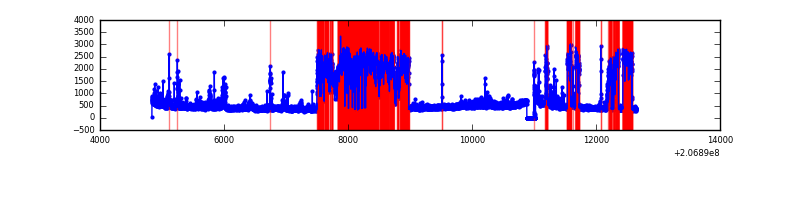 |
Top three noisy pixels from each quadrant. If the there are fewer than three noisy pixels in the level2.evt file, extra rows are filled as -1
| Pixel properties | Quadrant properties | ||||||
|---|---|---|---|---|---|---|---|
| Quadrant | DetID | PixID | Counts | Sigma | Mean | Median | Sigma |
| A | 0 | 50 | 23984 | 127.92 | 878 | 860 | 180.8 |
| A | 13 | 251 | 21607 | 114.77 | 878 | 860 | 180.8 |
| A | 0 | 226 | 9030 | 45.2 | 878 | 860 | 180.8 |
| B | 14 | 167 | 1065718 | 6404.67 | 873 | 852 | 166.3 |
| B | 10 | 16 | 79156 | 470.96 | 873 | 852 | 166.3 |
| B | 8 | 3 | 47460 | 280.33 | 873 | 852 | 166.3 |
| C | 9 | 16 | 120663 | 612.12 | 846 | 846 | 195.7 |
| C | 12 | 4 | 9229 | 42.83 | 846 | 846 | 195.7 |
| C | 13 | 61 | 7136 | 32.13 | 846 | 846 | 195.7 |
| D | 13 | 114 | 3235052 | 16002.37 | 830 | 804 | 202.1 |
| D | 12 | 227 | 135600 | 666.94 | 830 | 804 | 202.1 |
| D | 8 | 112 | 50095 | 243.88 | 830 | 804 | 202.1 |
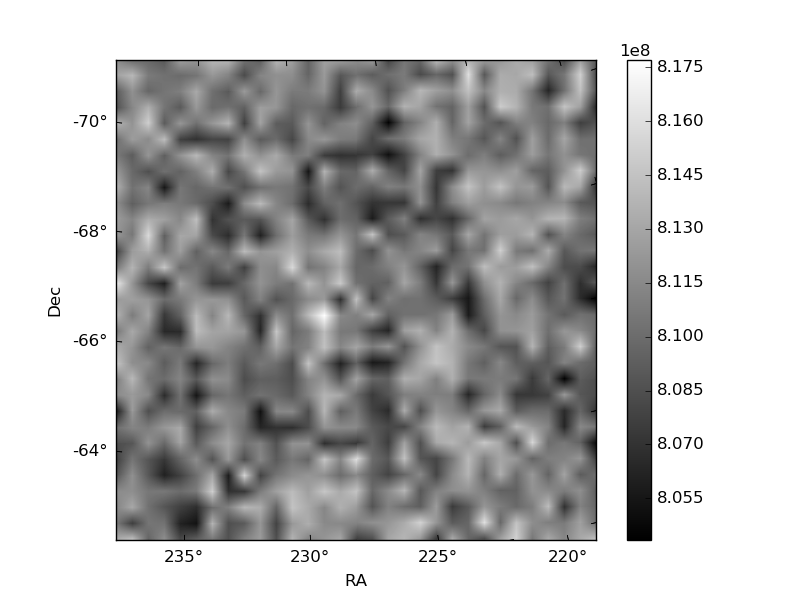
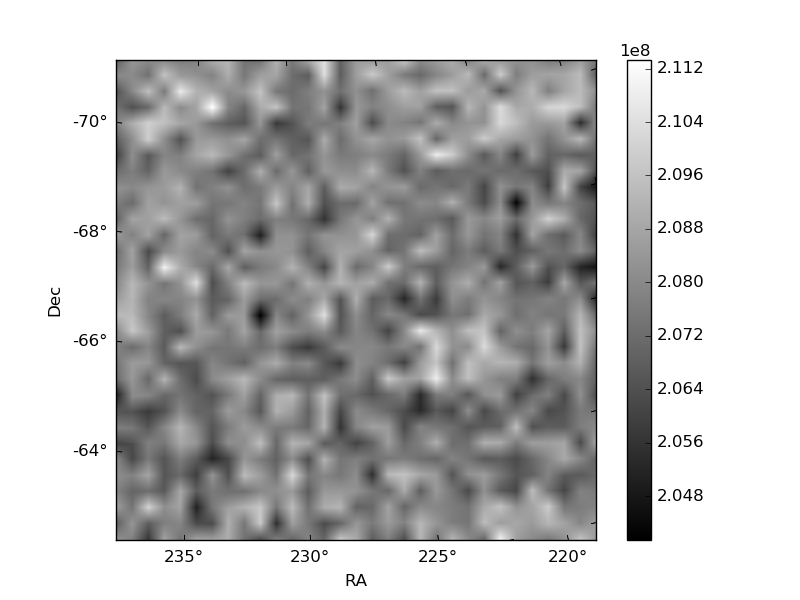
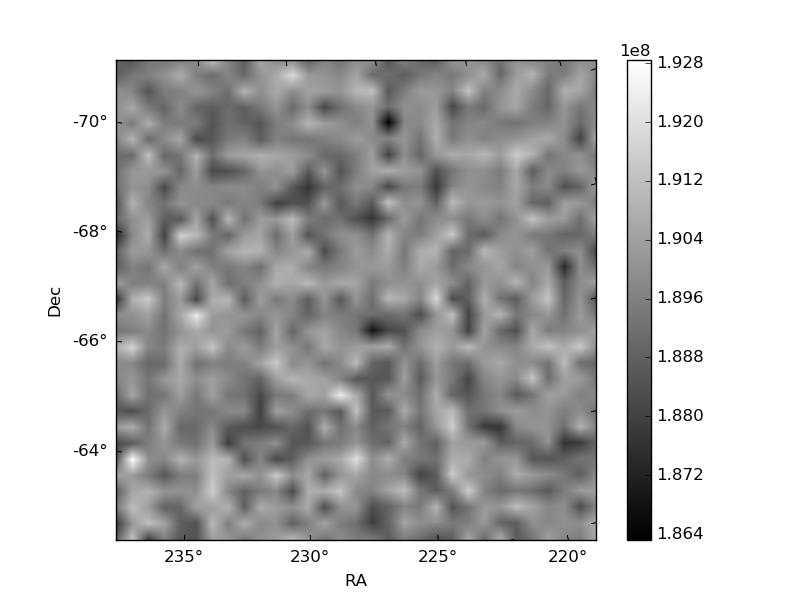
Histogram calculated using DETX and DETY for each event in the final _common_clean file
| Quadrant A | 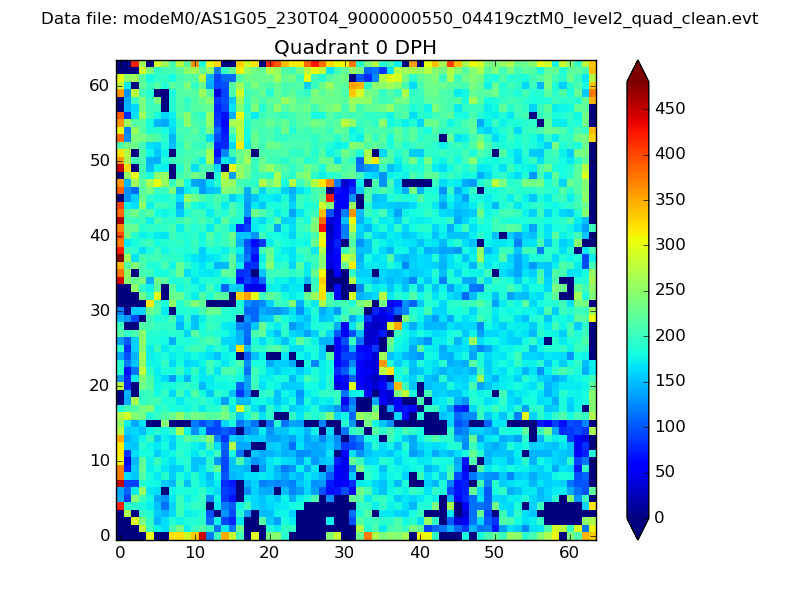 |
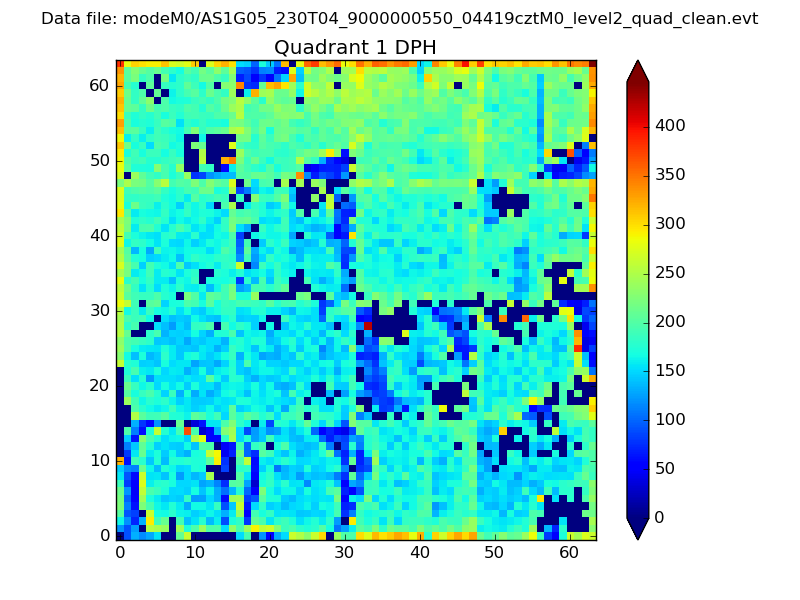 |
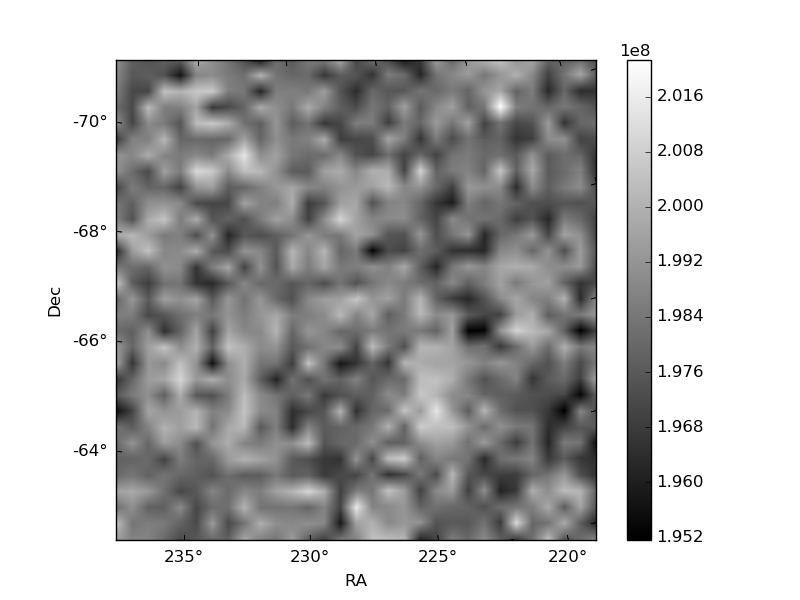
Quadrant B |
|---|---|---|---|
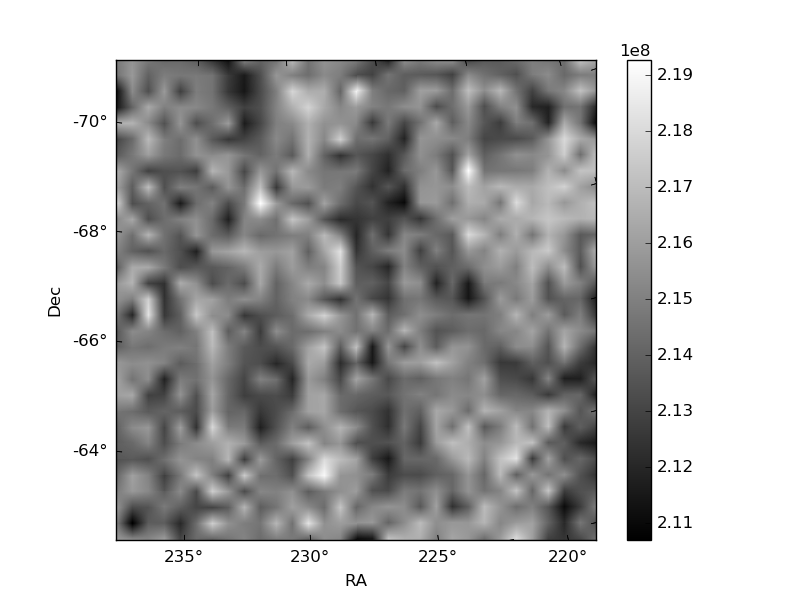
| Quadrant D | 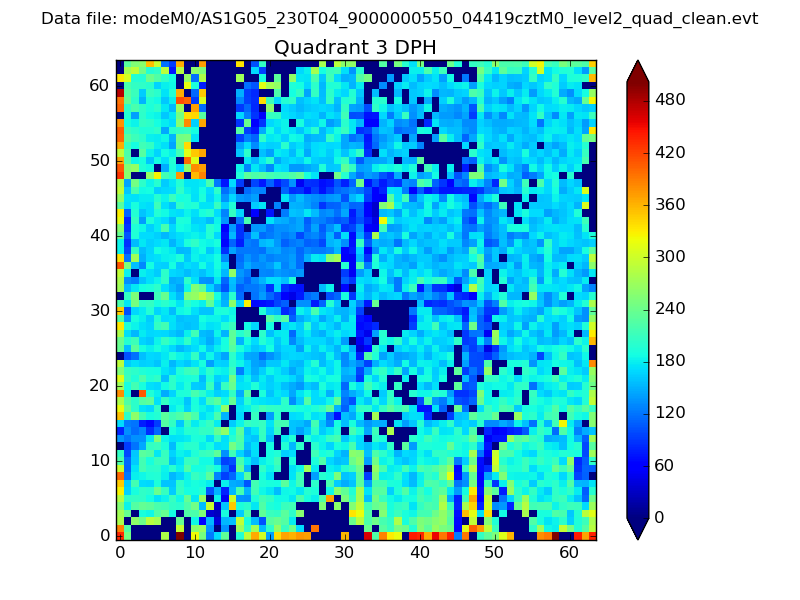 |
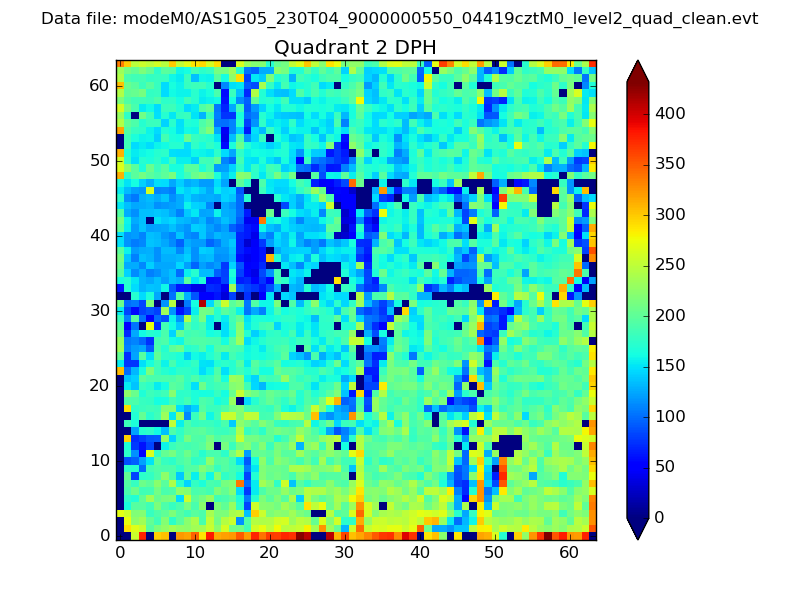 |
Quadrant C |
| Plot type | Count rate plots | Images |
|---|---|---|
| Comparison with Poisson distribution Blue bars denote a histogram of data divided into 1 sec bins. Red curve is a Poisson curve with rate = median count rate of data. |
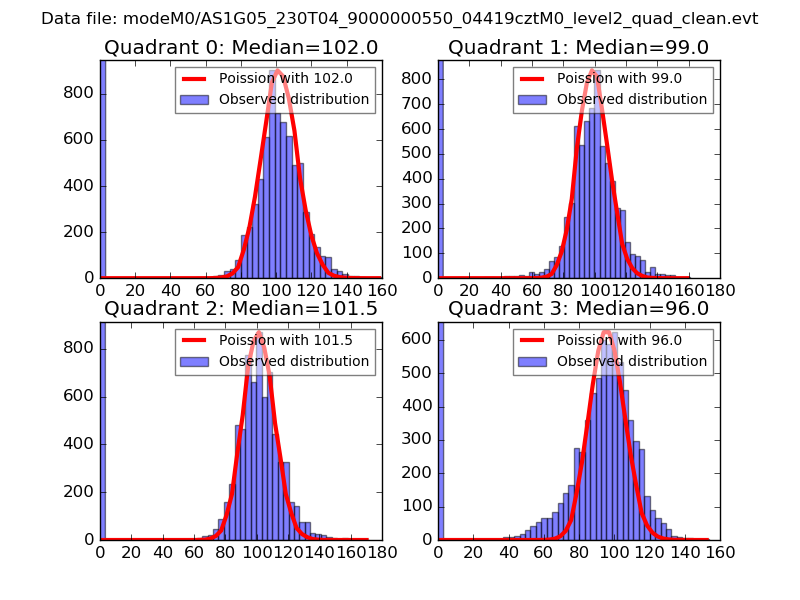 |
 |
| Quadrant-wise count rates Data is divided into 100 sec bins |
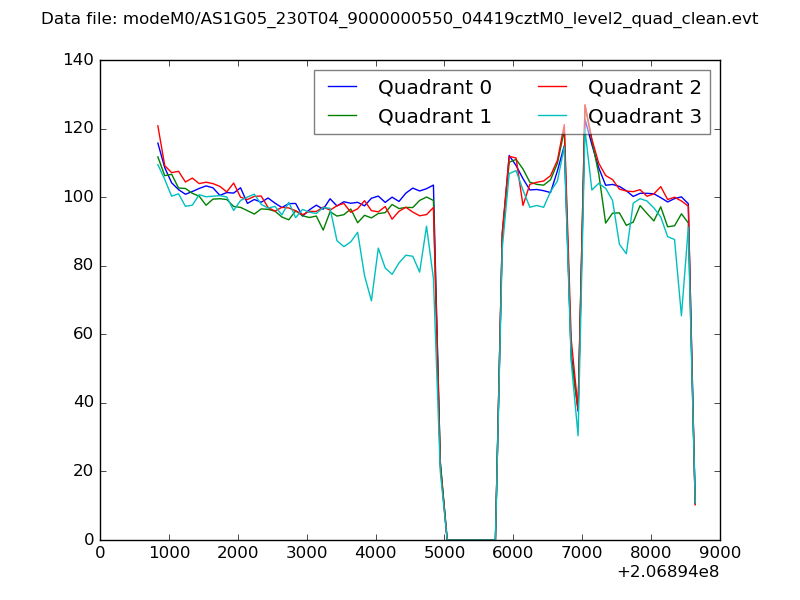 |
|
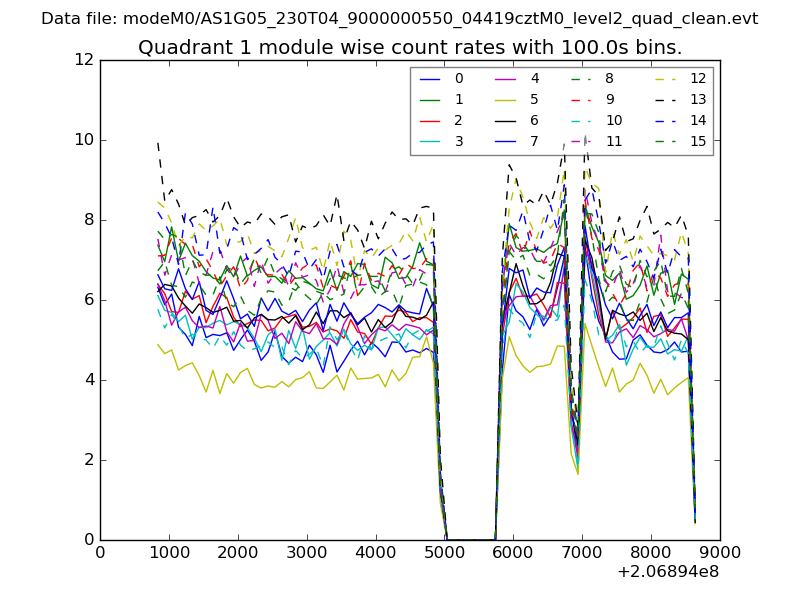
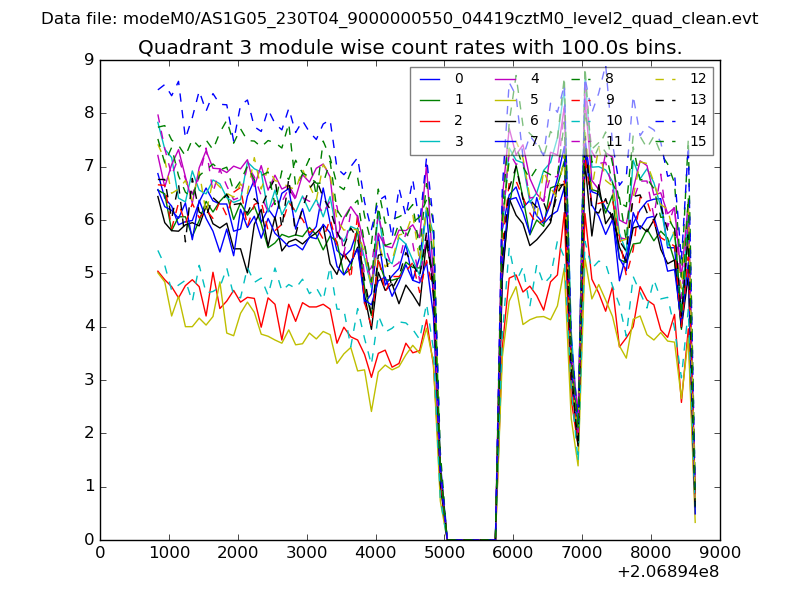
| Module-wise count rates for Quadrant A Data is divided into 100 sec bins |
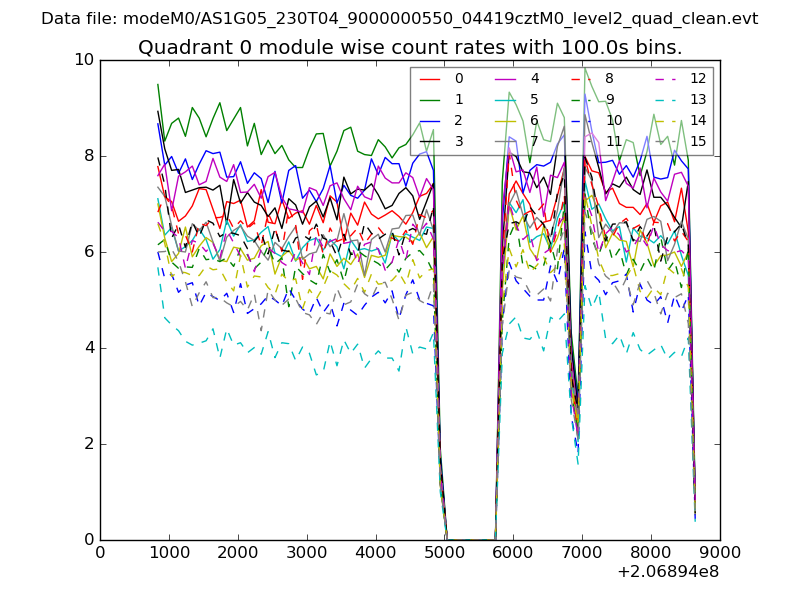 |
 |
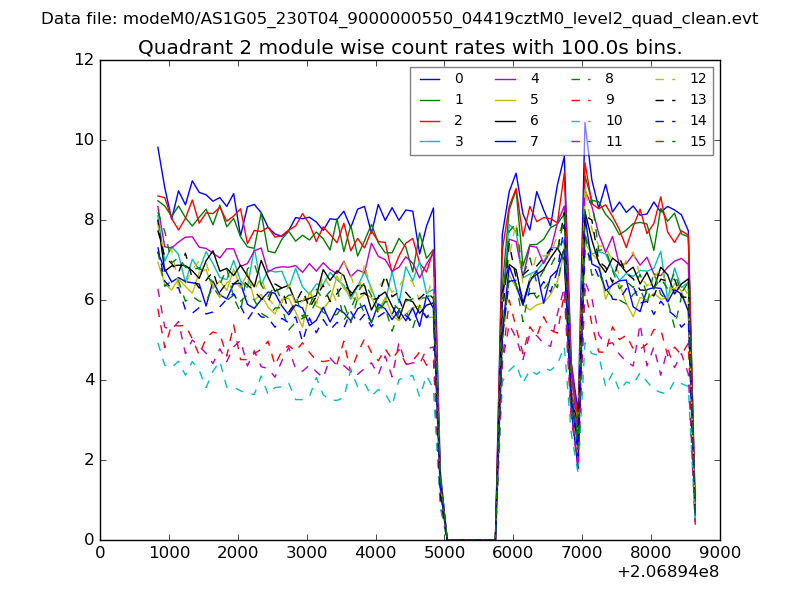
| Module-wise count rates for Quadrant B Data is divided into 100 sec bins |
 |
 |
| Module-wise count rates for Quadrant C Data is divided into 100 sec bins |
 |
 |
| Module-wise count rates for Quadrant D Data is divided into 100 sec bins |
 |
 |
| Parameter | Plot |
|---|---|
| CZT HV Monitor | 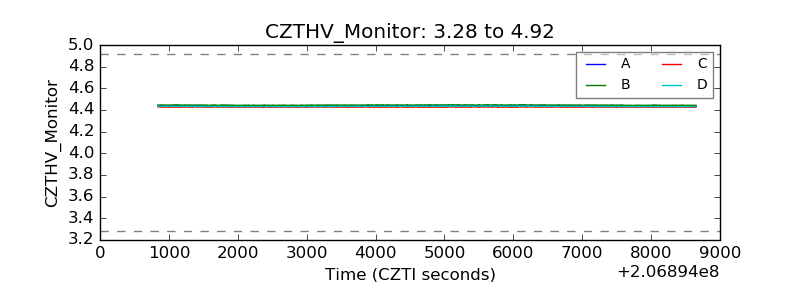 |
| D_VDD | 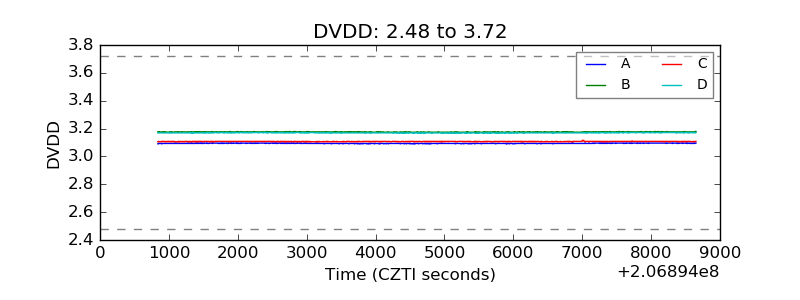 |
| Temperature 1 | 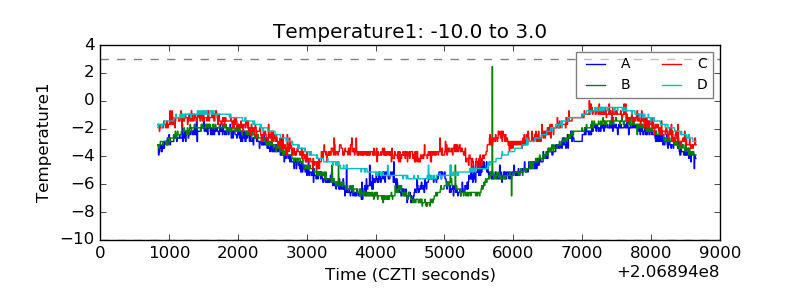 |
| Veto HV Monitor | 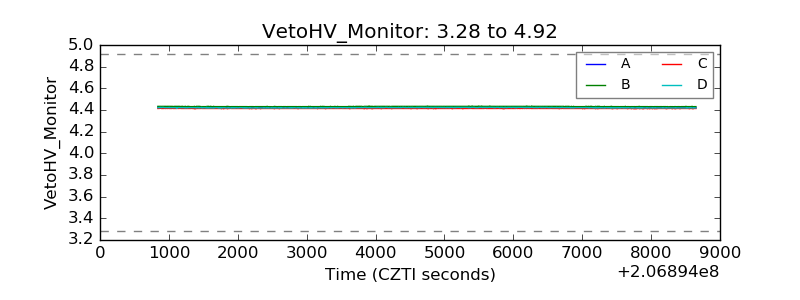 |
| Veto LLD | 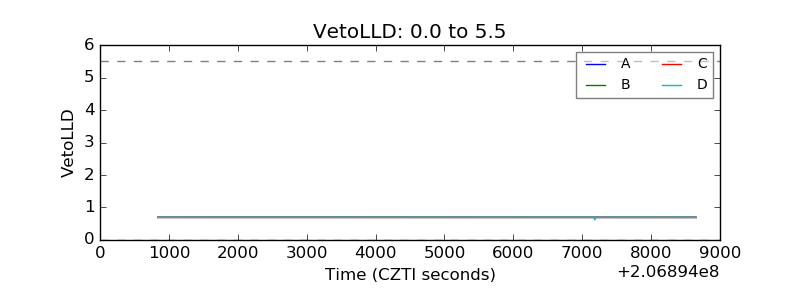 |
| Alpha Counter | 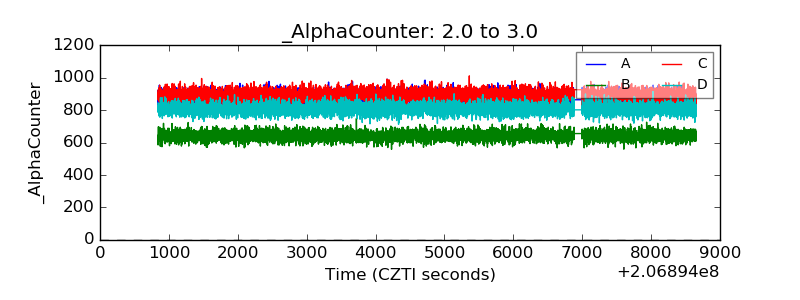 |
| _CPM_Rate | 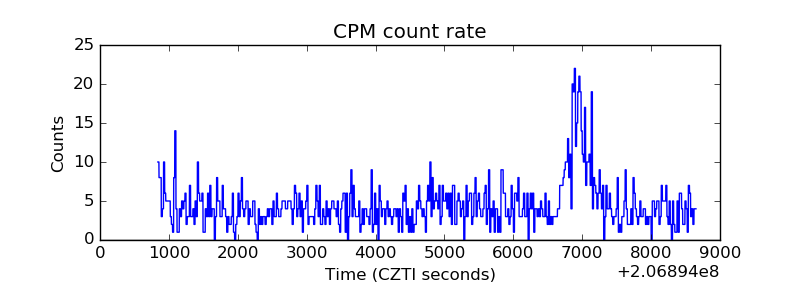 |
| CZT Counter | 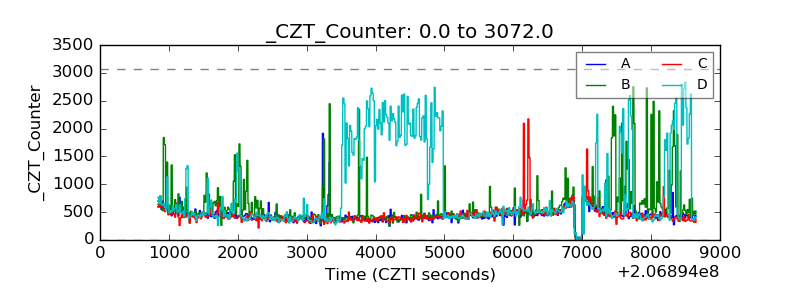 |
| +2.5 Volts monitor | 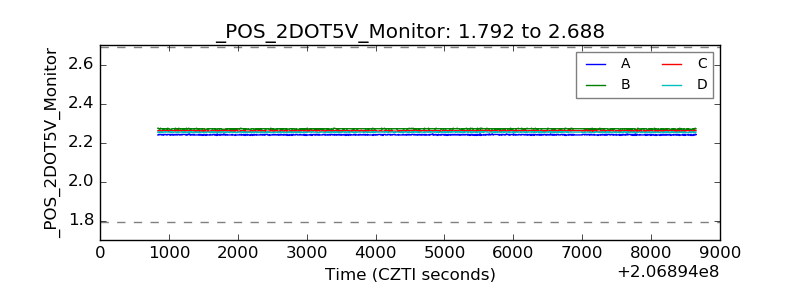 |
| +5 Volts monitor |  |
| _ROLL_ROT | 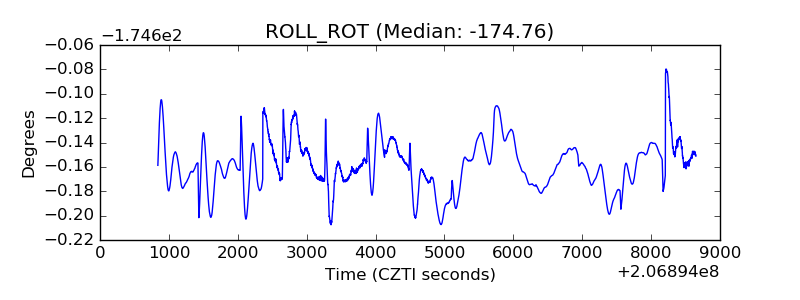 |
| _Roll_DEC | 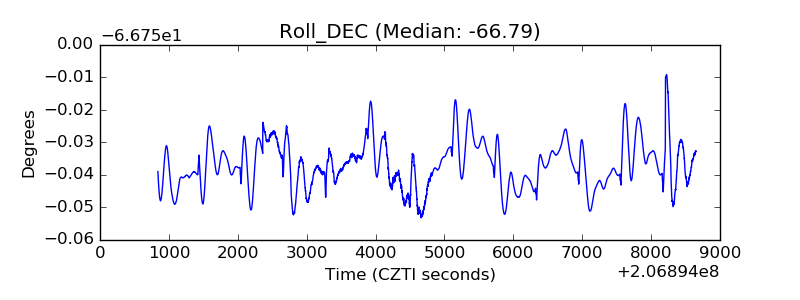 |
| _Roll_RA | 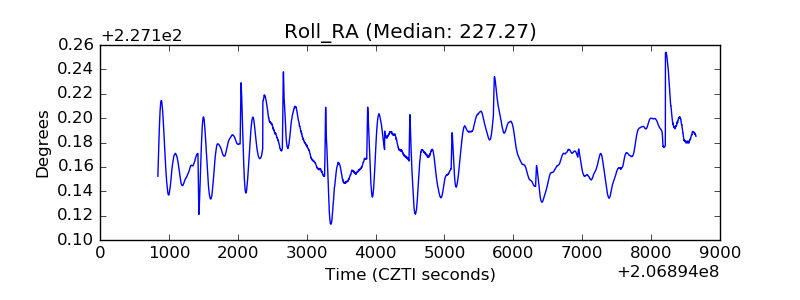 |
| Veto Counter | 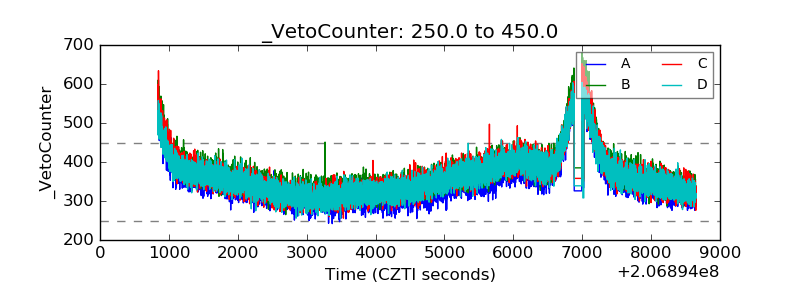 |