| Param | Original file | Final file |
|---|---|---|
| Filename | modeM0/AS1G05_230T04_9000000550_04420cztM0_level2.evt | modeM0/AS1G05_230T04_9000000550_04420cztM0_level2_quad_clean.evt |
| Size (bytes) | 635,267,520 | 95,765,760 |
| Size | 605.8 MB | 91.3 MB |
| Events in quadrant A | 3,797,026 | 617,890 |
| Events in quadrant B | 4,516,637 | 603,823 |
| Events in quadrant C | 2,993,009 | 622,896 |
| Events in quadrant D | 7,452,164 | 561,229 |
| Mode SS | |||
|---|---|---|---|
| Quadrant | BADHDUFLAG | Total packets | Discarded packets |
| A | 0 | 142 | 0 |
| B | 0 | 142 | 0 |
| C | 0 | 142 | 0 |
| D | 0 | 142 | 0 |
| Mode M9 | |||
|---|---|---|---|
| Quadrant | BADHDUFLAG | Total packets | Discarded packets |
| A | 0 | 4 | 0 |
| B | 0 | 4 | 0 |
| C | 0 | 4 | 0 |
| D | 0 | 4 | 0 |
| Mode M0 | |||
|---|---|---|---|
| Quadrant | BADHDUFLAG | Total packets | Discarded packets |
| A | 0 | 16444 | 2 |
| B | 0 | 18354 | 1 |
| C | 0 | 14362 | 1 |
| D | 0 | 27294 | 1 |
| Quadrant | Total seconds | Saturated seconds | Saturation percentage |
|---|---|---|---|
| A | 7095 | 197 | 2.776603% |
| B | 7095 | 350 | 4.933051% |
| C | 7095 | 10 | 0.140944% |
| D | 7095 | 1204 | 16.969697% |
Noise dominated data is calculated using 1-second bins in cleaned event files. If a bin has >2000 counts, and if more than 50% of those come from <1% of pixels, then it is considered to be noise-dominated and hence unusable.
| Quadrant | # 1 sec bins | Bins with >0 counts | Bins with >2000 counts | High rate bins dominated by noise | Noise dominated (total time) | Noise dominated (detector-on time) | Marked lightcurve |
|---|---|---|---|---|---|---|---|
| A | 7445 | 7096 | 105 | 105 | 1.41% | 1.48% | 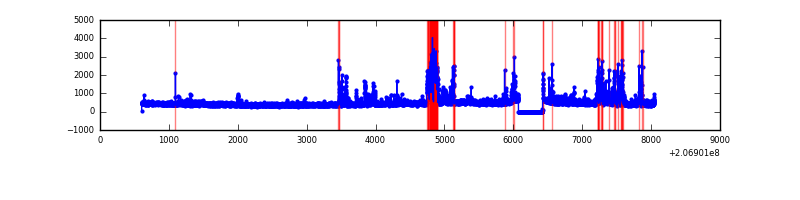 |
| B | 7445 | 7096 | 236 | 236 | 3.17% | 3.33% | 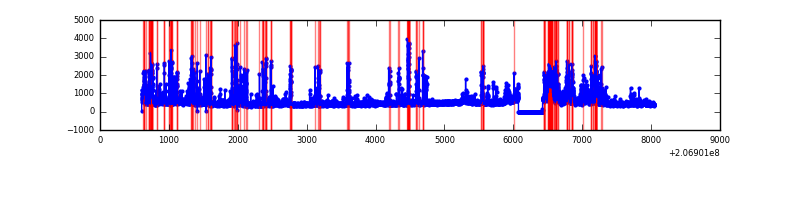 |
| C | 7445 | 7096 | 0 | 0 | 0.00% | 0.00% | 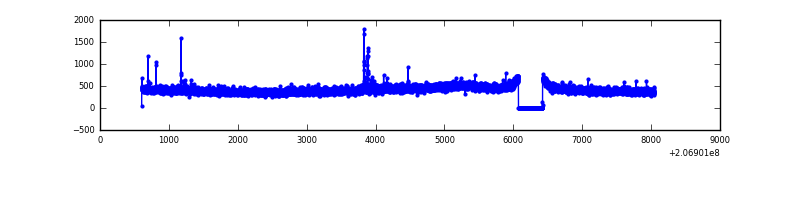 |
| D | 7445 | 7096 | 1421 | 1421 | 19.09% | 20.03% | 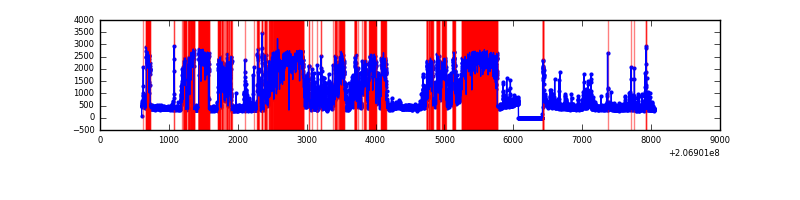 |
Top three noisy pixels from each quadrant. If the there are fewer than three noisy pixels in the level2.evt file, extra rows are filled as -1
| Pixel properties | Quadrant properties | ||||||
|---|---|---|---|---|---|---|---|
| Quadrant | DetID | PixID | Counts | Sigma | Mean | Median | Sigma |
| A | 0 | 13 | 546089 | 3406.56 | 779 | 762 | 160.1 |
| A | 13 | 251 | 145967 | 907.07 | 779 | 762 | 160.1 |
| A | 0 | 50 | 62466 | 385.45 | 779 | 762 | 160.1 |
| B | 10 | 16 | 839440 | 5585.23 | 777 | 757 | 150.2 |
| B | 14 | 167 | 593871 | 3949.85 | 777 | 757 | 150.2 |
| B | 15 | 204 | 20592 | 132.09 | 777 | 757 | 150.2 |
| C | 9 | 16 | 25514 | 140.68 | 756 | 758 | 176.0 |
| C | 12 | 4 | 12131 | 64.63 | 756 | 758 | 176.0 |
| C | 13 | 61 | 6276 | 31.36 | 756 | 758 | 176.0 |
| D | 13 | 114 | 4426526 | 25267.17 | 720 | 698 | 175.2 |
| D | 2 | 136 | 74888 | 423.55 | 720 | 698 | 175.2 |
| D | 13 | 239 | 55688 | 313.94 | 720 | 698 | 175.2 |
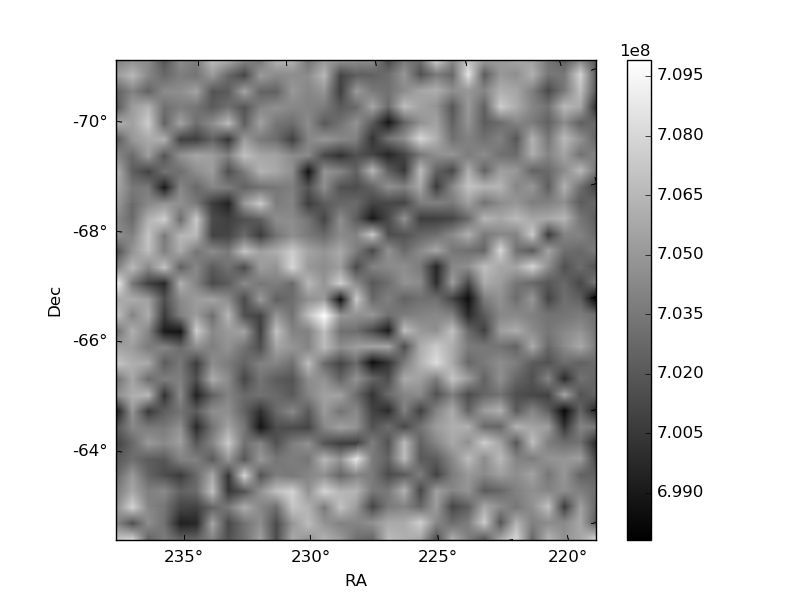
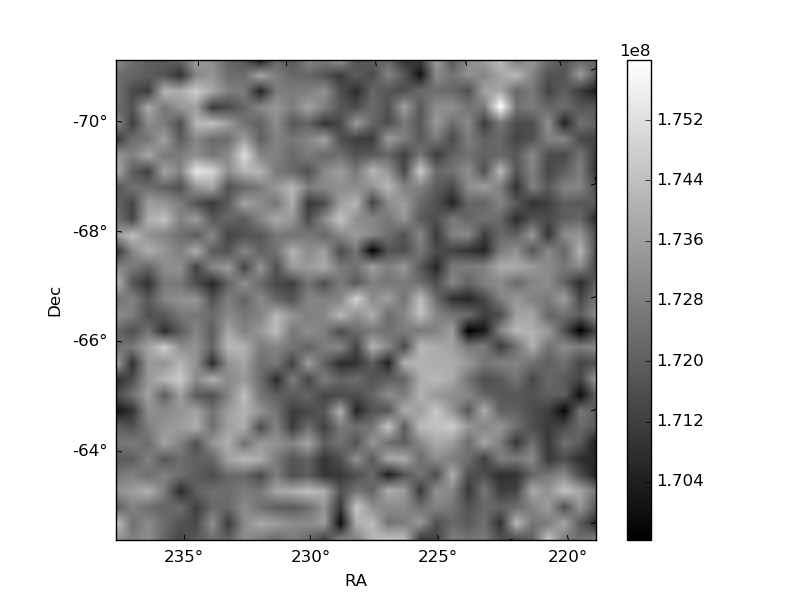
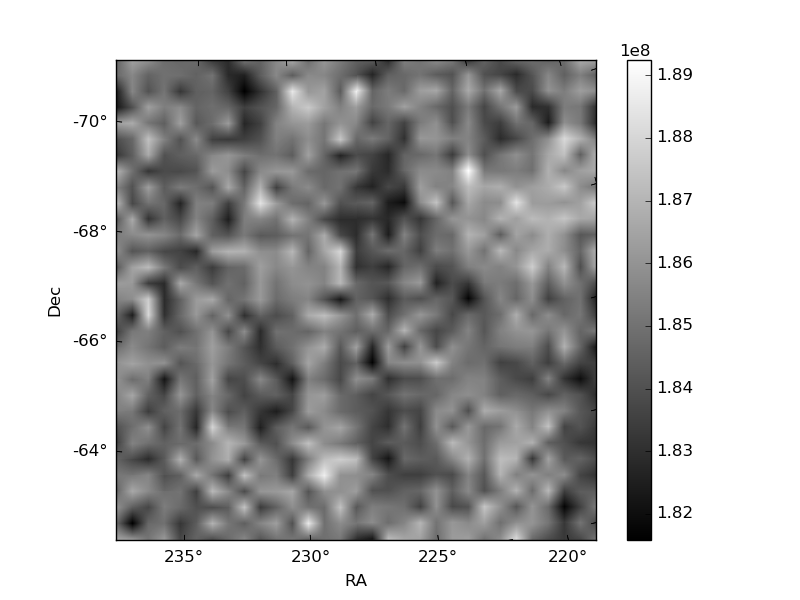
Histogram calculated using DETX and DETY for each event in the final _common_clean file
| Quadrant A | 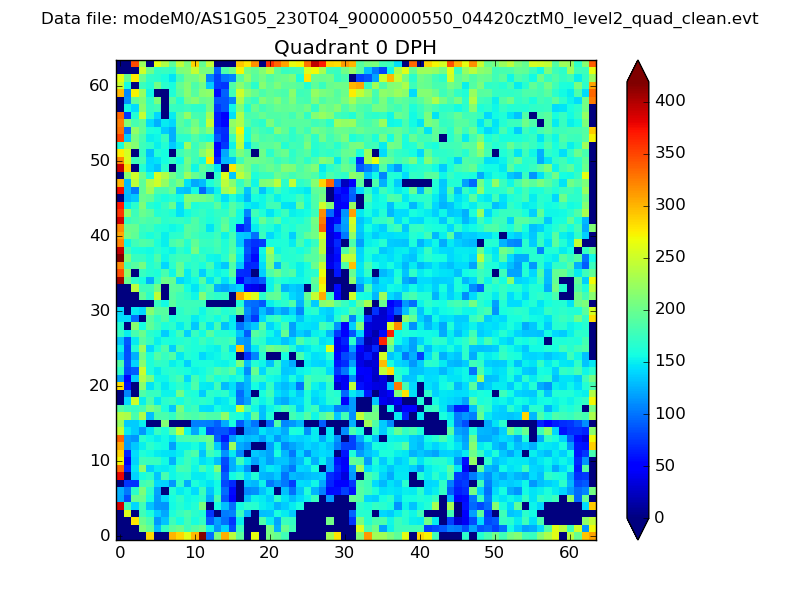 |
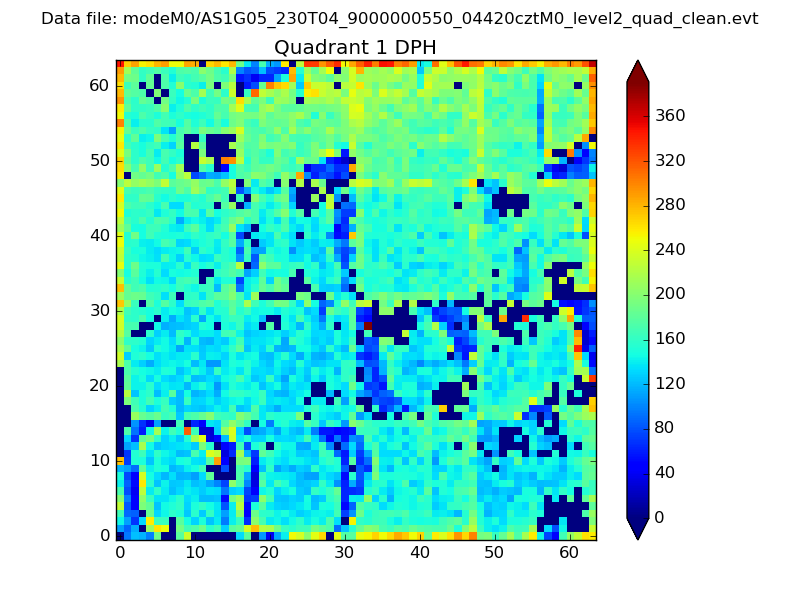 |
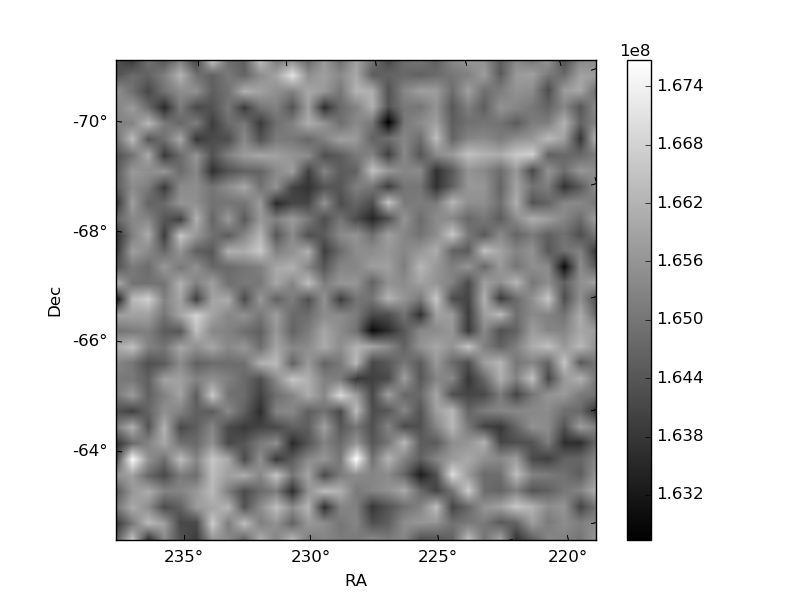
Quadrant B |
|---|---|---|---|
| Quadrant D | 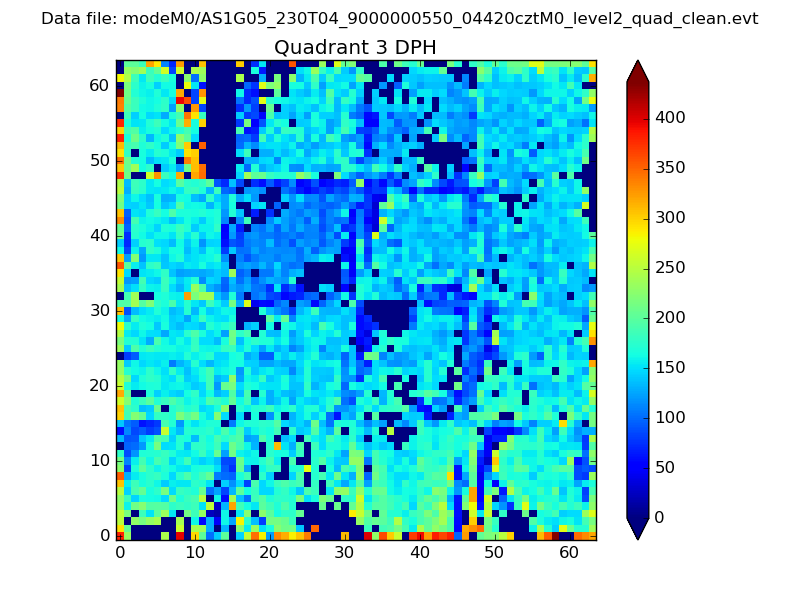 |
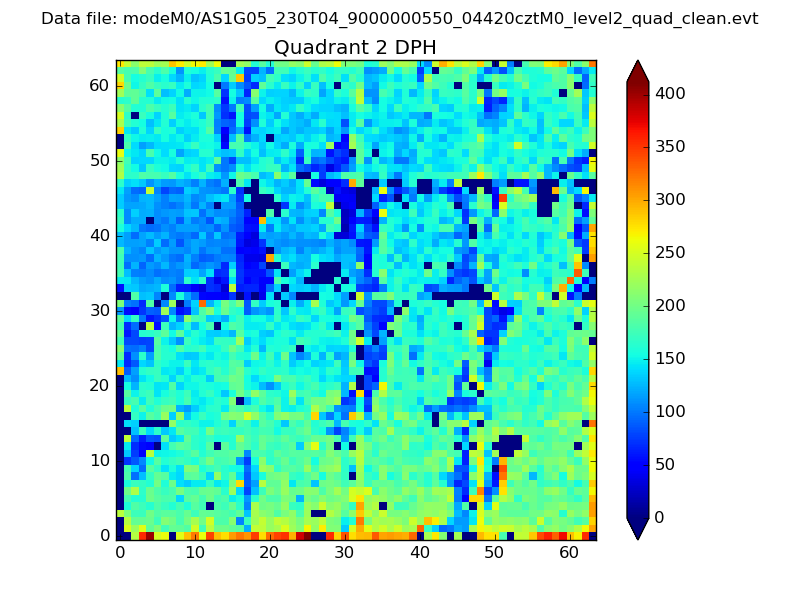 |
Quadrant C |
| Plot type | Count rate plots | Images |
|---|---|---|
| Comparison with Poisson distribution Blue bars denote a histogram of data divided into 1 sec bins. Red curve is a Poisson curve with rate = median count rate of data. |
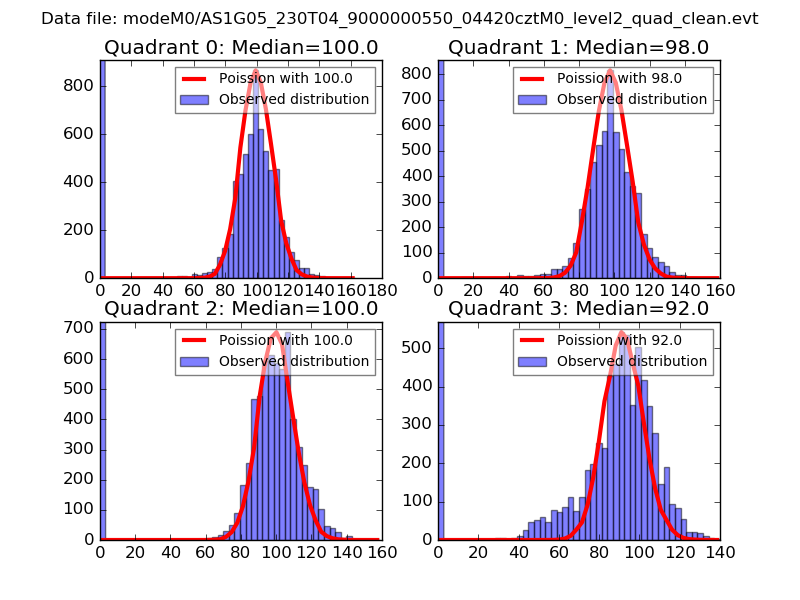 |
 |
| Quadrant-wise count rates Data is divided into 100 sec bins |
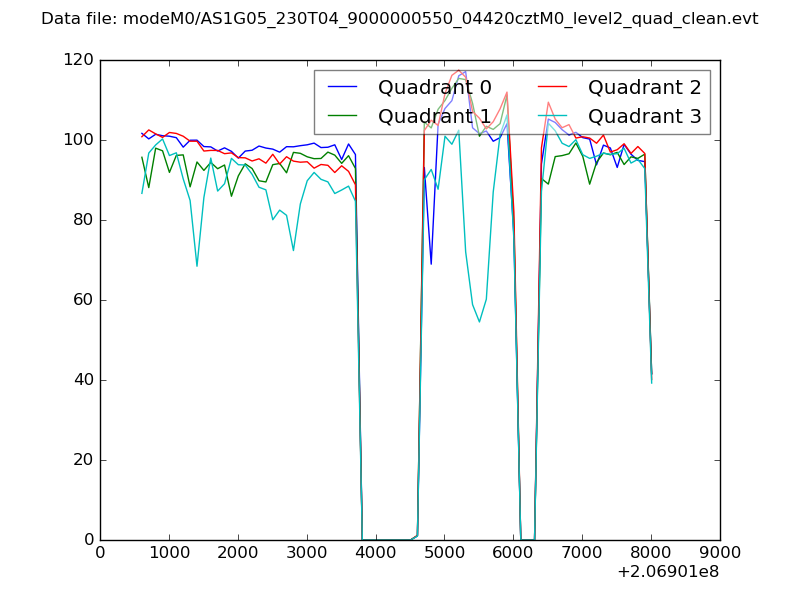 |
|
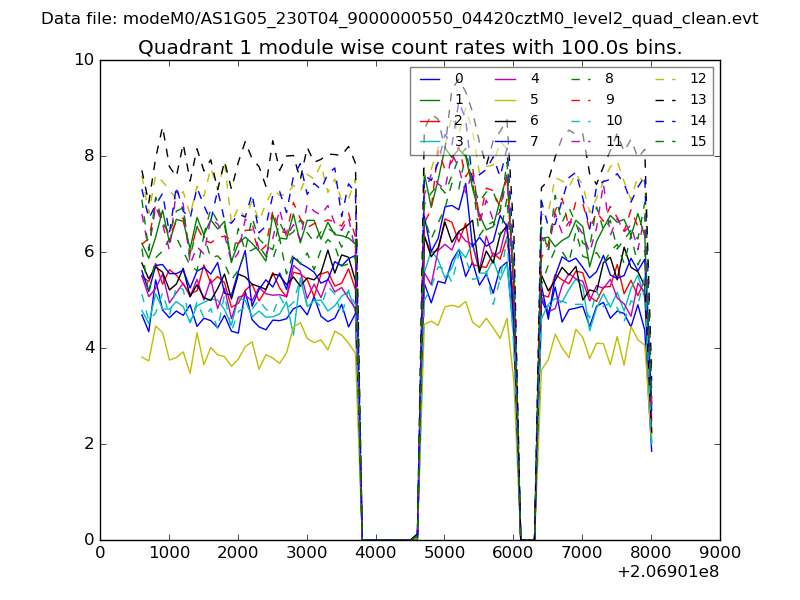
| Module-wise count rates for Quadrant A Data is divided into 100 sec bins |
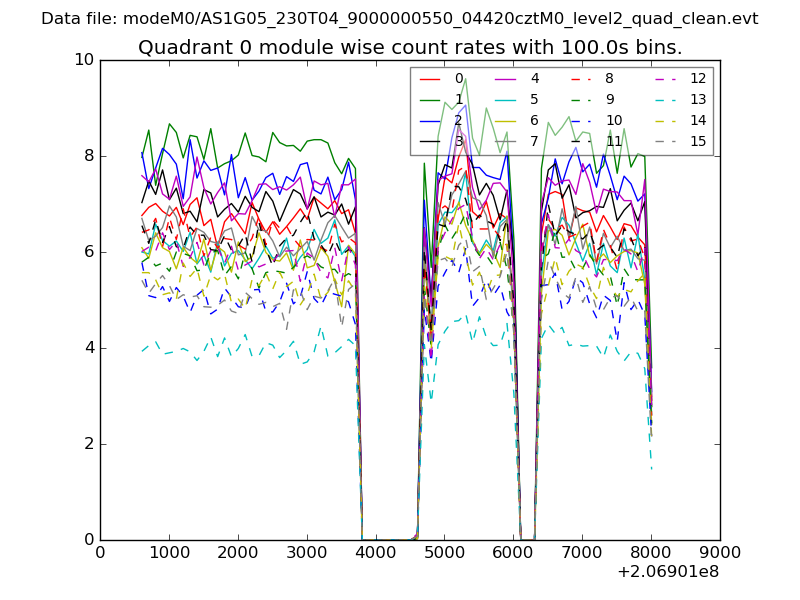 |
 |
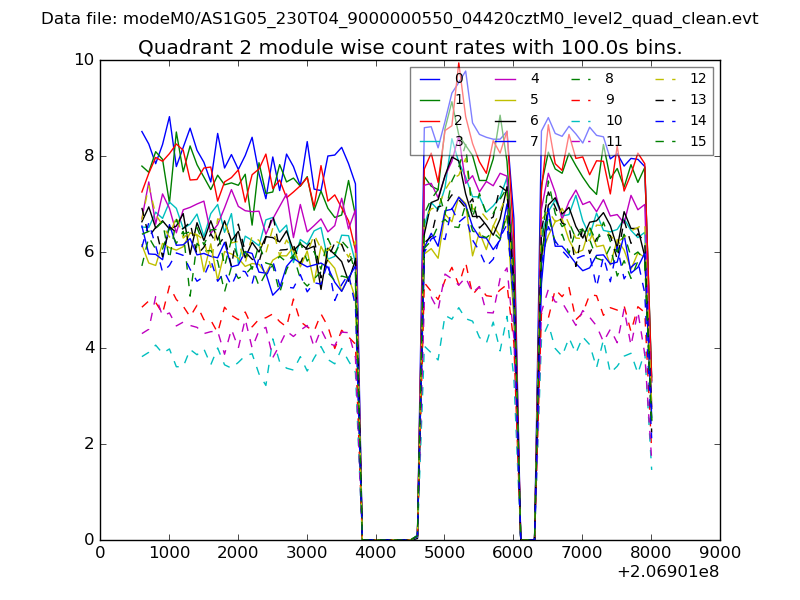
| Module-wise count rates for Quadrant B Data is divided into 100 sec bins |
 |
 |
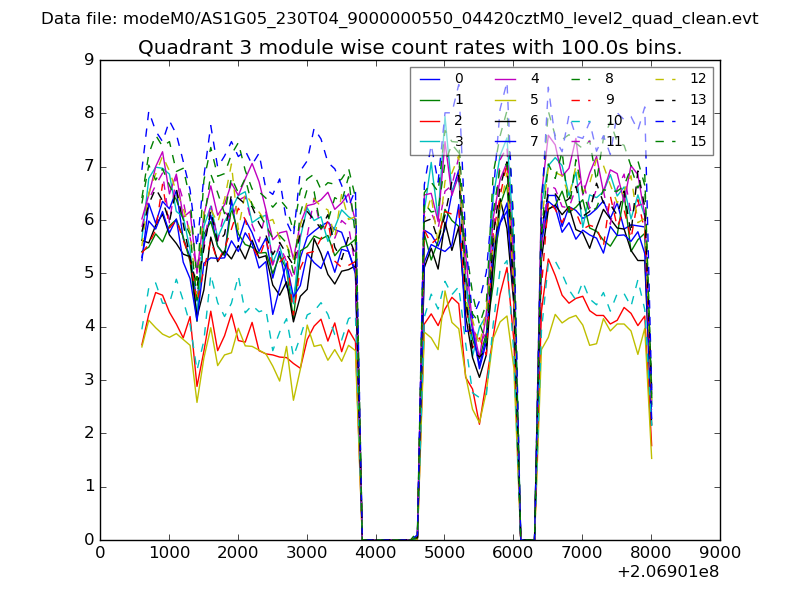
| Module-wise count rates for Quadrant C Data is divided into 100 sec bins |
 |
 |
| Module-wise count rates for Quadrant D Data is divided into 100 sec bins |
 |
 |
| Parameter | Plot |
|---|---|
| CZT HV Monitor | 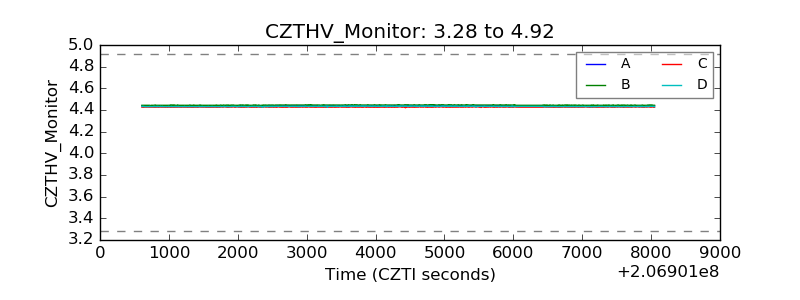 |
| D_VDD | 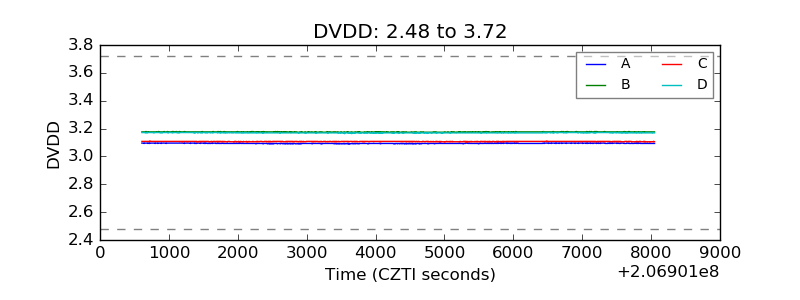 |
| Temperature 1 | 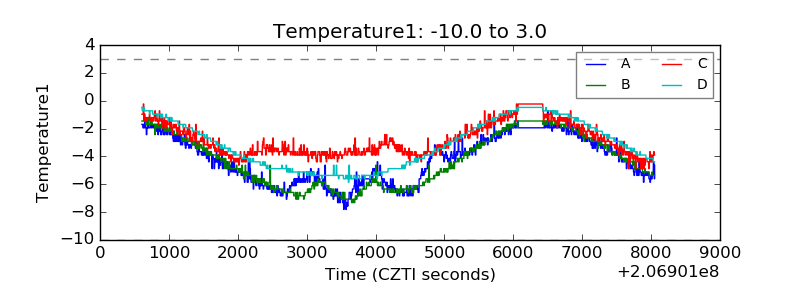 |
| Veto HV Monitor | 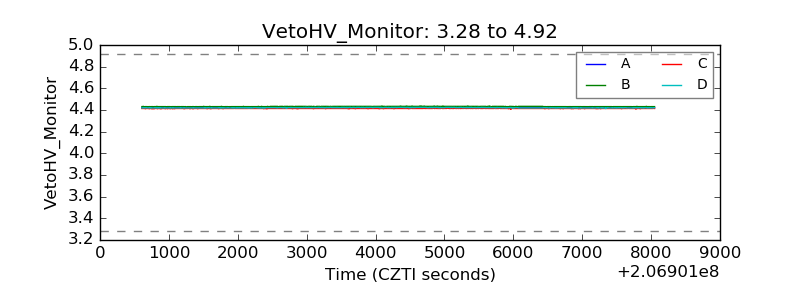 |
| Veto LLD | 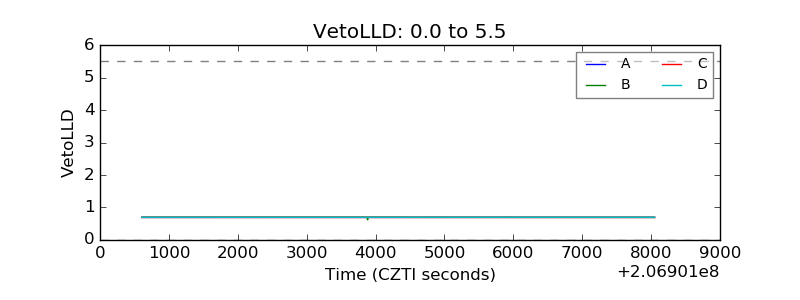 |
| Alpha Counter | 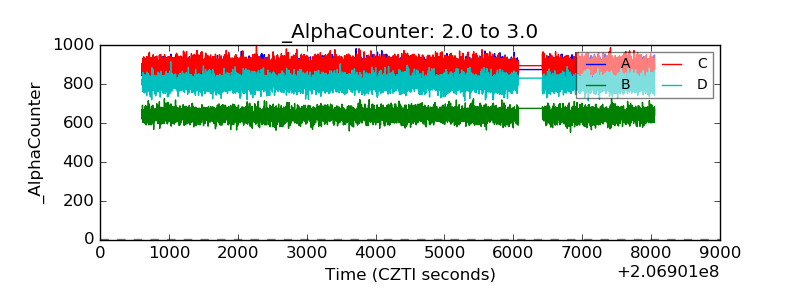 |
| _CPM_Rate | 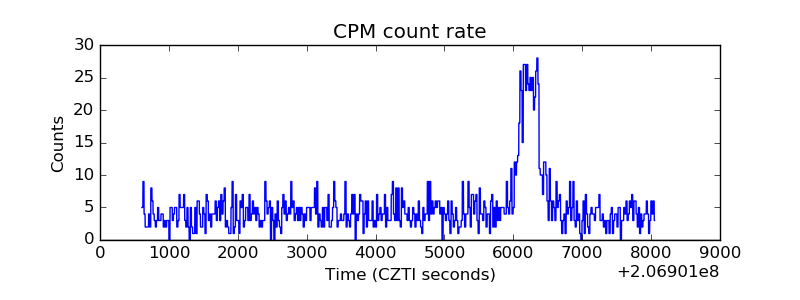 |
| CZT Counter | 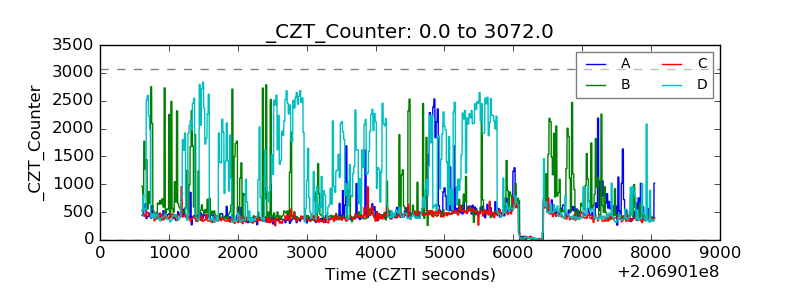 |
| +2.5 Volts monitor |  |
| +5 Volts monitor | 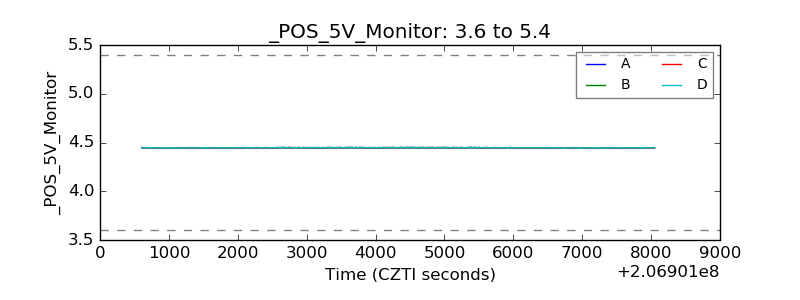 |
| _ROLL_ROT | 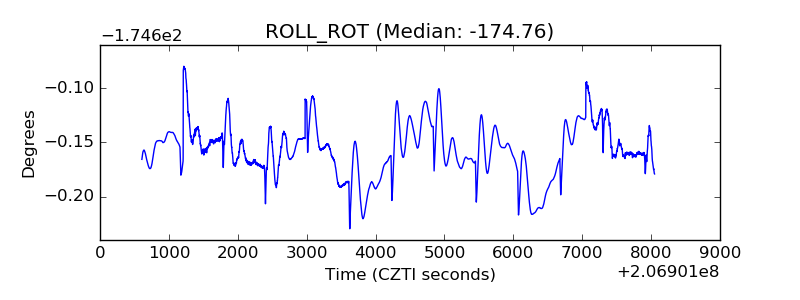 |
| _Roll_DEC | 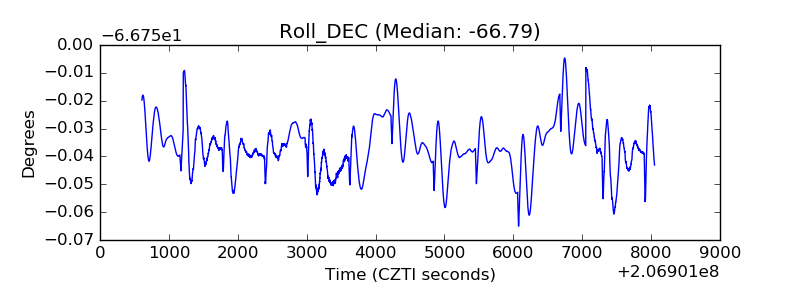 |
| _Roll_RA | 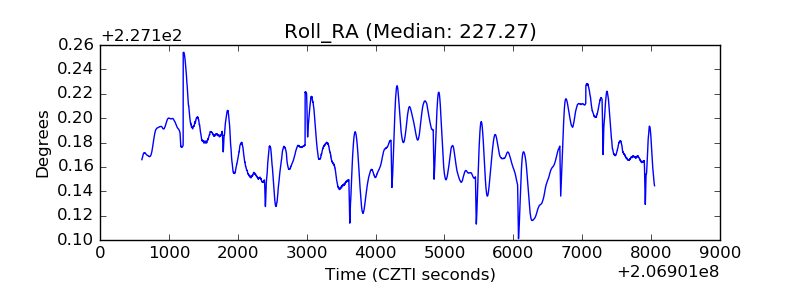 |
| Veto Counter | 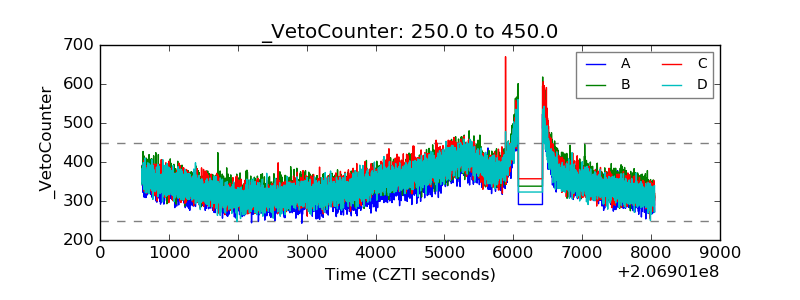 |