| Param | Original file | Final file |
|---|---|---|
| Filename | modeM0/AS1G05_230T04_9000000550_04423cztM0_level2.evt | modeM0/AS1G05_230T04_9000000550_04423cztM0_level2_quad_clean.evt |
| Size (bytes) | 1,516,527,360 | 212,829,120 |
| Size | 1.4 GB | 203.0 MB |
| Events in quadrant A | 8,126,162 | 1,366,665 |
| Events in quadrant B | 9,291,113 | 1,347,634 |
| Events in quadrant C | 7,722,242 | 1,364,636 |
| Events in quadrant D | 19,680,454 | 1,231,519 |
| Mode SS | |||
|---|---|---|---|
| Quadrant | BADHDUFLAG | Total packets | Discarded packets |
| A | 0 | 334 | 0 |
| B | 0 | 334 | 0 |
| C | 0 | 334 | 0 |
| D | 0 | 334 | 0 |
| Mode M9 | |||
|---|---|---|---|
| Quadrant | BADHDUFLAG | Total packets | Discarded packets |
| A | 0 | 12 | 0 |
| B | 0 | 12 | 0 |
| C | 0 | 12 | 0 |
| D | 0 | 12 | 0 |
| Mode M0 | |||
|---|---|---|---|
| Quadrant | BADHDUFLAG | Total packets | Discarded packets |
| A | 0 | 36017 | 4 |
| B | 0 | 39337 | 3 |
| C | 0 | 35390 | 3 |
| D | 0 | 70228 | 3 |
| Quadrant | Total seconds | Saturated seconds | Saturation percentage |
|---|---|---|---|
| A | 16443 | 238 | 1.447424% |
| B | 16443 | 401 | 2.438728% |
| C | 16443 | 97 | 0.589917% |
| D | 16443 | 2703 | 16.438606% |
Noise dominated data is calculated using 1-second bins in cleaned event files. If a bin has >2000 counts, and if more than 50% of those come from <1% of pixels, then it is considered to be noise-dominated and hence unusable.
| Quadrant | # 1 sec bins | Bins with >0 counts | Bins with >2000 counts | High rate bins dominated by noise | Noise dominated (total time) | Noise dominated (detector-on time) | Marked lightcurve |
|---|---|---|---|---|---|---|---|
| A | 17653 | 16445 | 124 | 124 | 0.70% | 0.75% | 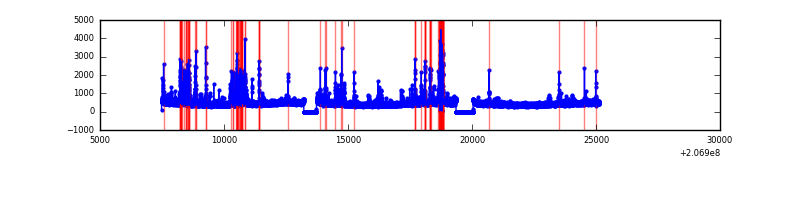 |
| B | 17653 | 16445 | 275 | 275 | 1.56% | 1.67% | 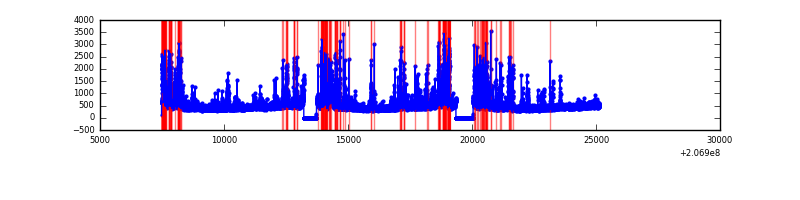 |
| C | 17653 | 16445 | 57 | 57 | 0.32% | 0.35% | 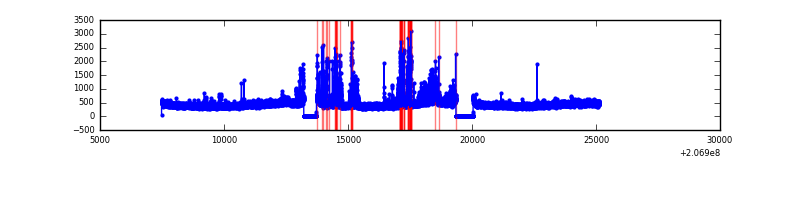 |
| D | 17653 | 16445 | 2921 | 2921 | 16.55% | 17.76% | 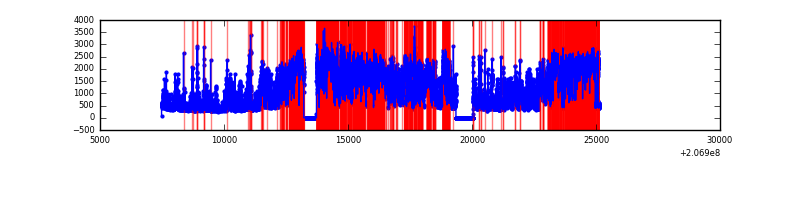 |
Top three noisy pixels from each quadrant. If the there are fewer than three noisy pixels in the level2.evt file, extra rows are filled as -1
| Pixel properties | Quadrant properties | ||||||
|---|---|---|---|---|---|---|---|
| Quadrant | DetID | PixID | Counts | Sigma | Mean | Median | Sigma |
| A | 0 | 13 | 908811 | 2495.02 | 1797 | 1757 | 363.5 |
| A | 13 | 251 | 157810 | 429.25 | 1797 | 1757 | 363.5 |
| A | 0 | 50 | 68235 | 182.86 | 1797 | 1757 | 363.5 |
| B | 14 | 167 | 1396011 | 4056.4 | 1812 | 1767 | 343.7 |
| B | 10 | 16 | 730902 | 2121.34 | 1812 | 1767 | 343.7 |
| B | 15 | 204 | 52733 | 148.28 | 1812 | 1767 | 343.7 |
| C | 14 | 48 | 818881 | 2015.01 | 1752 | 1759 | 405.5 |
| C | 12 | 4 | 39522 | 93.12 | 1752 | 1759 | 405.5 |
| C | 9 | 16 | 15532 | 33.96 | 1752 | 1759 | 405.5 |
| D | 13 | 114 | 11412335 | 28209.86 | 1677 | 1631 | 404.5 |
| D | 13 | 53 | 865612 | 2135.96 | 1677 | 1631 | 404.5 |
| D | 12 | 233 | 182773 | 447.82 | 1677 | 1631 | 404.5 |
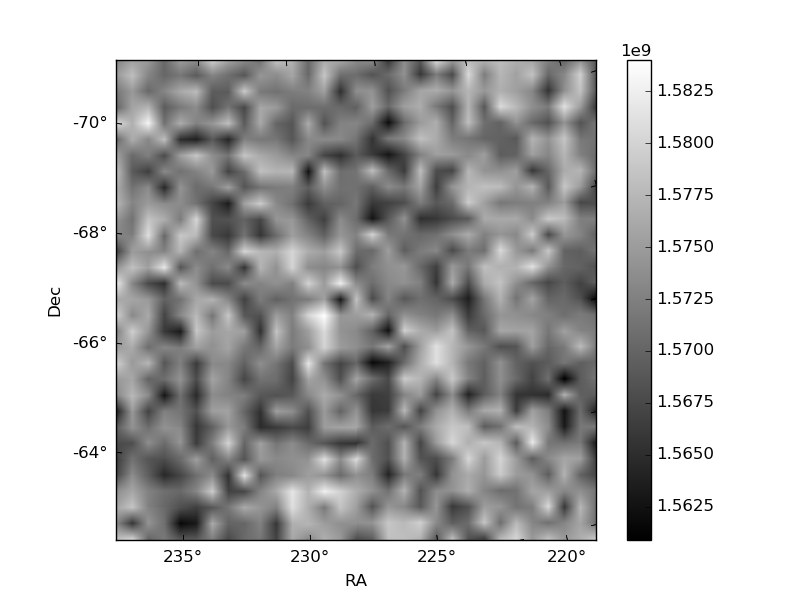
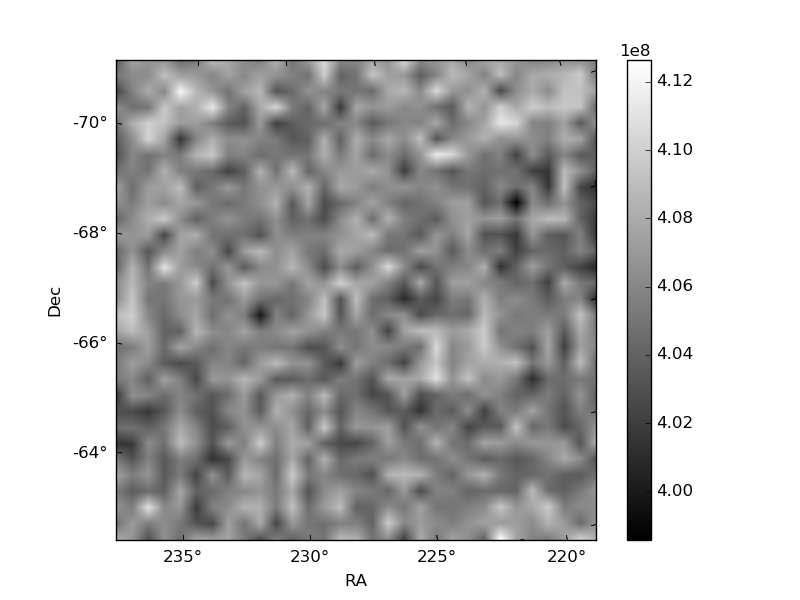
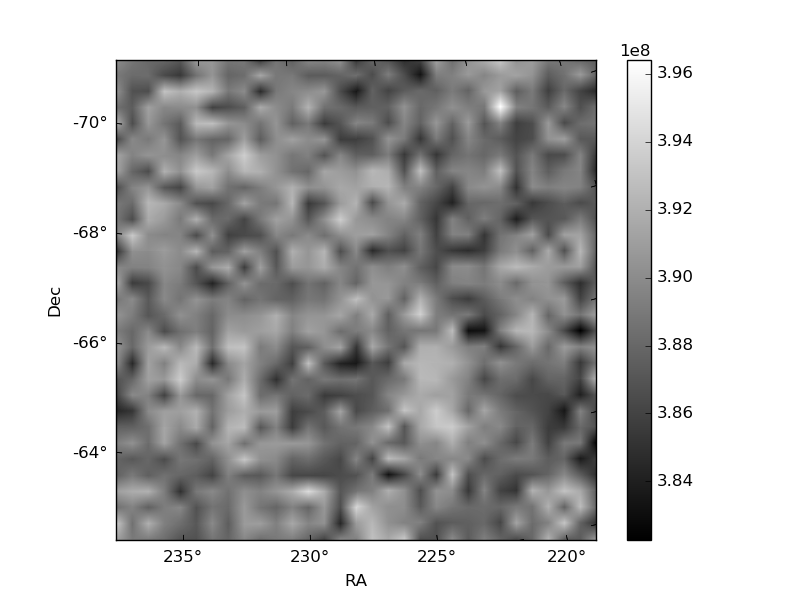
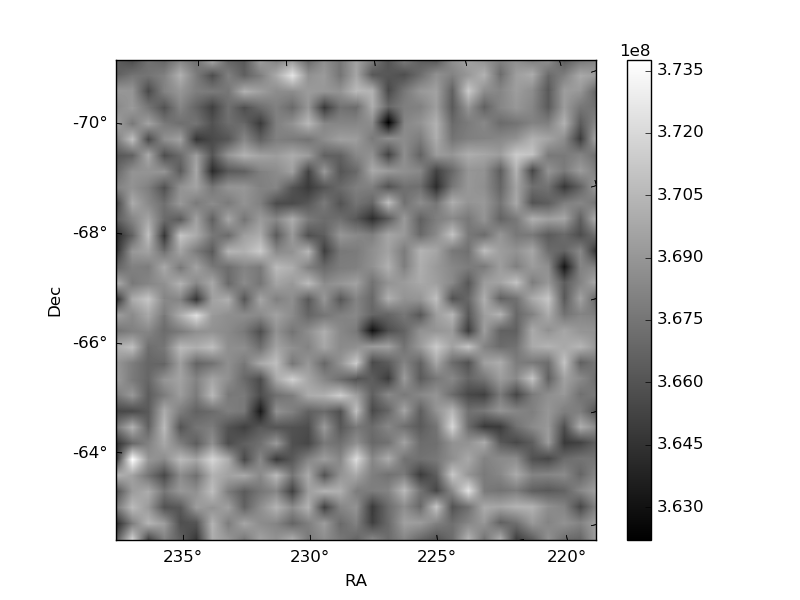
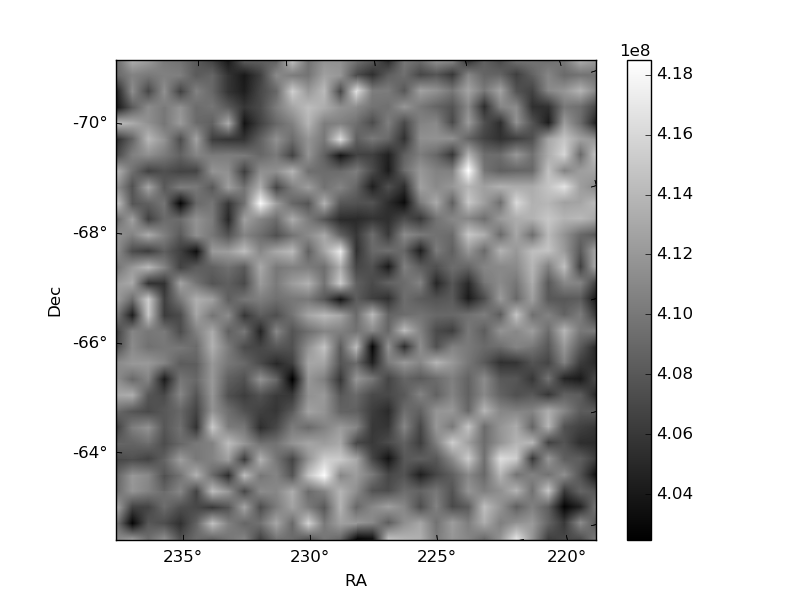
Histogram calculated using DETX and DETY for each event in the final _common_clean file
| Quadrant A | 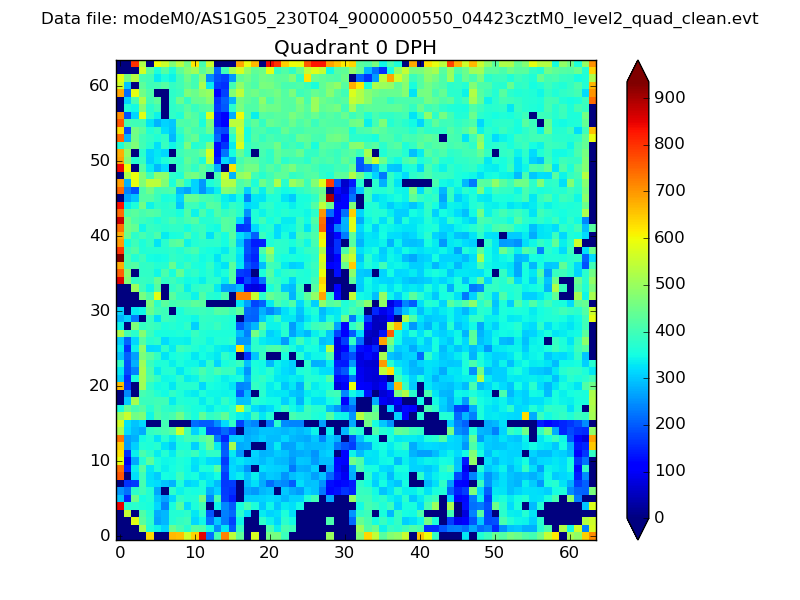 |
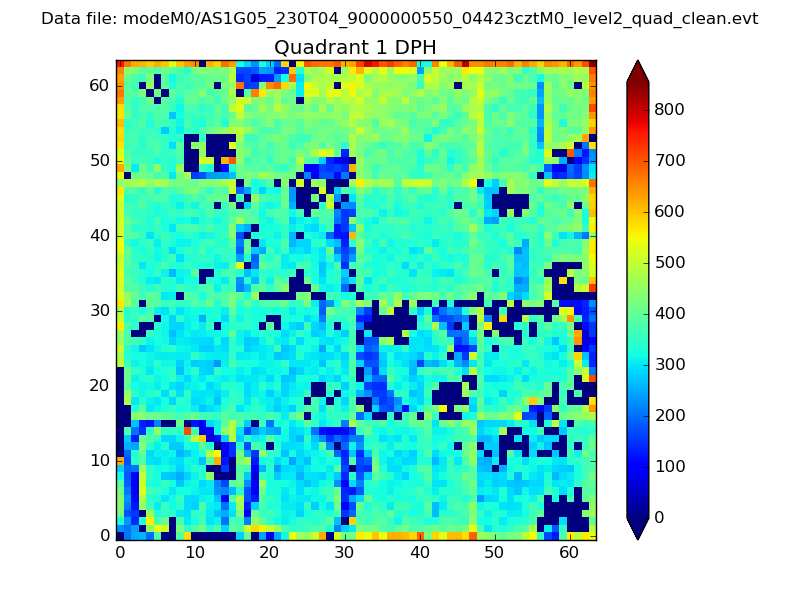 |
Quadrant B |
|---|---|---|---|
| Quadrant D | 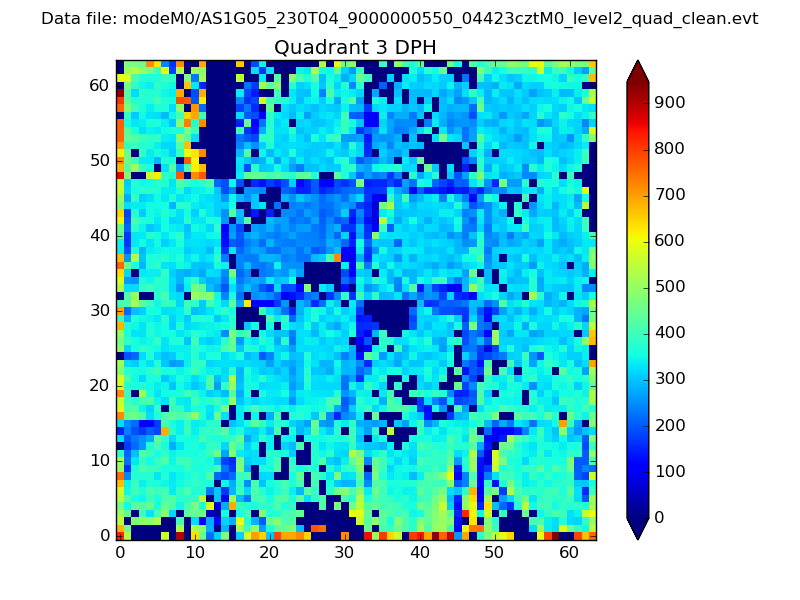 |
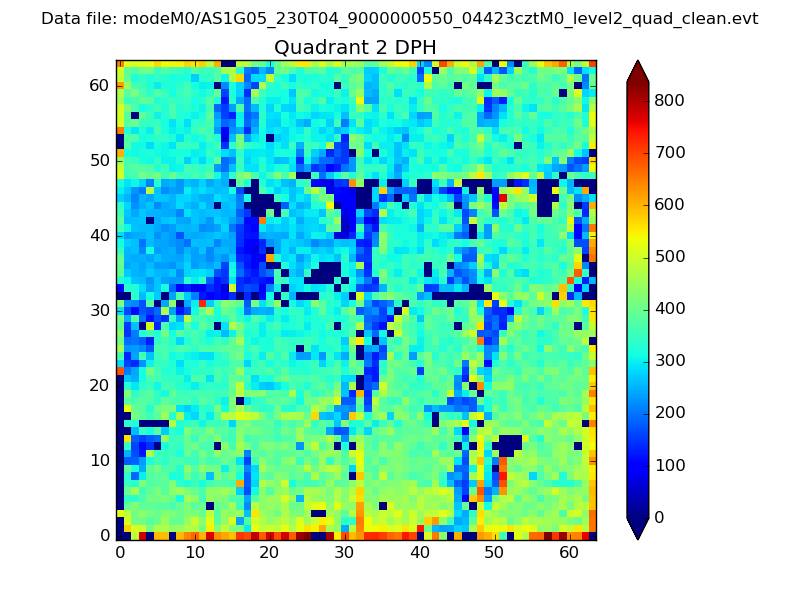 |
Quadrant C |
| Plot type | Count rate plots | Images |
|---|---|---|
| Comparison with Poisson distribution Blue bars denote a histogram of data divided into 1 sec bins. Red curve is a Poisson curve with rate = median count rate of data. |
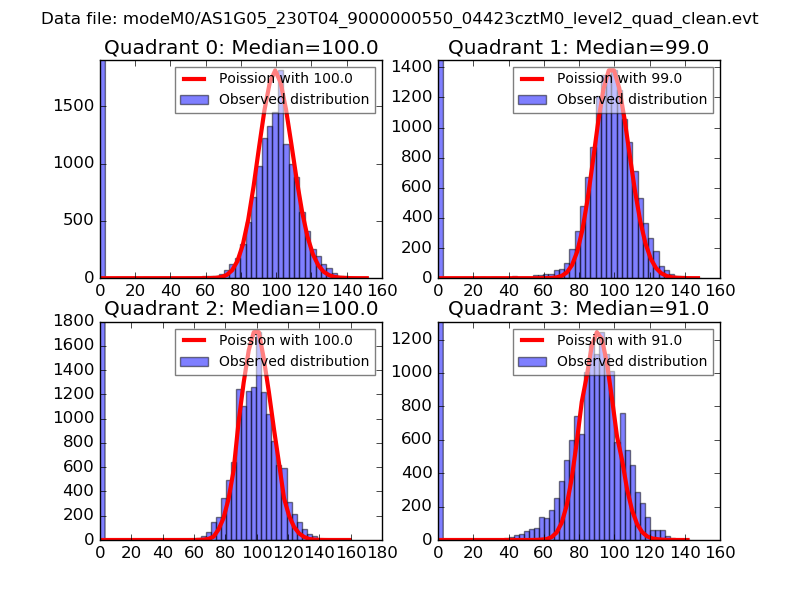 |
 |
| Quadrant-wise count rates Data is divided into 100 sec bins |
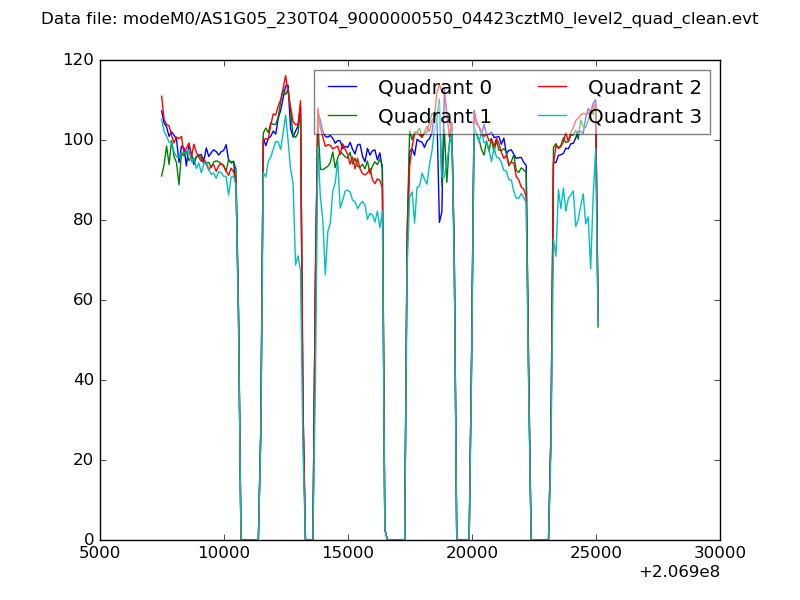 |
|
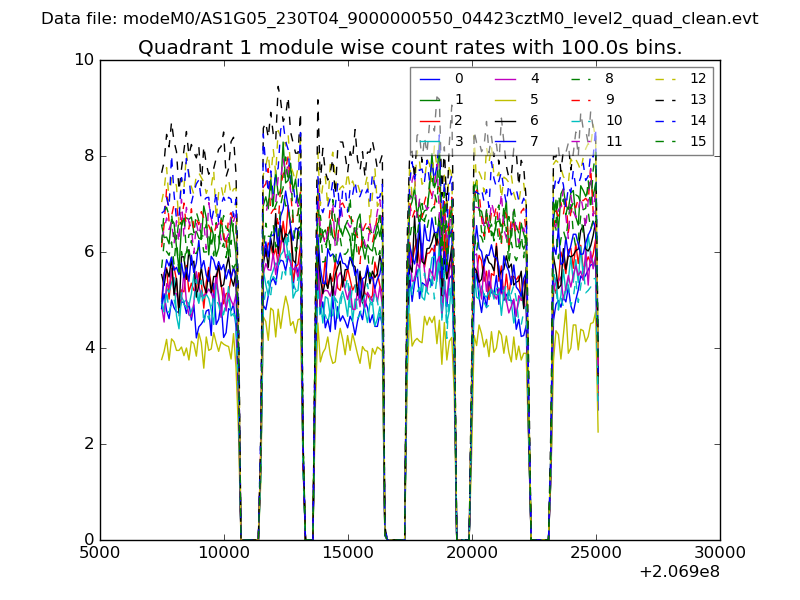
| Module-wise count rates for Quadrant A Data is divided into 100 sec bins |
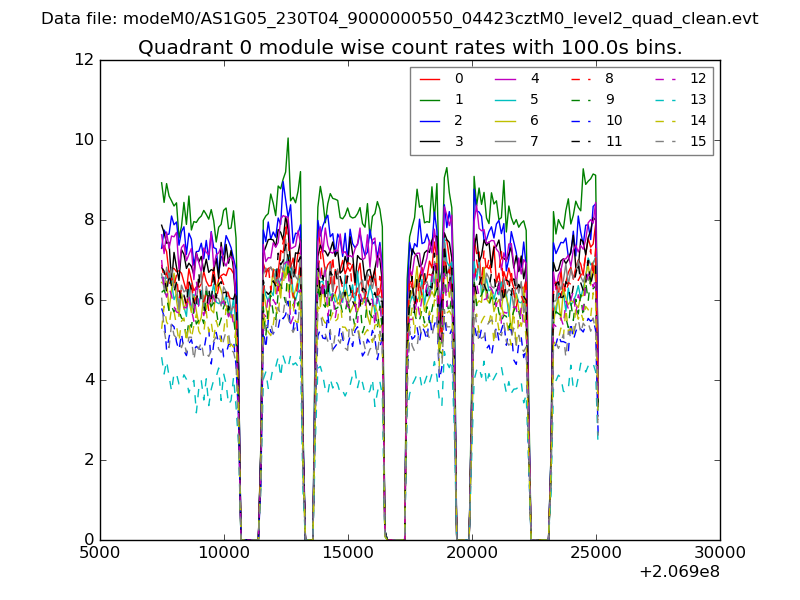 |
 |
| Module-wise count rates for Quadrant B Data is divided into 100 sec bins |
 |
 |
| Module-wise count rates for Quadrant C Data is divided into 100 sec bins |
 |
 |
| Module-wise count rates for Quadrant D Data is divided into 100 sec bins |
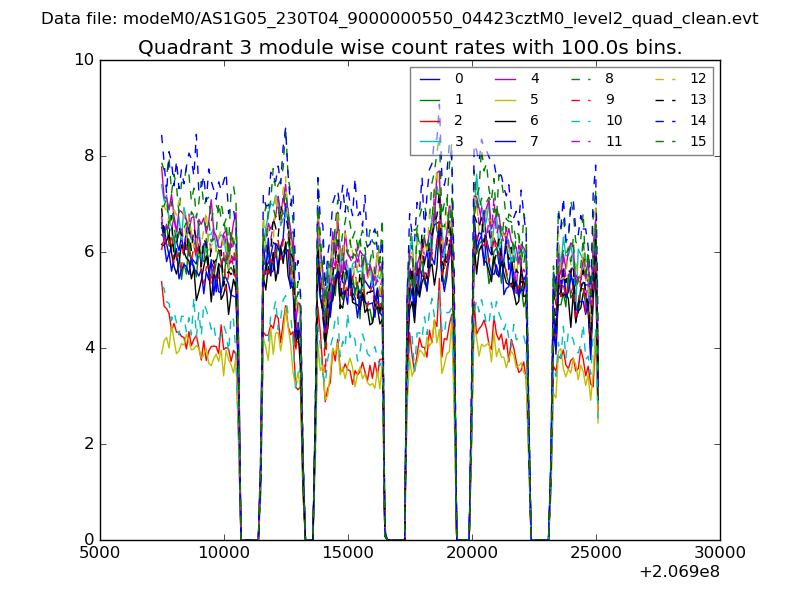 |
 |
| Parameter | Plot |
|---|---|
| CZT HV Monitor | 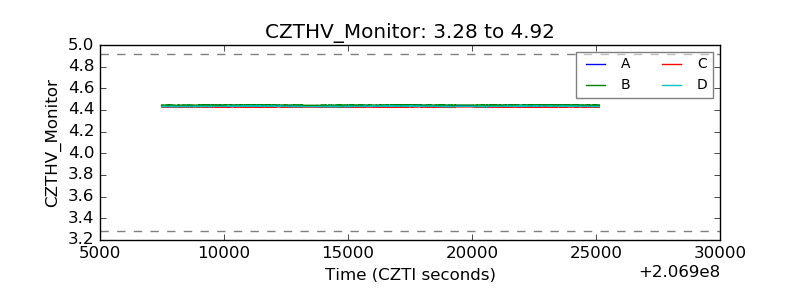 |
| D_VDD | 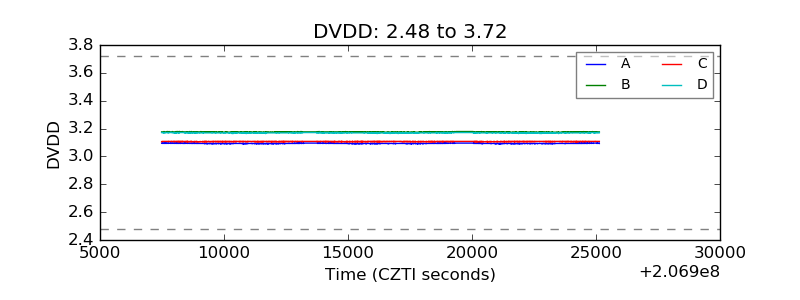 |
| Temperature 1 | 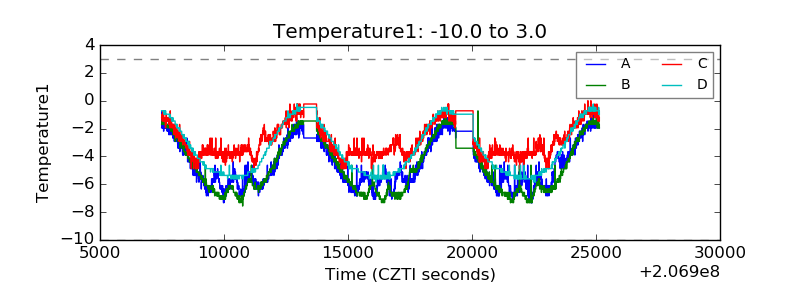 |
| Veto HV Monitor | 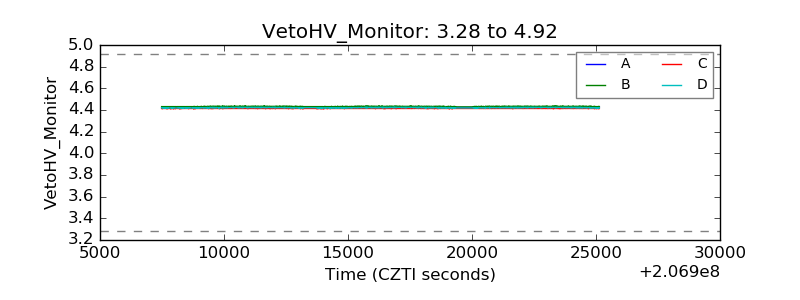 |
| Veto LLD | 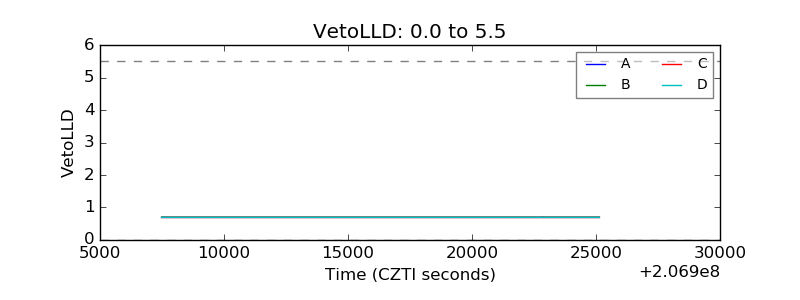 |
| Alpha Counter | 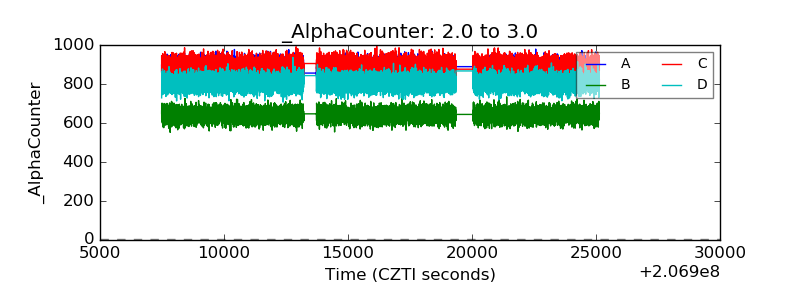 |
| _CPM_Rate | 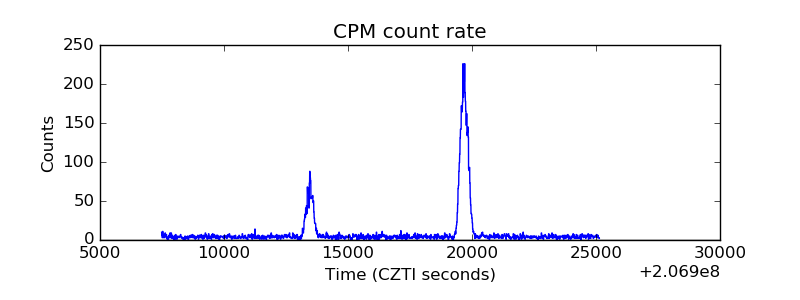 |
| CZT Counter | 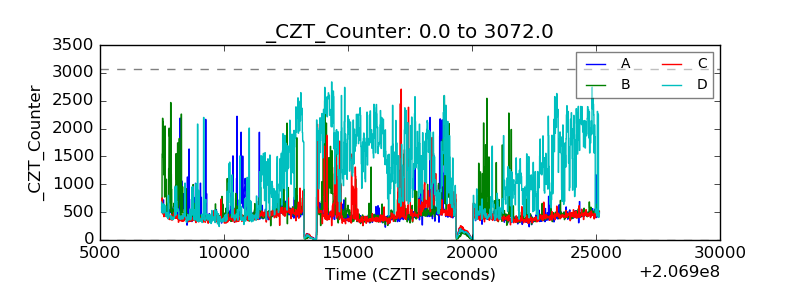 |
| +2.5 Volts monitor | 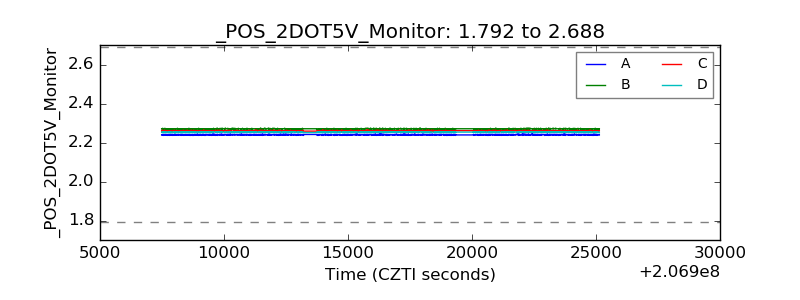 |
| +5 Volts monitor | 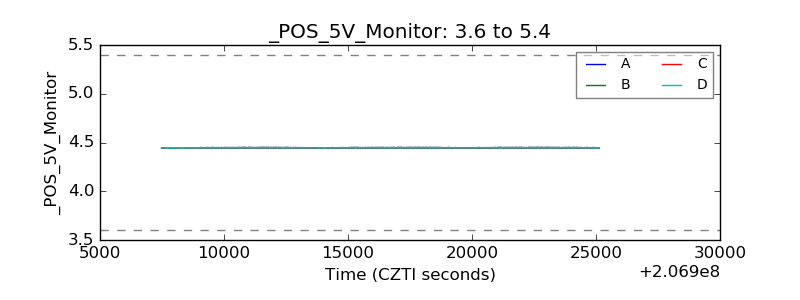 |
| _ROLL_ROT | 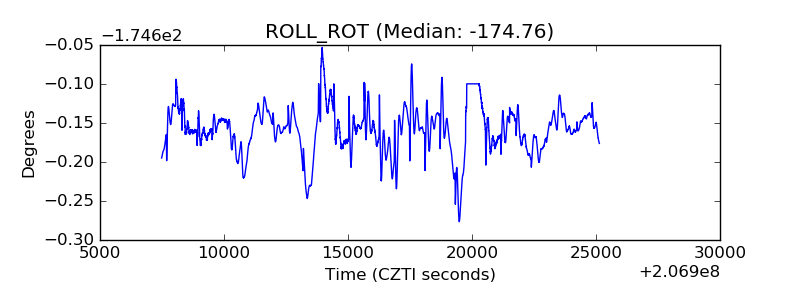 |
| _Roll_DEC | 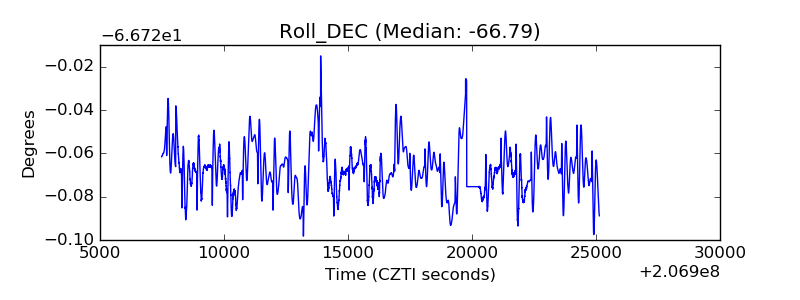 |
| _Roll_RA | 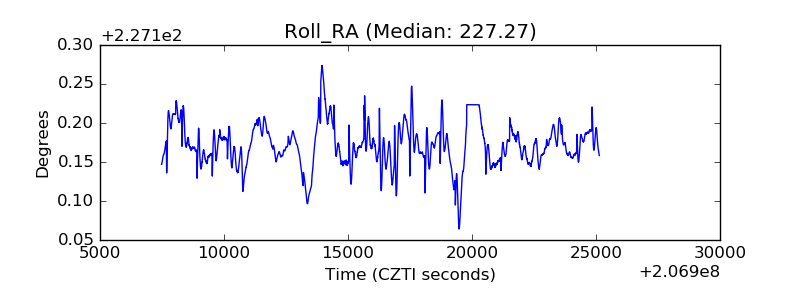 |
| Veto Counter | 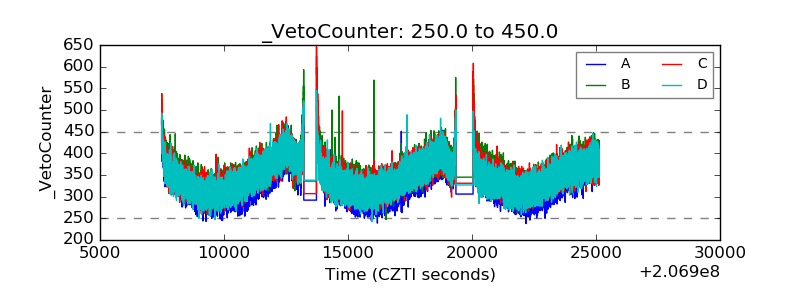 |