| Param | Original file | Final file |
|---|---|---|
| Filename | modeM0/AS1G05_230T04_9000000550_04424cztM0_level2.evt | modeM0/AS1G05_230T04_9000000550_04424cztM0_level2_quad_clean.evt |
| Size (bytes) | 626,400,000 | 98,654,400 |
| Size | 597.4 MB | 94.1 MB |
| Events in quadrant A | 3,778,084 | 638,288 |
| Events in quadrant B | 3,473,522 | 635,800 |
| Events in quadrant C | 3,140,515 | 638,685 |
| Events in quadrant D | 8,092,455 | 574,525 |
| Mode SS | |||
|---|---|---|---|
| Quadrant | BADHDUFLAG | Total packets | Discarded packets |
| A | 0 | 146 | 0 |
| B | 0 | 146 | 0 |
| C | 0 | 146 | 0 |
| D | 0 | 146 | 0 |
| Mode M9 | |||
|---|---|---|---|
| Quadrant | BADHDUFLAG | Total packets | Discarded packets |
| A | 0 | 19 | 0 |
| B | 0 | 19 | 0 |
| C | 0 | 19 | 0 |
| D | 0 | 19 | 0 |
| Mode M0 | |||
|---|---|---|---|
| Quadrant | BADHDUFLAG | Total packets | Discarded packets |
| A | 0 | 16273 | 3 |
| B | 0 | 15356 | 2 |
| C | 0 | 14559 | 2 |
| D | 0 | 29080 | 2 |
| Quadrant | Total seconds | Saturated seconds | Saturation percentage |
|---|---|---|---|
| A | 7185 | 149 | 2.073765% |
| B | 7185 | 85 | 1.183020% |
| C | 7185 | 25 | 0.347947% |
| D | 7185 | 884 | 12.303410% |
Noise dominated data is calculated using 1-second bins in cleaned event files. If a bin has >2000 counts, and if more than 50% of those come from <1% of pixels, then it is considered to be noise-dominated and hence unusable.
| Quadrant | # 1 sec bins | Bins with >0 counts | Bins with >2000 counts | High rate bins dominated by noise | Noise dominated (total time) | Noise dominated (detector-on time) | Marked lightcurve |
|---|---|---|---|---|---|---|---|
| A | 9035 | 7187 | 62 | 62 | 0.69% | 0.86% | 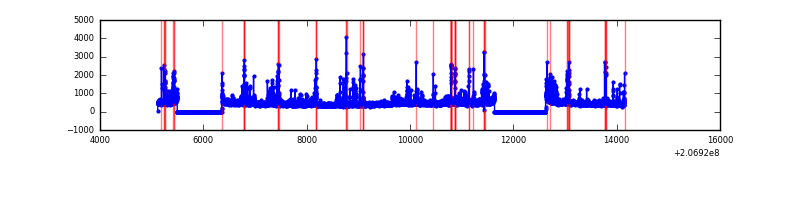 |
| B | 9035 | 7187 | 32 | 32 | 0.35% | 0.45% | 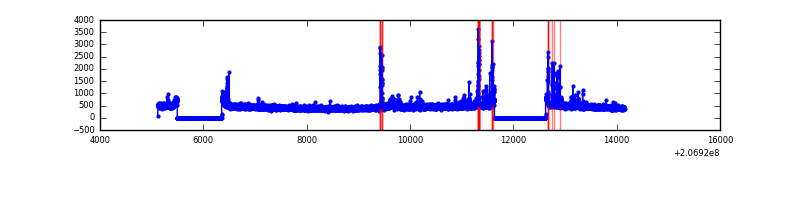 |
| C | 9035 | 7187 | 1 | 1 | 0.01% | 0.01% | 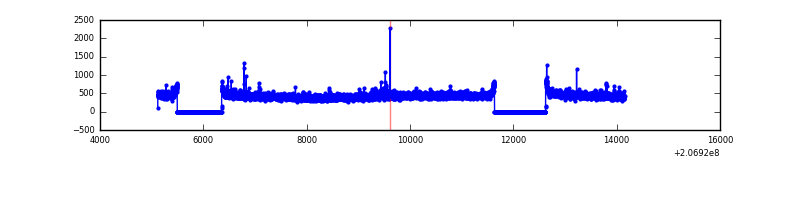 |
| D | 9035 | 7187 | 855 | 855 | 9.46% | 11.90% | 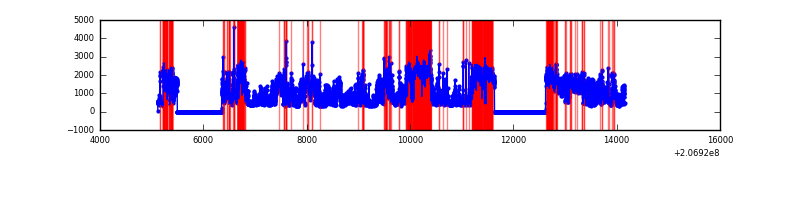 |
Top three noisy pixels from each quadrant. If the there are fewer than three noisy pixels in the level2.evt file, extra rows are filled as -1
| Pixel properties | Quadrant properties | ||||||
|---|---|---|---|---|---|---|---|
| Quadrant | DetID | PixID | Counts | Sigma | Mean | Median | Sigma |
| A | 0 | 13 | 553166 | 3367.67 | 801 | 781 | 164.0 |
| A | 8 | 15 | 64128 | 386.2 | 801 | 781 | 164.0 |
| A | 0 | 118 | 59082 | 355.44 | 801 | 781 | 164.0 |
| B | 14 | 167 | 259591 | 1666.49 | 815 | 796 | 155.3 |
| B | 15 | 204 | 31006 | 194.54 | 815 | 796 | 155.3 |
| B | 7 | 252 | 13427 | 81.34 | 815 | 796 | 155.3 |
| C | 14 | 48 | 42591 | 228.51 | 789 | 791 | 182.9 |
| C | 9 | 247 | 9278 | 46.39 | 789 | 791 | 182.9 |
| C | 13 | 61 | 6580 | 31.64 | 789 | 791 | 182.9 |
| D | 13 | 114 | 4463817 | 24561.6 | 753 | 728 | 181.7 |
| D | 2 | 136 | 394390 | 2166.43 | 753 | 728 | 181.7 |
| D | 13 | 53 | 93899 | 512.75 | 753 | 728 | 181.7 |
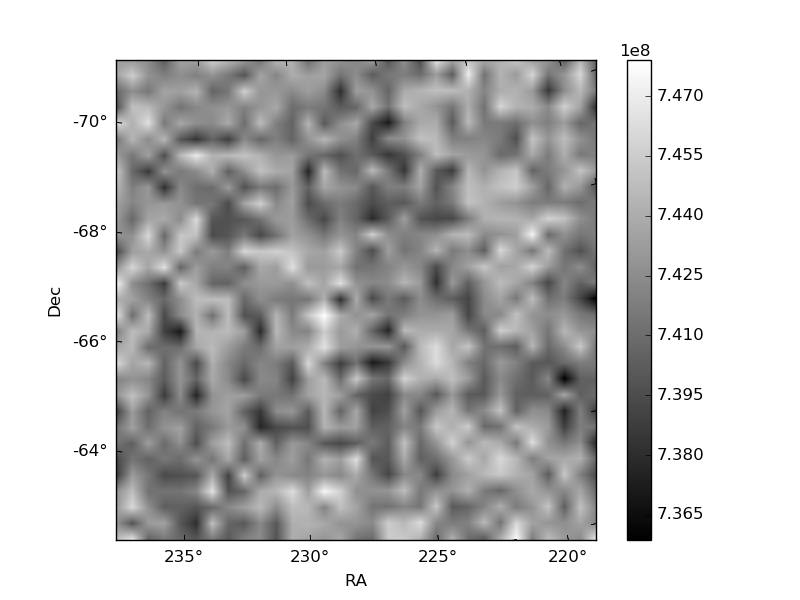
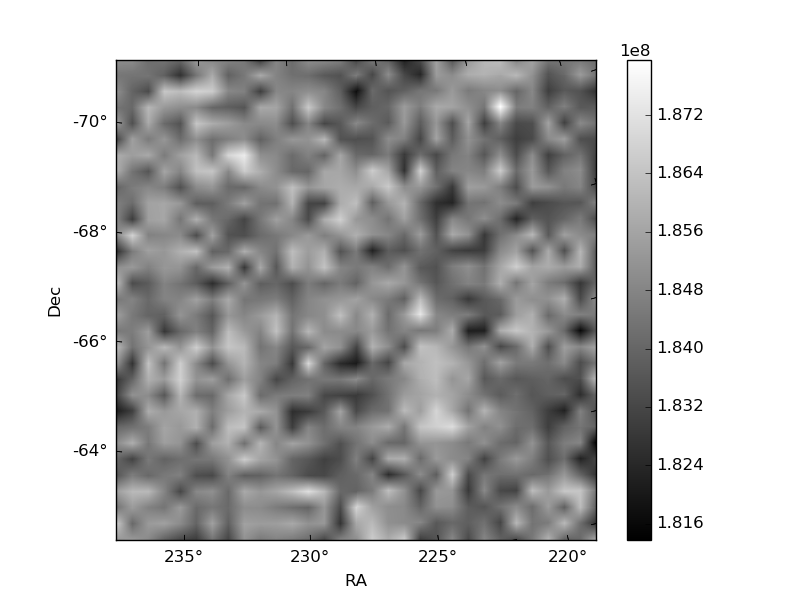
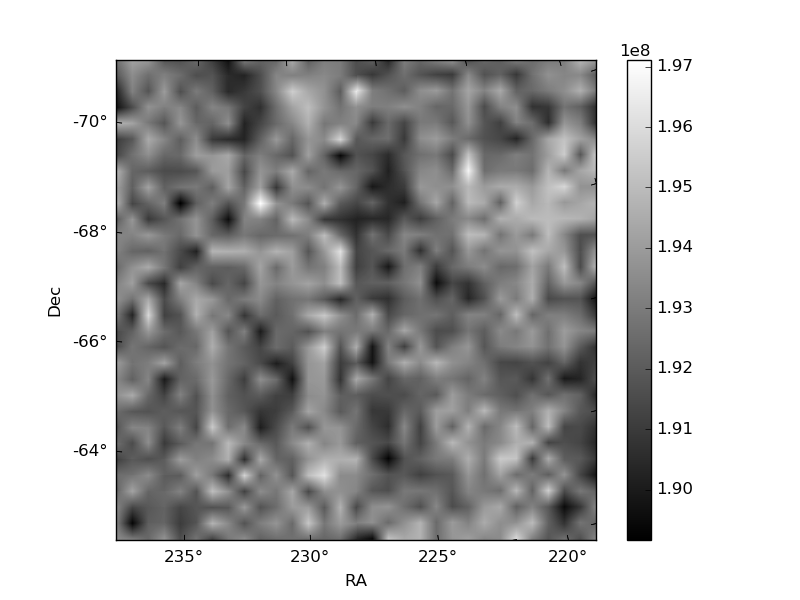
Histogram calculated using DETX and DETY for each event in the final _common_clean file
| Quadrant A | 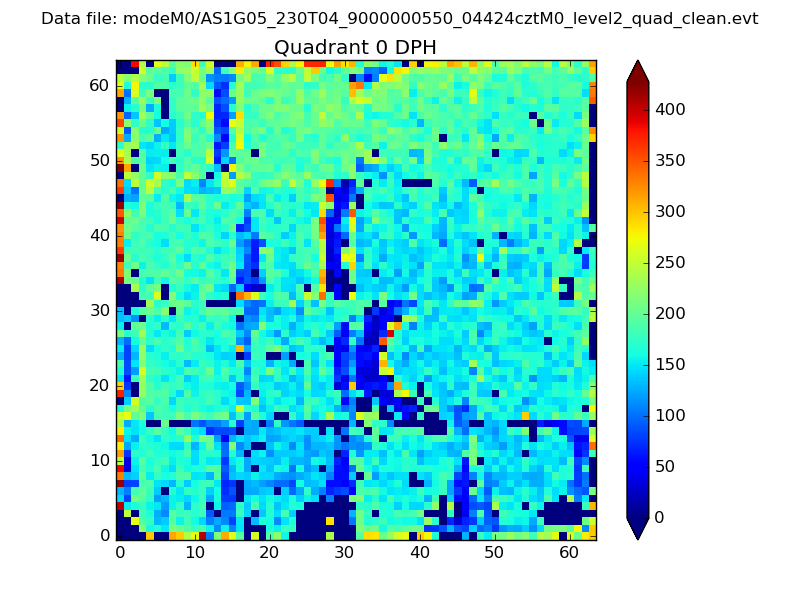 |
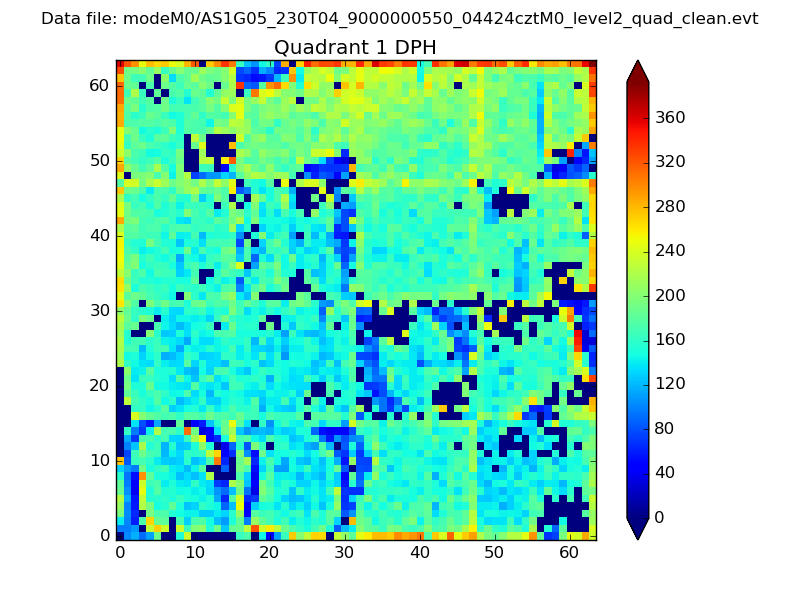 |
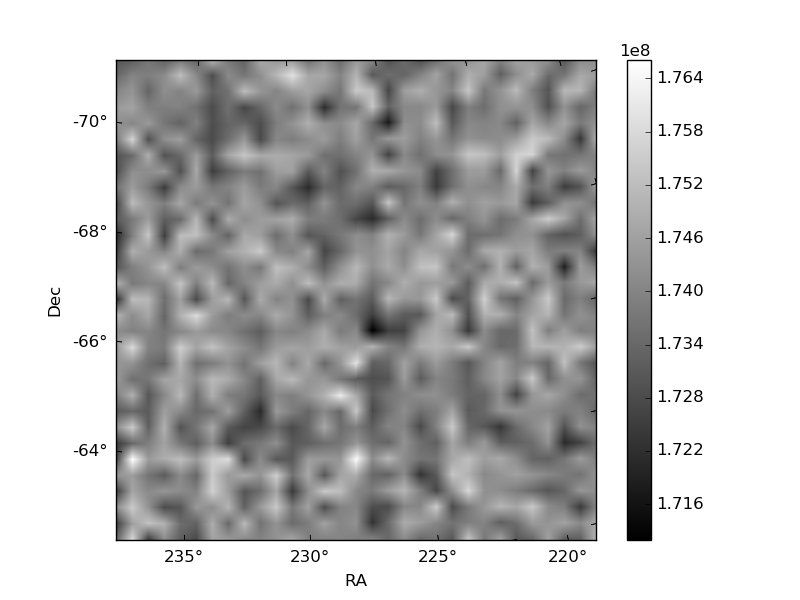
Quadrant B |
|---|---|---|---|
| Quadrant D | 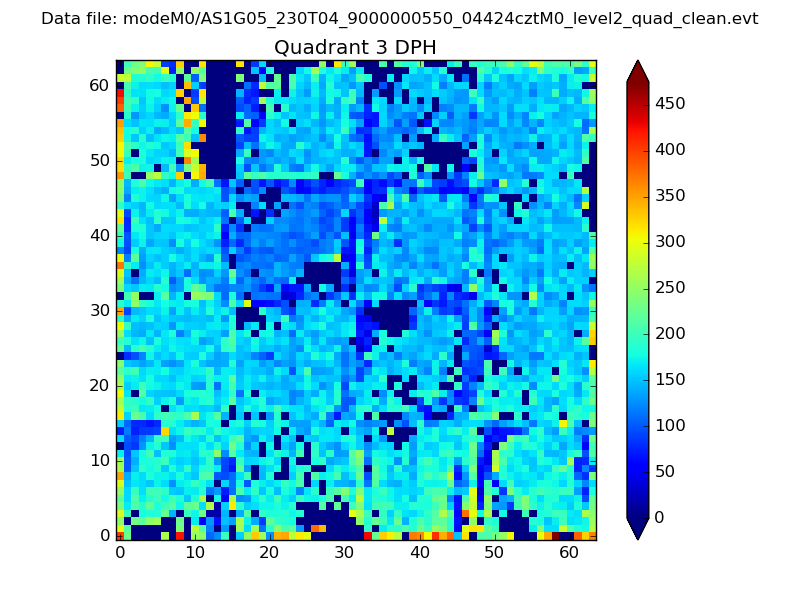 |
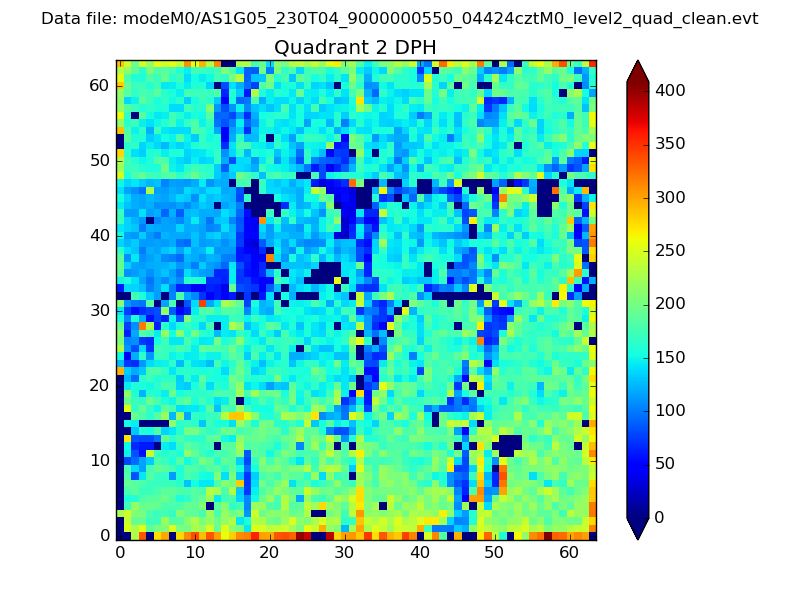 |
Quadrant C |
| Plot type | Count rate plots | Images |
|---|---|---|
| Comparison with Poisson distribution Blue bars denote a histogram of data divided into 1 sec bins. Red curve is a Poisson curve with rate = median count rate of data. |
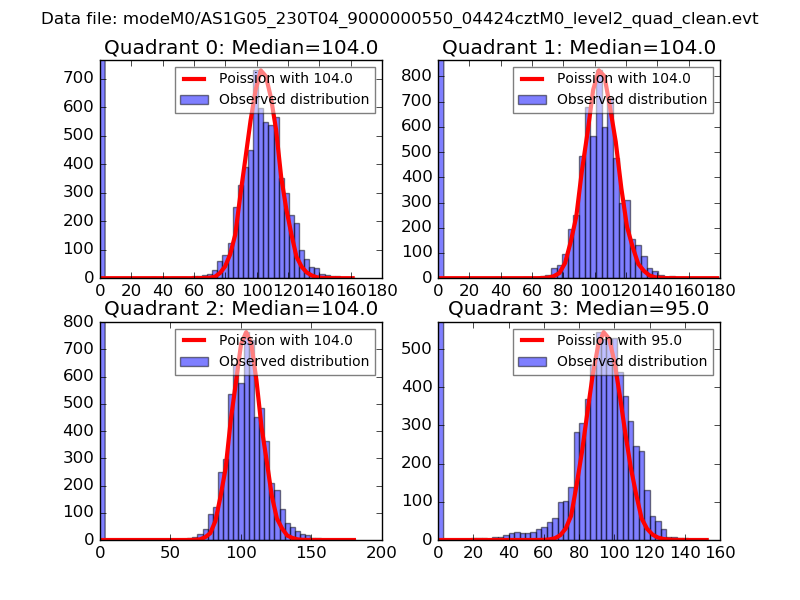 |
 |
| Quadrant-wise count rates Data is divided into 100 sec bins |
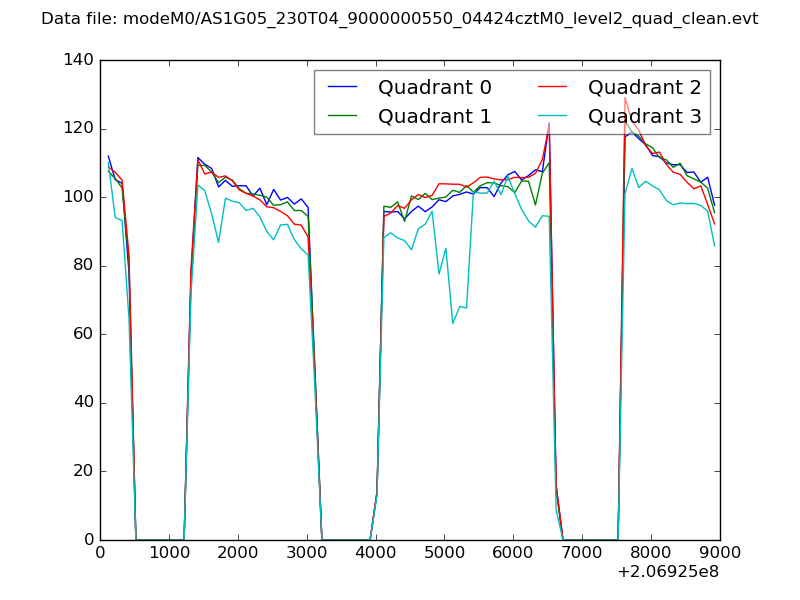 |
|
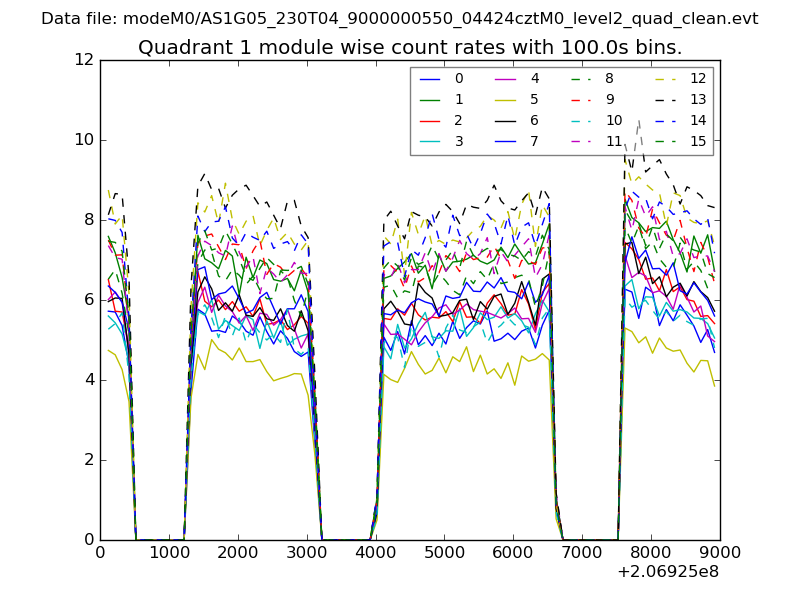
| Module-wise count rates for Quadrant A Data is divided into 100 sec bins |
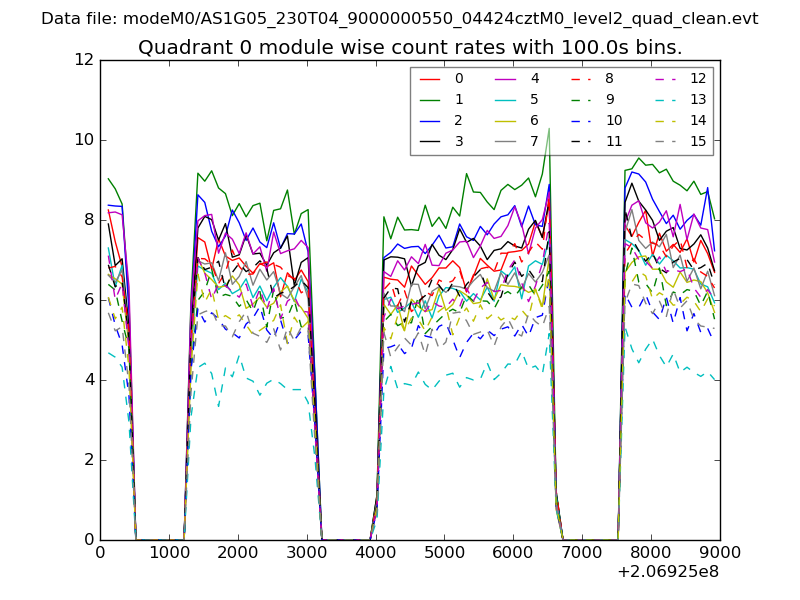 |
 |
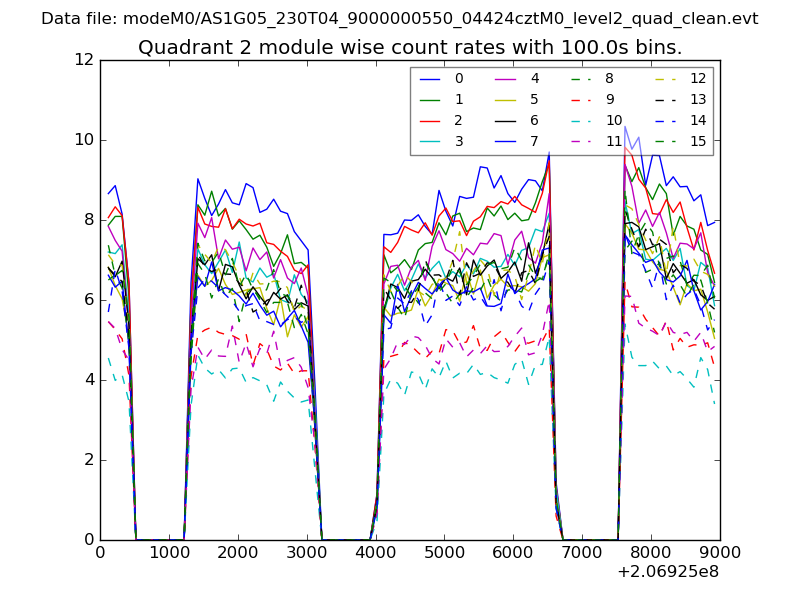
| Module-wise count rates for Quadrant B Data is divided into 100 sec bins |
 |
 |
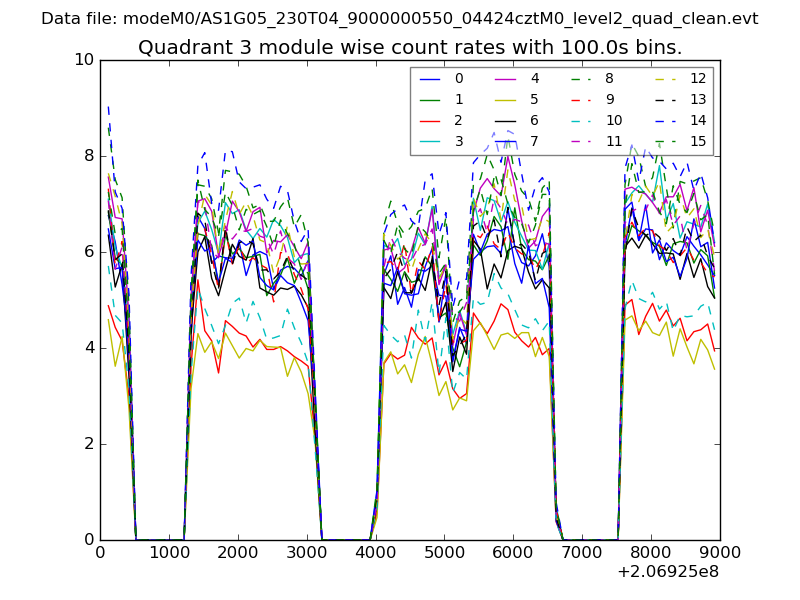
| Module-wise count rates for Quadrant C Data is divided into 100 sec bins |
 |
 |
| Module-wise count rates for Quadrant D Data is divided into 100 sec bins |
 |
 |
| Parameter | Plot |
|---|---|
| CZT HV Monitor | 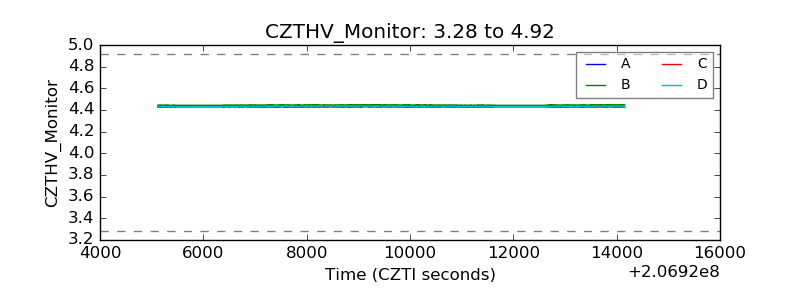 |
| D_VDD | 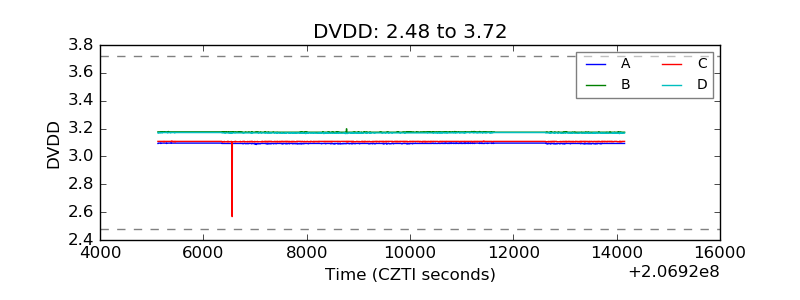 |
| Temperature 1 | 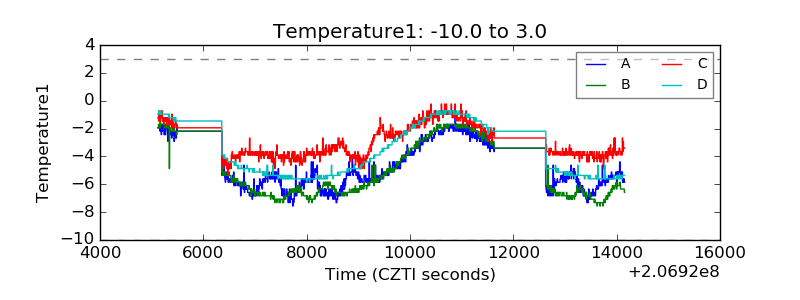 |
| Veto HV Monitor | 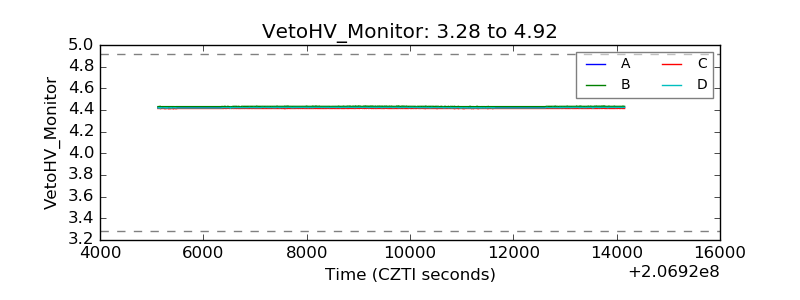 |
| Veto LLD | 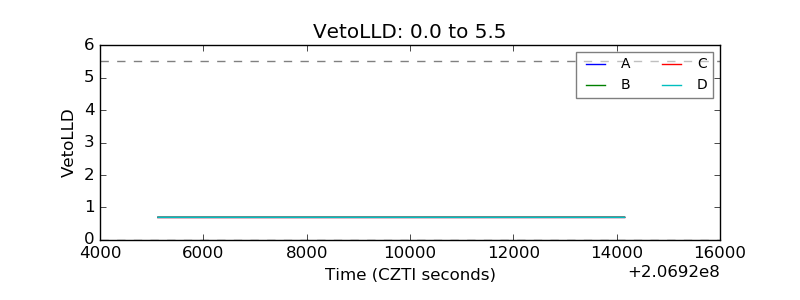 |
| Alpha Counter | 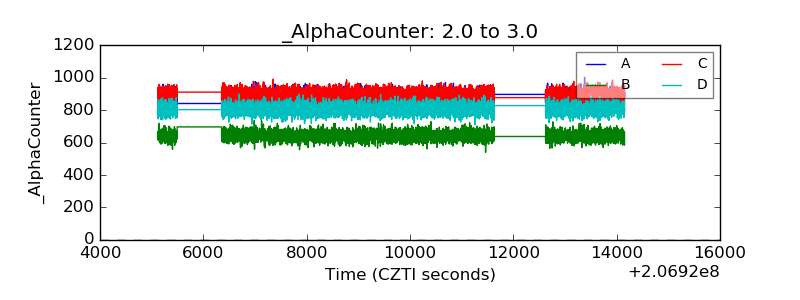 |
| _CPM_Rate | 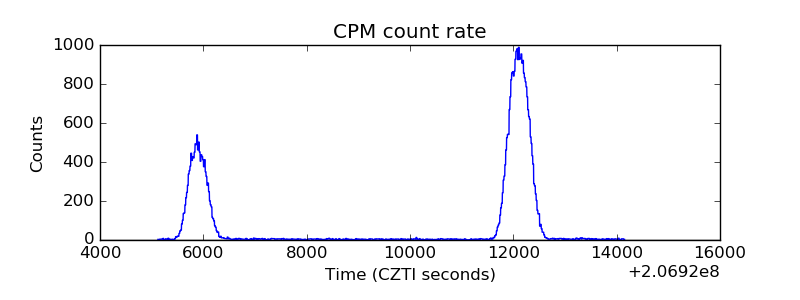 |
| CZT Counter | 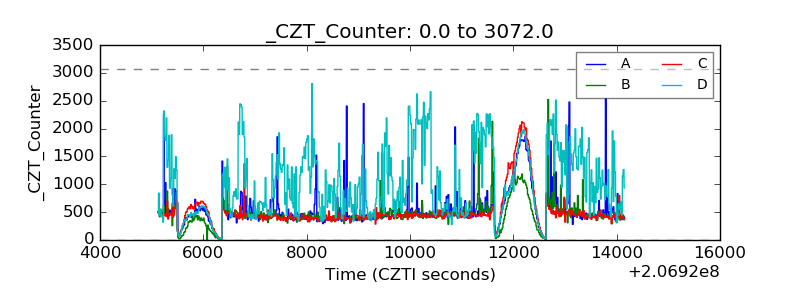 |
| +2.5 Volts monitor |  |
| +5 Volts monitor |  |
| _ROLL_ROT | 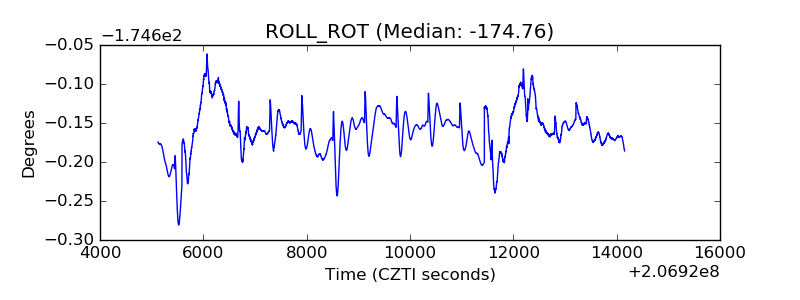 |
| _Roll_DEC | 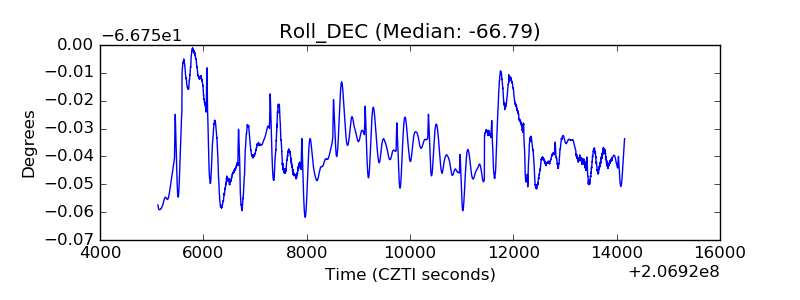 |
| _Roll_RA | 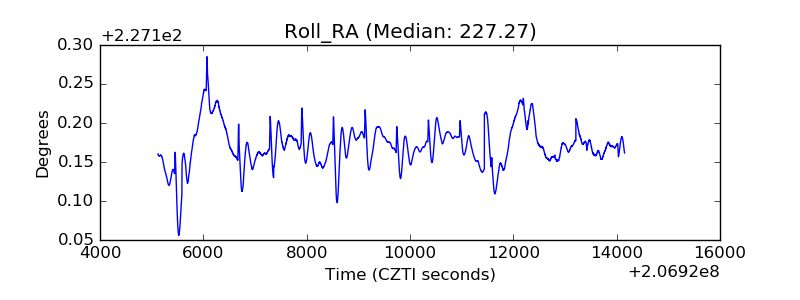 |
| Veto Counter | 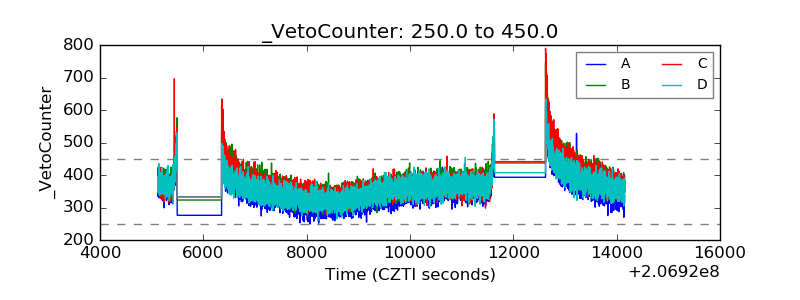 |