| Param | Original file | Final file |
|---|---|---|
| Filename | modeM0/AS1G05_230T04_9000000550_04426cztM0_level2.evt | modeM0/AS1G05_230T04_9000000550_04426cztM0_level2_quad_clean.evt |
| Size (bytes) | 563,915,520 | 83,096,640 |
| Size | 537.8 MB | 79.2 MB |
| Events in quadrant A | 3,060,382 | 531,860 |
| Events in quadrant B | 3,212,017 | 530,234 |
| Events in quadrant C | 3,264,915 | 526,771 |
| Events in quadrant D | 7,107,699 | 480,797 |
| Mode SS | |||
|---|---|---|---|
| Quadrant | BADHDUFLAG | Total packets | Discarded packets |
| A | 0 | 130 | 0 |
| B | 0 | 130 | 0 |
| C | 0 | 130 | 0 |
| D | 0 | 130 | 0 |
| Mode M9 | |||
|---|---|---|---|
| Quadrant | BADHDUFLAG | Total packets | Discarded packets |
| A | 0 | 11 | 0 |
| B | 0 | 11 | 0 |
| C | 0 | 11 | 0 |
| D | 0 | 11 | 0 |
| Mode M0 | |||
|---|---|---|---|
| Quadrant | BADHDUFLAG | Total packets | Discarded packets |
| A | 0 | 13599 | 2 |
| B | 0 | 13942 | 1 |
| C | 0 | 14154 | 1 |
| D | 0 | 25593 | 1 |
| Quadrant | Total seconds | Saturated seconds | Saturation percentage |
|---|---|---|---|
| A | 6395 | 62 | 0.969507% |
| B | 6395 | 62 | 0.969507% |
| C | 6395 | 140 | 2.189210% |
| D | 6395 | 703 | 10.992963% |
Noise dominated data is calculated using 1-second bins in cleaned event files. If a bin has >2000 counts, and if more than 50% of those come from <1% of pixels, then it is considered to be noise-dominated and hence unusable.
| Quadrant | # 1 sec bins | Bins with >0 counts | Bins with >2000 counts | High rate bins dominated by noise | Noise dominated (total time) | Noise dominated (detector-on time) | Marked lightcurve |
|---|---|---|---|---|---|---|---|
| A | 7500 | 6396 | 28 | 28 | 0.37% | 0.44% | 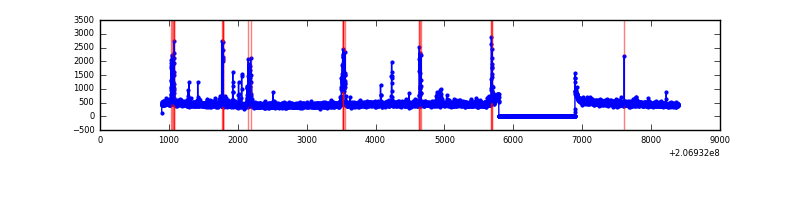 |
| B | 7500 | 6396 | 16 | 16 | 0.21% | 0.25% | 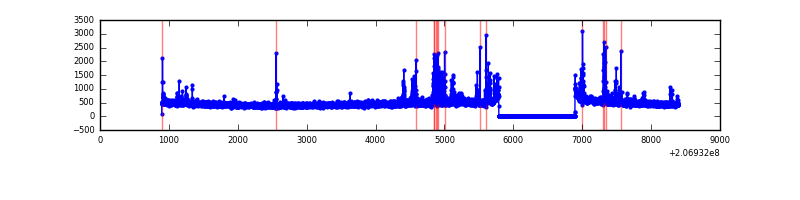 |
| C | 7500 | 6396 | 86 | 86 | 1.15% | 1.34% | 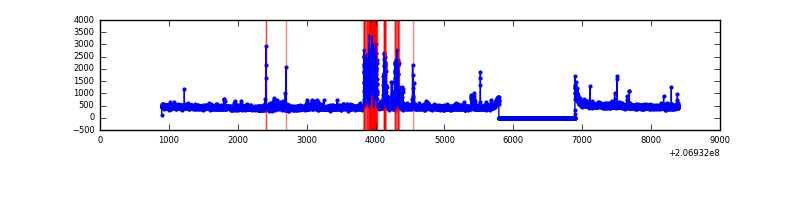 |
| D | 7500 | 6396 | 736 | 736 | 9.81% | 11.51% | 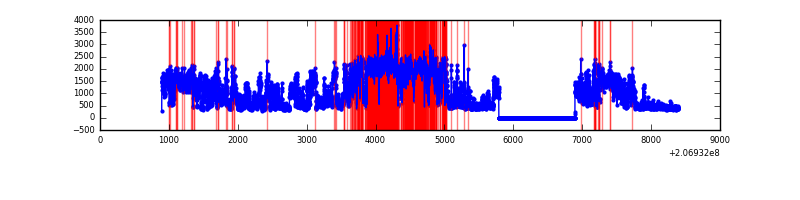 |
Top three noisy pixels from each quadrant. If the there are fewer than three noisy pixels in the level2.evt file, extra rows are filled as -1
| Pixel properties | Quadrant properties | ||||||
|---|---|---|---|---|---|---|---|
| Quadrant | DetID | PixID | Counts | Sigma | Mean | Median | Sigma |
| A | 0 | 13 | 157215 | 1070.94 | 725 | 710 | 146.1 |
| A | 0 | 118 | 69683 | 471.97 | 725 | 710 | 146.1 |
| A | 13 | 248 | 19642 | 129.55 | 725 | 710 | 146.1 |
| B | 14 | 167 | 165109 | 1181.92 | 736 | 718 | 139.1 |
| B | 10 | 16 | 110969 | 792.67 | 736 | 718 | 139.1 |
| B | 15 | 204 | 43776 | 309.57 | 736 | 718 | 139.1 |
| C | 9 | 247 | 385167 | 2336.7 | 711 | 712 | 164.5 |
| C | 14 | 48 | 70546 | 424.45 | 711 | 712 | 164.5 |
| C | 9 | 16 | 23188 | 136.61 | 711 | 712 | 164.5 |
| D | 13 | 114 | 3953107 | 23991.37 | 689 | 671 | 164.7 |
| D | 13 | 53 | 164406 | 993.87 | 689 | 671 | 164.7 |
| D | 2 | 136 | 108182 | 652.59 | 689 | 671 | 164.7 |
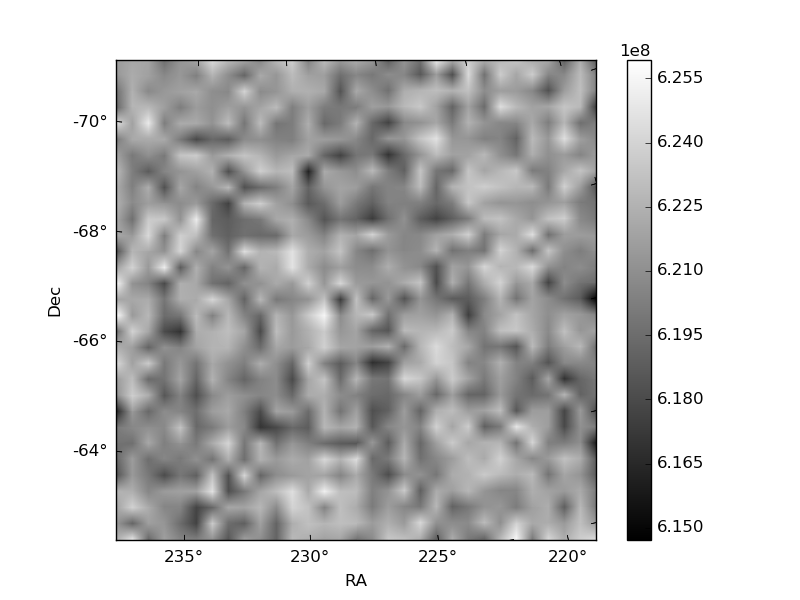
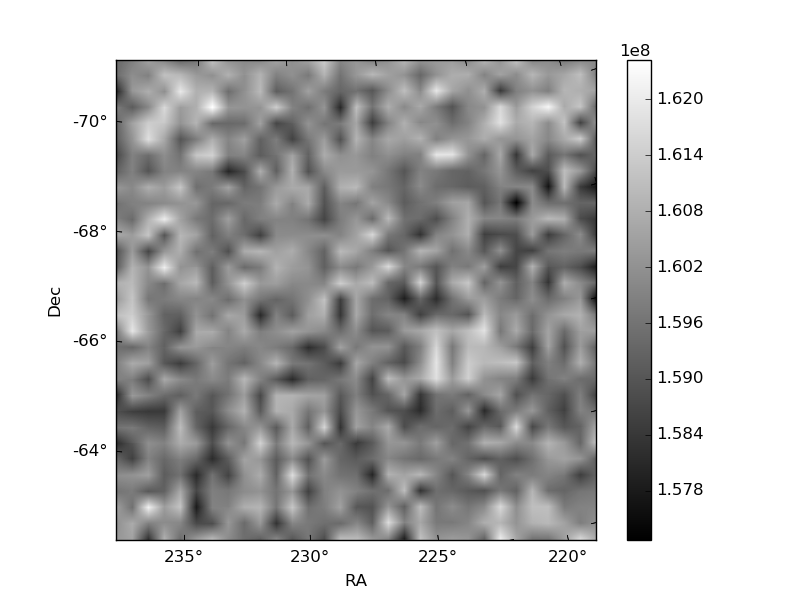
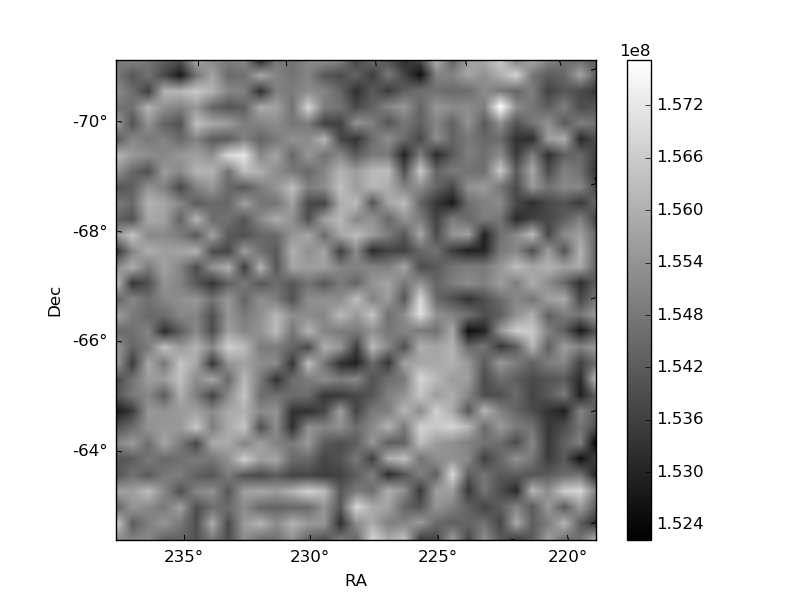
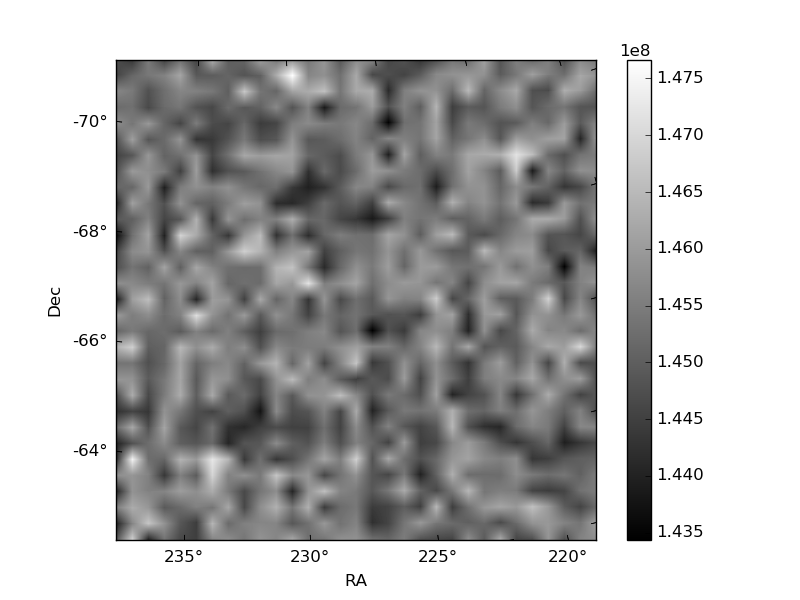
Histogram calculated using DETX and DETY for each event in the final _common_clean file
| Quadrant A | 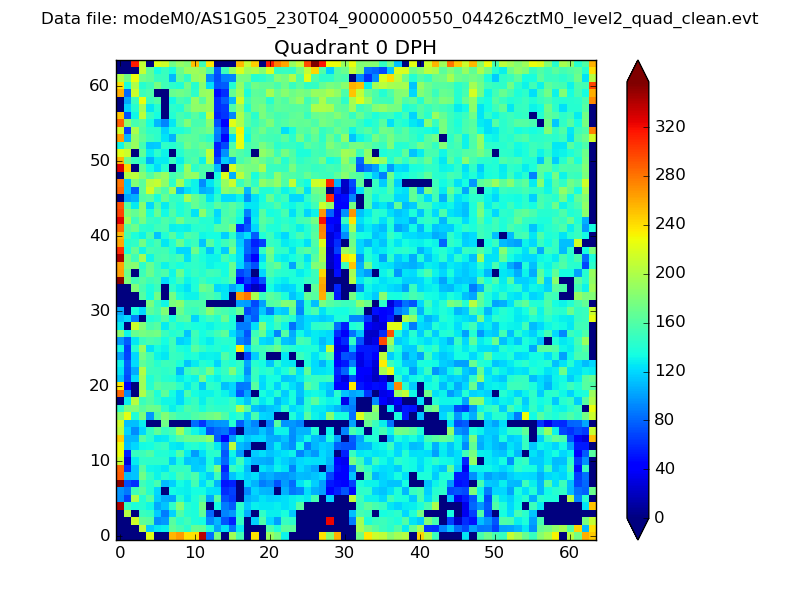 |
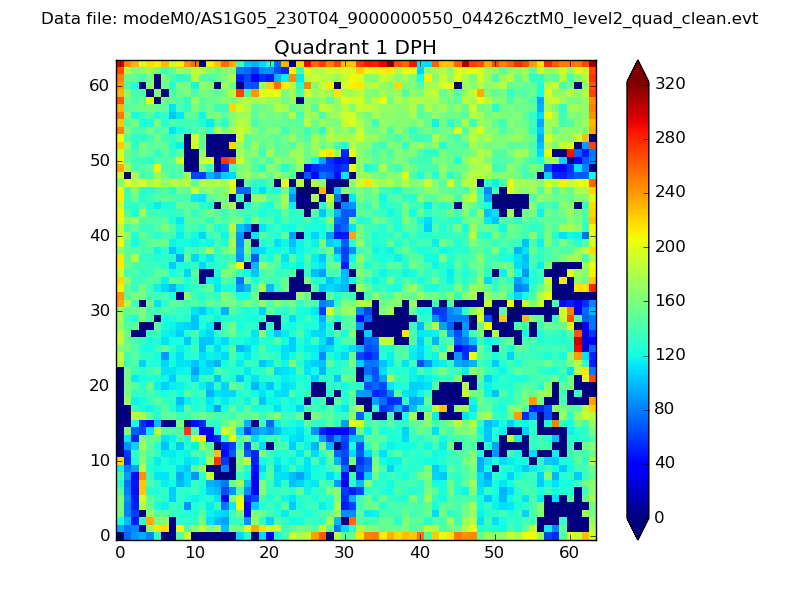 |
Quadrant B |
|---|---|---|---|
| Quadrant D | 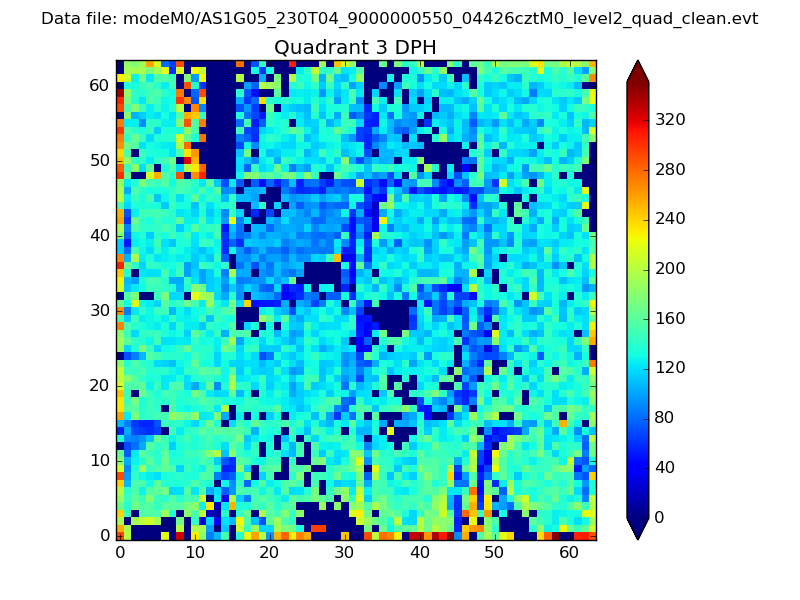 |
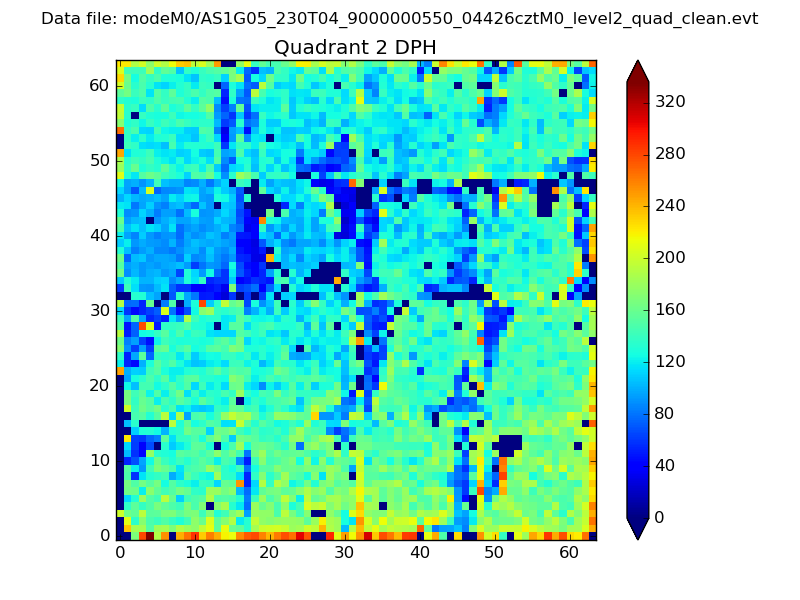 |
Quadrant C |
| Plot type | Count rate plots | Images |
|---|---|---|
| Comparison with Poisson distribution Blue bars denote a histogram of data divided into 1 sec bins. Red curve is a Poisson curve with rate = median count rate of data. |
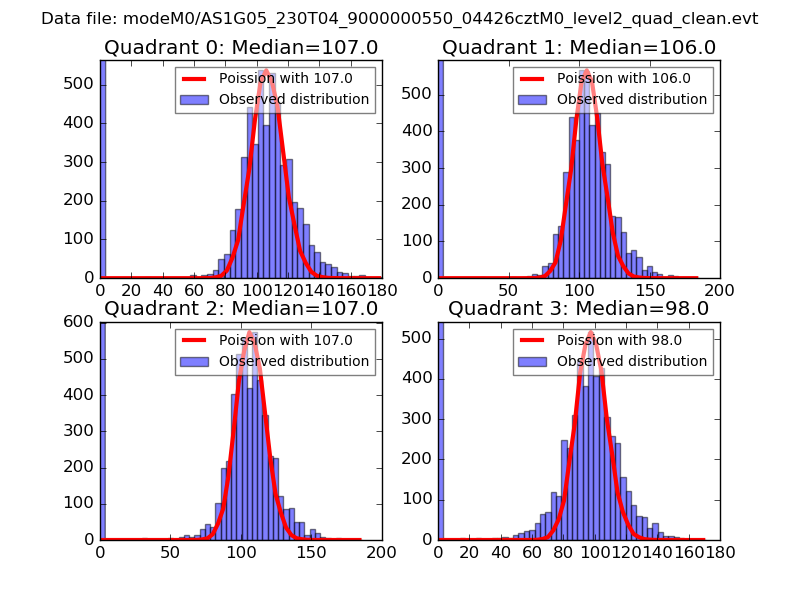 |
 |
| Quadrant-wise count rates Data is divided into 100 sec bins |
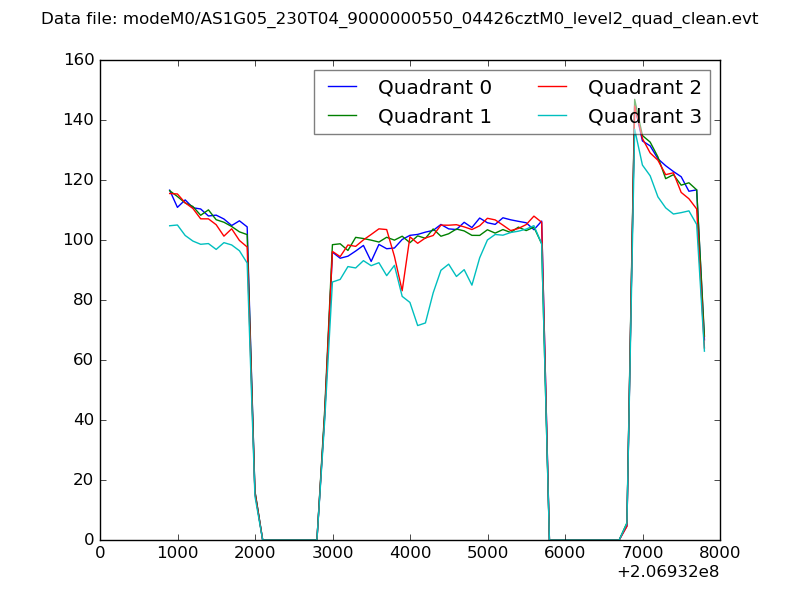 |
|
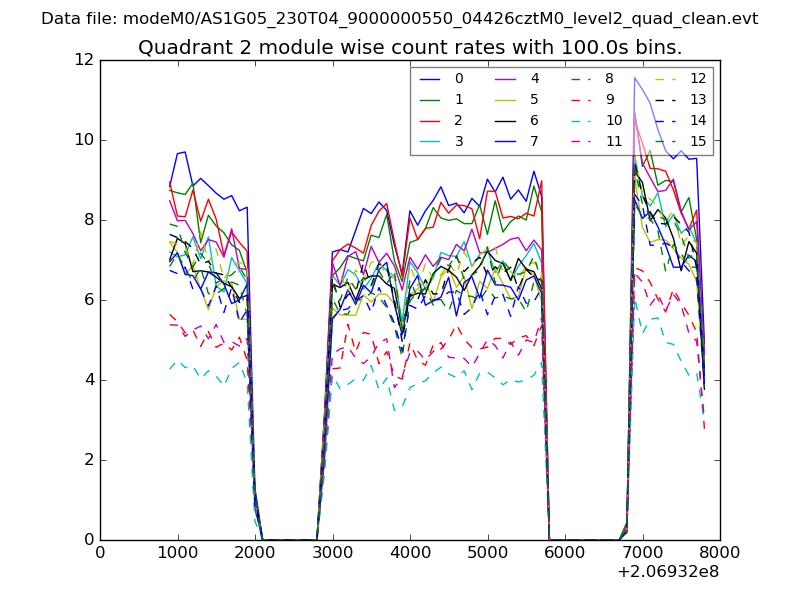
| Module-wise count rates for Quadrant A Data is divided into 100 sec bins |
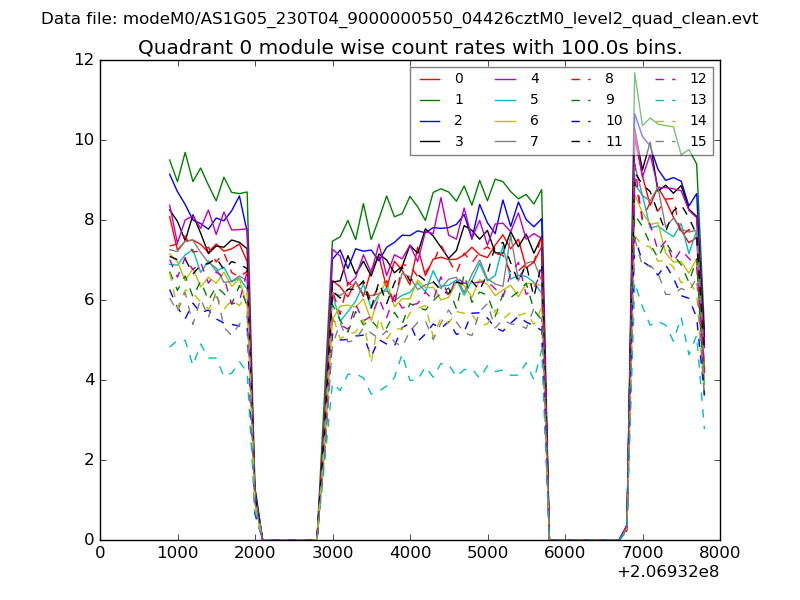 |
 |
| Module-wise count rates for Quadrant B Data is divided into 100 sec bins |
 |
 |
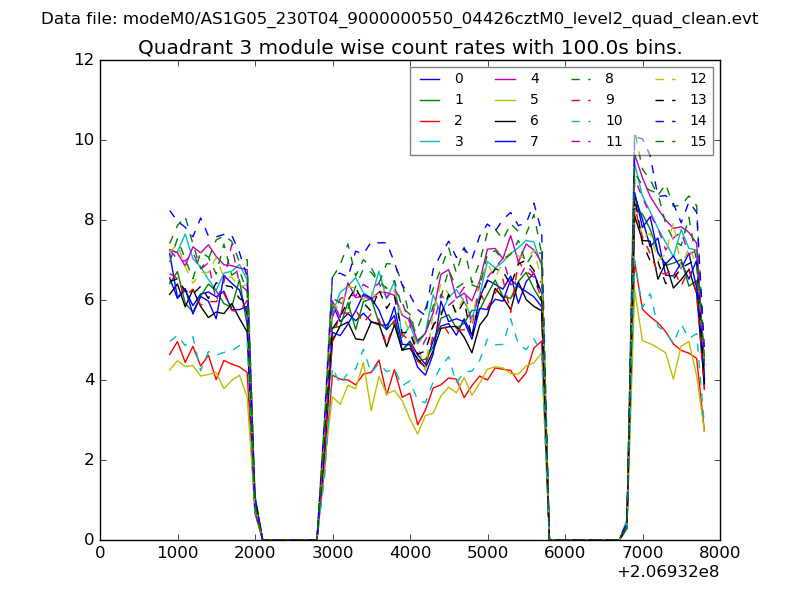
| Module-wise count rates for Quadrant C Data is divided into 100 sec bins |
 |
 |
| Module-wise count rates for Quadrant D Data is divided into 100 sec bins |
 |
 |
| Parameter | Plot |
|---|---|
| CZT HV Monitor | 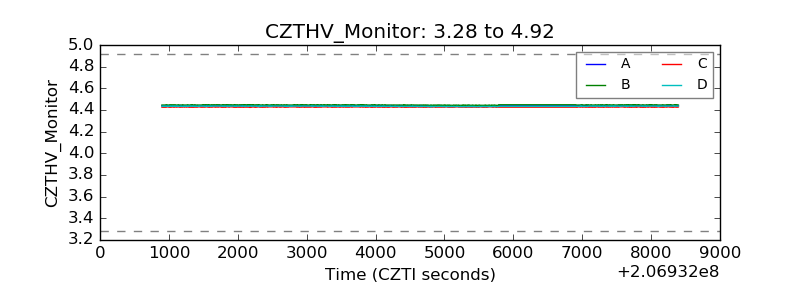 |
| D_VDD | 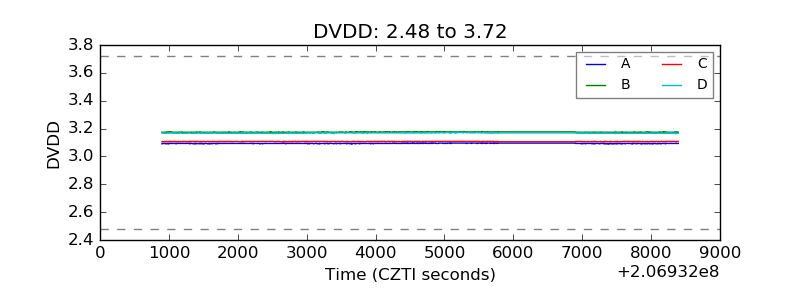 |
| Temperature 1 | 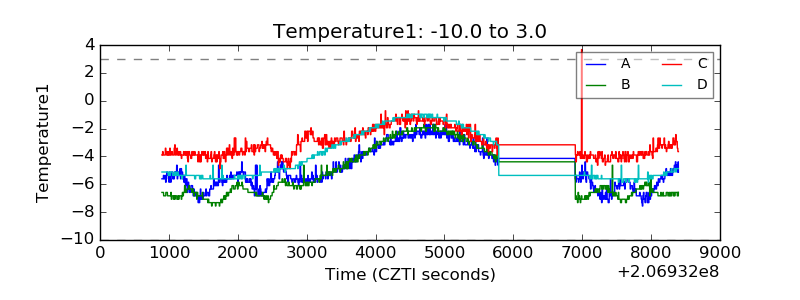 |
| Veto HV Monitor | 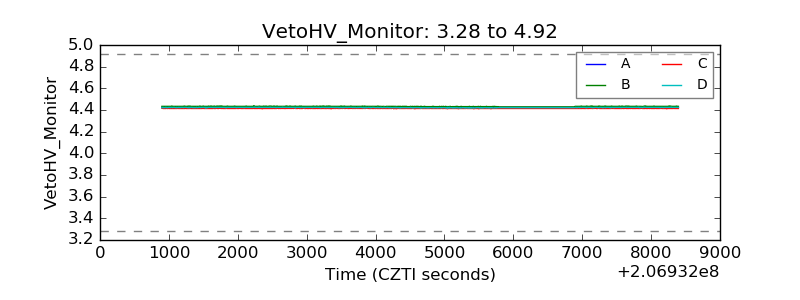 |
| Veto LLD | 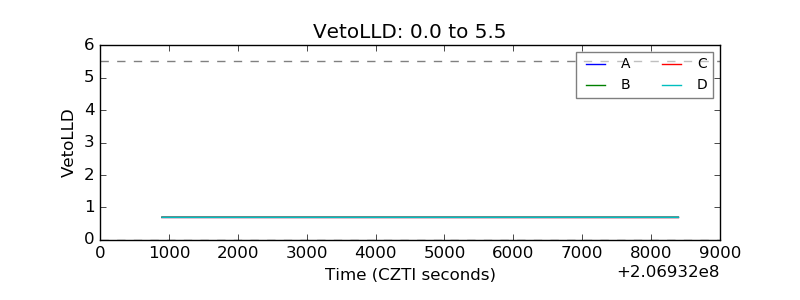 |
| Alpha Counter | 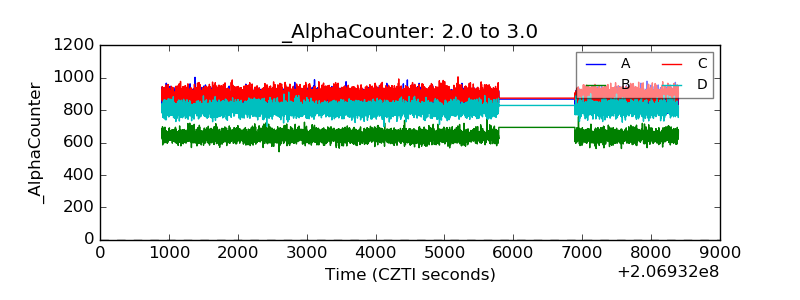 |
| _CPM_Rate | 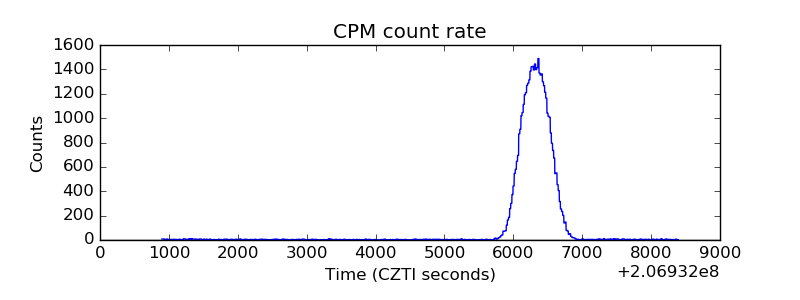 |
| CZT Counter | 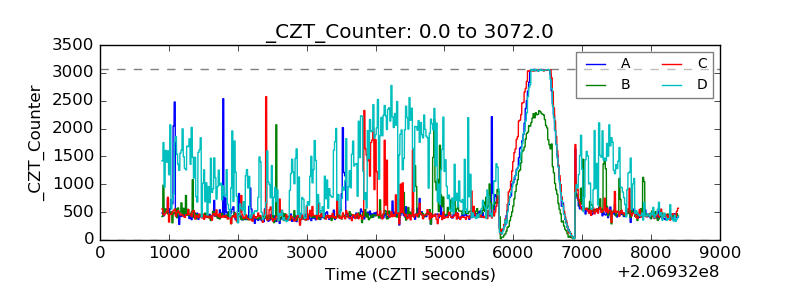 |
| +2.5 Volts monitor |  |
| +5 Volts monitor |  |
| _ROLL_ROT | 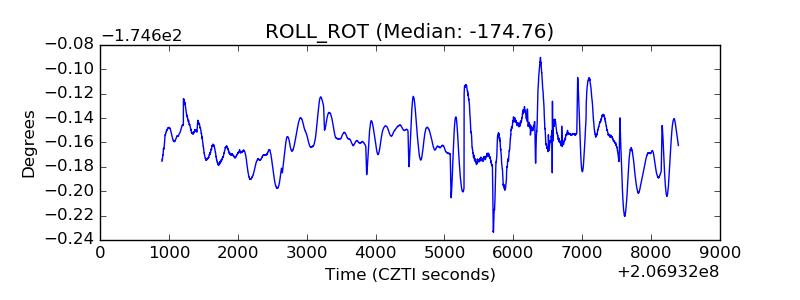 |
| _Roll_DEC | 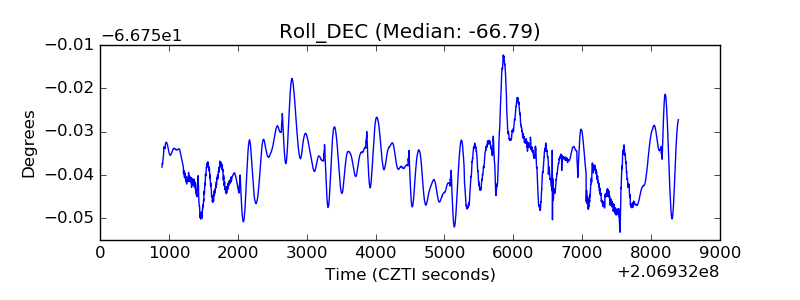 |
| _Roll_RA | 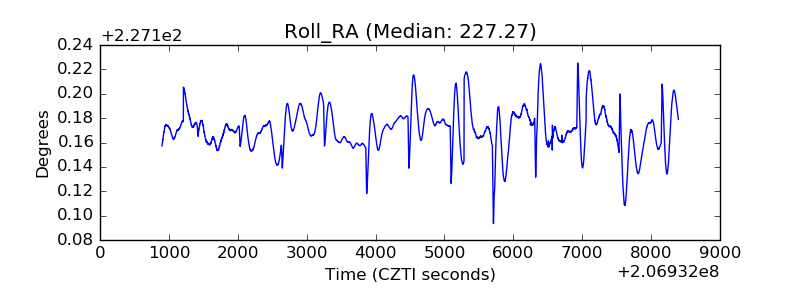 |
| Veto Counter | 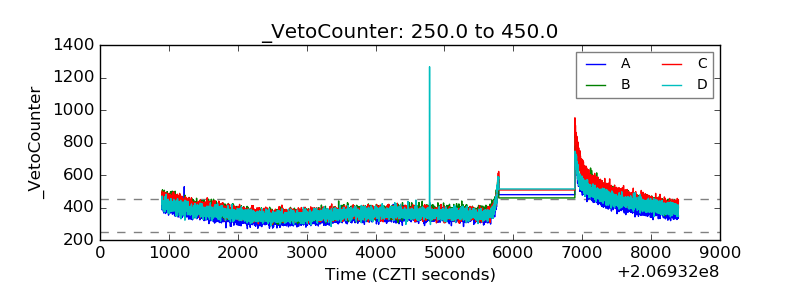 |