| Param | Original file | Final file |
|---|---|---|
| Filename | modeM0/AS1G05_230T04_9000000550_04428cztM0_level2.evt | modeM0/AS1G05_230T04_9000000550_04428cztM0_level2_quad_clean.evt |
| Size (bytes) | 542,615,040 | 72,218,880 |
| Size | 517.5 MB | 68.9 MB |
| Events in quadrant A | 3,448,149 | 445,341 |
| Events in quadrant B | 5,714,503 | 425,721 |
| Events in quadrant C | 3,585,397 | 457,199 |
| Events in quadrant D | 3,283,530 | 444,422 |
| Mode SS | |||
|---|---|---|---|
| Quadrant | BADHDUFLAG | Total packets | Discarded packets |
| A | 0 | 120 | 0 |
| B | 0 | 120 | 0 |
| C | 0 | 120 | 0 |
| D | 0 | 120 | 0 |
| Mode M9 | |||
|---|---|---|---|
| Quadrant | BADHDUFLAG | Total packets | Discarded packets |
| A | 0 | 12 | 0 |
| B | 0 | 12 | 0 |
| C | 0 | 12 | 0 |
| D | 0 | 12 | 0 |
| Mode M0 | |||
|---|---|---|---|
| Quadrant | BADHDUFLAG | Total packets | Discarded packets |
| A | 0 | 14046 | 2 |
| B | 0 | 20815 | 1 |
| C | 0 | 14520 | 1 |
| D | 0 | 13700 | 1 |
| Quadrant | Total seconds | Saturated seconds | Saturation percentage |
|---|---|---|---|
| A | 5923 | 229 | 3.866284% |
| B | 5923 | 1100 | 18.571670% |
| C | 5923 | 70 | 1.181834% |
| D | 5923 | 127 | 2.144184% |
Noise dominated data is calculated using 1-second bins in cleaned event files. If a bin has >2000 counts, and if more than 50% of those come from <1% of pixels, then it is considered to be noise-dominated and hence unusable.
| Quadrant | # 1 sec bins | Bins with >0 counts | Bins with >2000 counts | High rate bins dominated by noise | Noise dominated (total time) | Noise dominated (detector-on time) | Marked lightcurve |
|---|---|---|---|---|---|---|---|
| A | 7149 | 5924 | 70 | 70 | 0.98% | 1.18% | 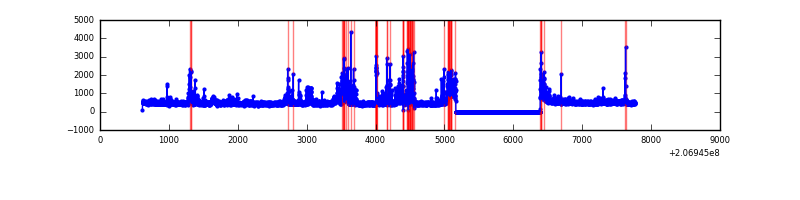 |
| B | 7149 | 5924 | 882 | 882 | 12.34% | 14.89% | 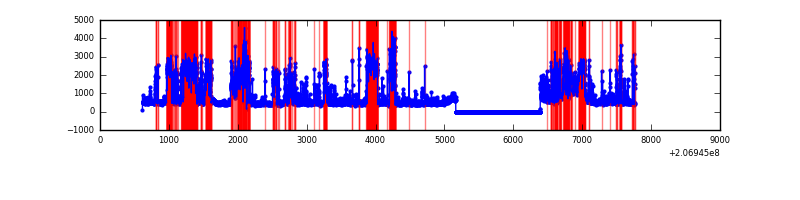 |
| C | 7149 | 5924 | 1 | 1 | 0.01% | 0.02% | 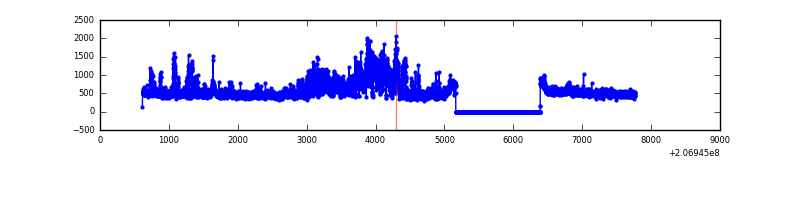 |
| D | 7149 | 5924 | 66 | 66 | 0.92% | 1.11% | 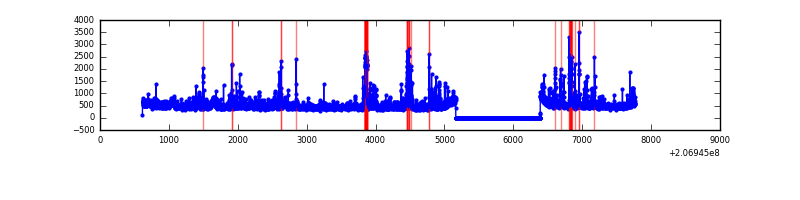 |
Top three noisy pixels from each quadrant. If the there are fewer than three noisy pixels in the level2.evt file, extra rows are filled as -1
| Pixel properties | Quadrant properties | ||||||
|---|---|---|---|---|---|---|---|
| Quadrant | DetID | PixID | Counts | Sigma | Mean | Median | Sigma |
| A | 0 | 13 | 682751 | 4776.91 | 709 | 695 | 142.8 |
| A | 8 | 15 | 31685 | 217.04 | 709 | 695 | 142.8 |
| A | 13 | 14 | 7277 | 46.1 | 709 | 695 | 142.8 |
| B | 10 | 16 | 1554456 | 12323.39 | 673 | 659 | 126.1 |
| B | 14 | 167 | 1494166 | 11845.22 | 673 | 659 | 126.1 |
| B | 4 | 170 | 25569 | 197.56 | 673 | 659 | 126.1 |
| C | 14 | 48 | 782815 | 4872.28 | 706 | 709 | 160.5 |
| C | 9 | 247 | 22040 | 132.89 | 706 | 709 | 160.5 |
| C | 9 | 16 | 19566 | 117.47 | 706 | 709 | 160.5 |
| D | 13 | 239 | 203601 | 1221.97 | 701 | 682 | 166.1 |
| D | 13 | 114 | 201984 | 1212.24 | 701 | 682 | 166.1 |
| D | 13 | 53 | 63447 | 377.97 | 701 | 682 | 166.1 |
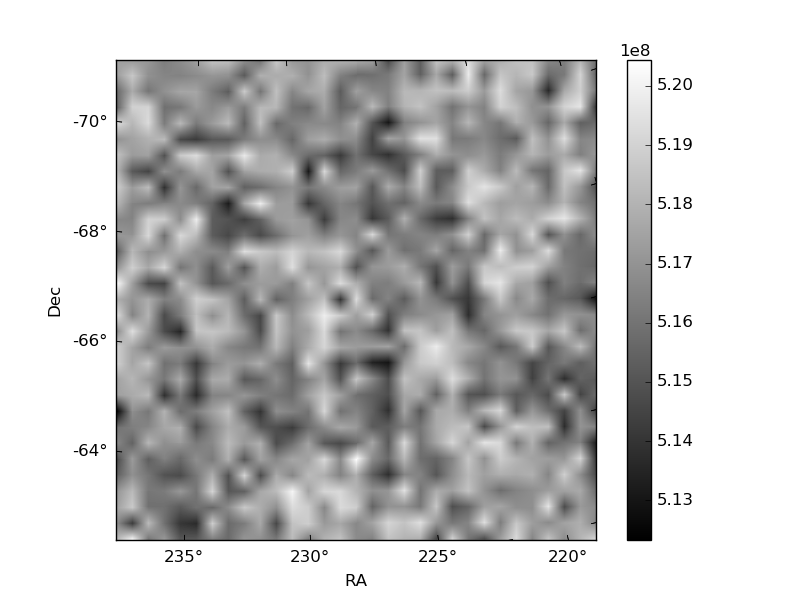
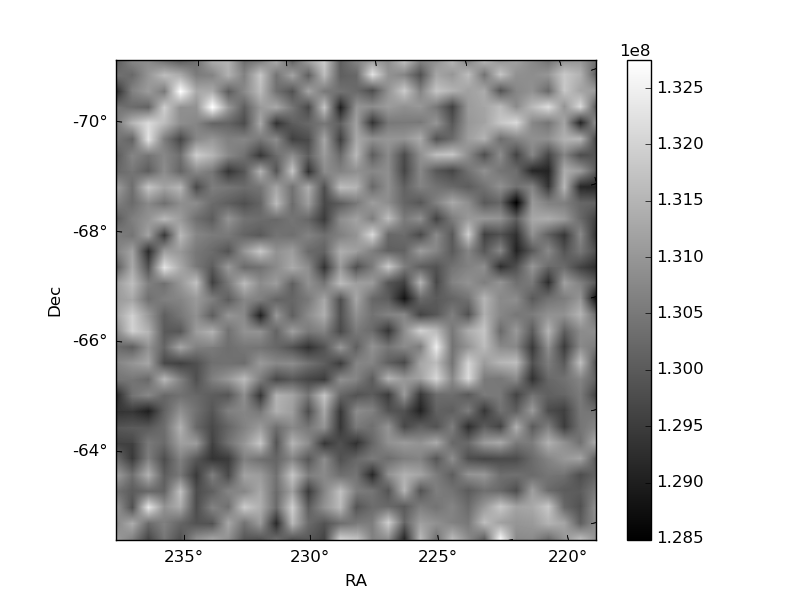
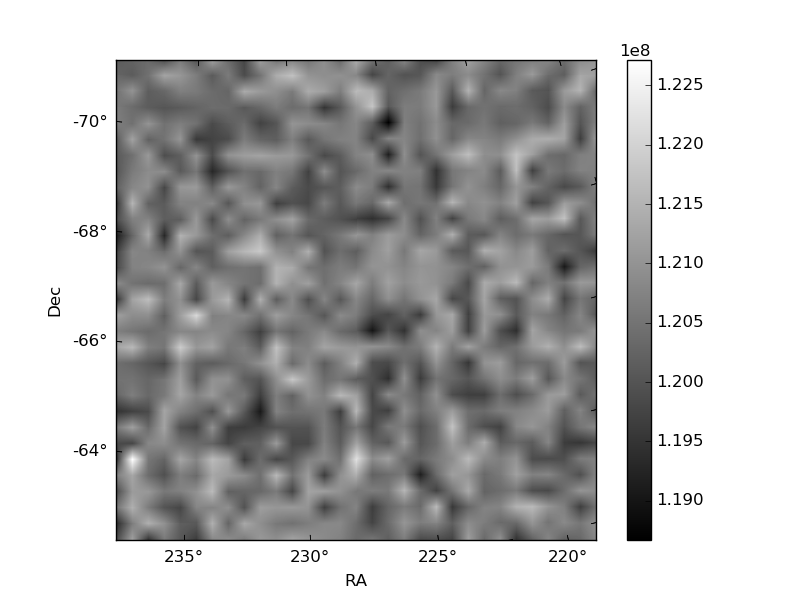
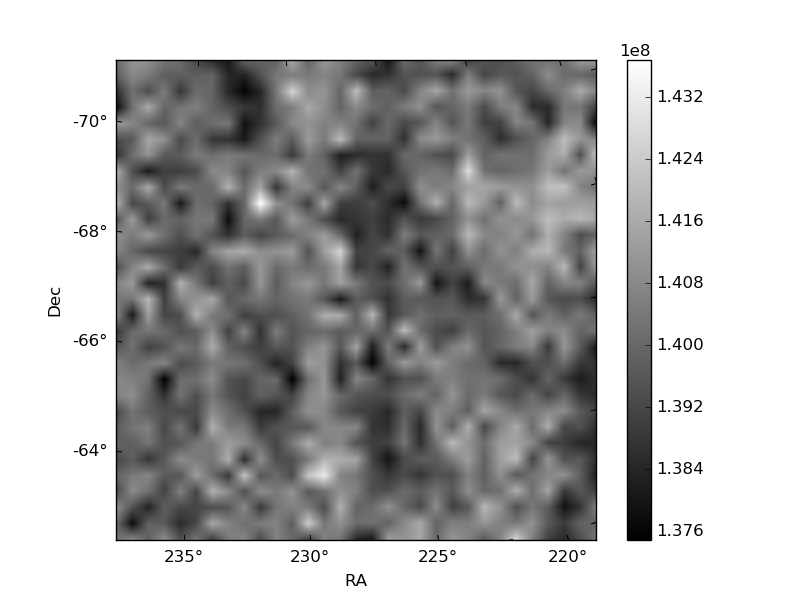
Histogram calculated using DETX and DETY for each event in the final _common_clean file
| Quadrant A | 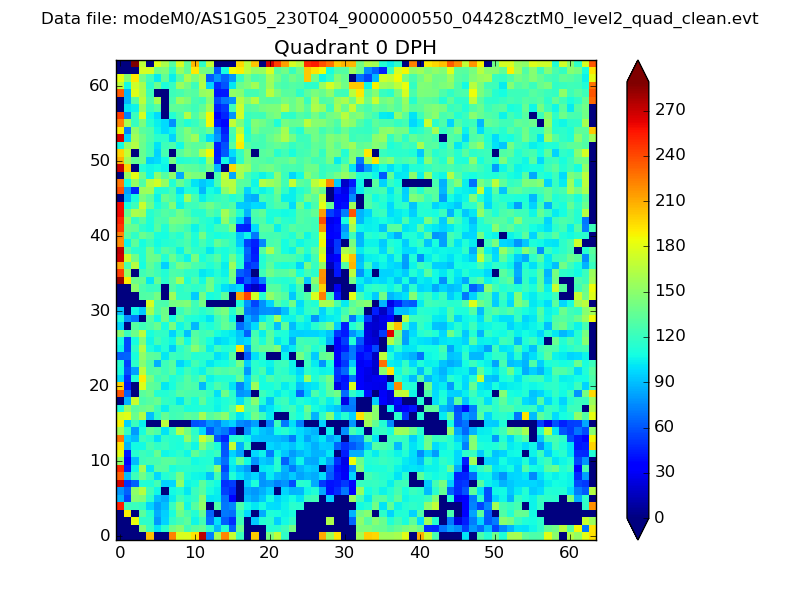 |
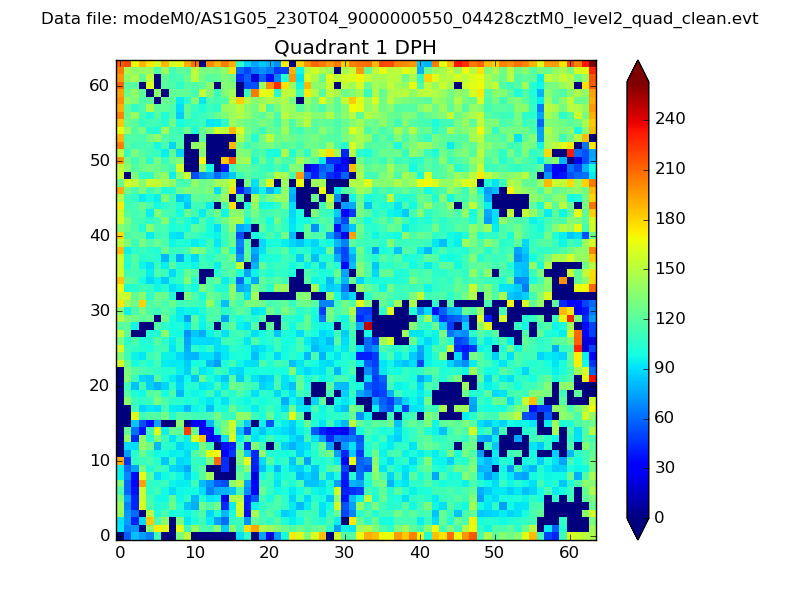 |
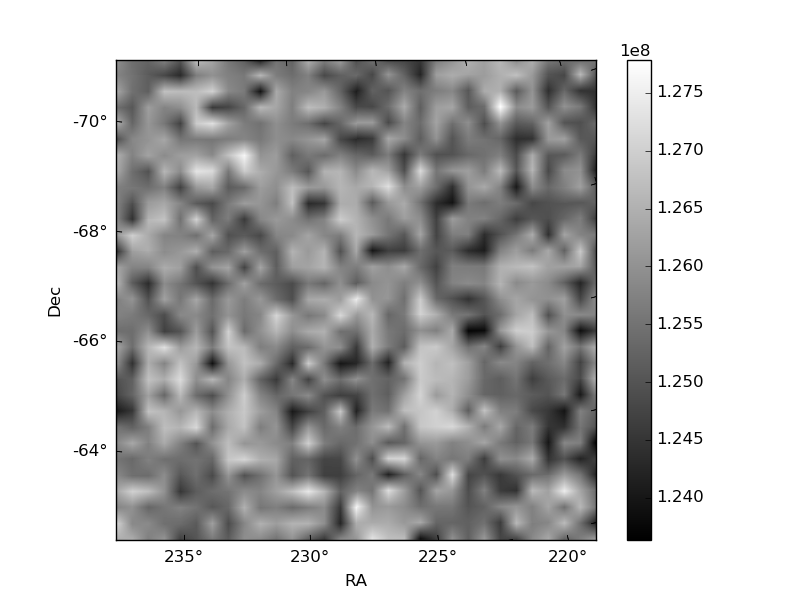
Quadrant B |
|---|---|---|---|
| Quadrant D | 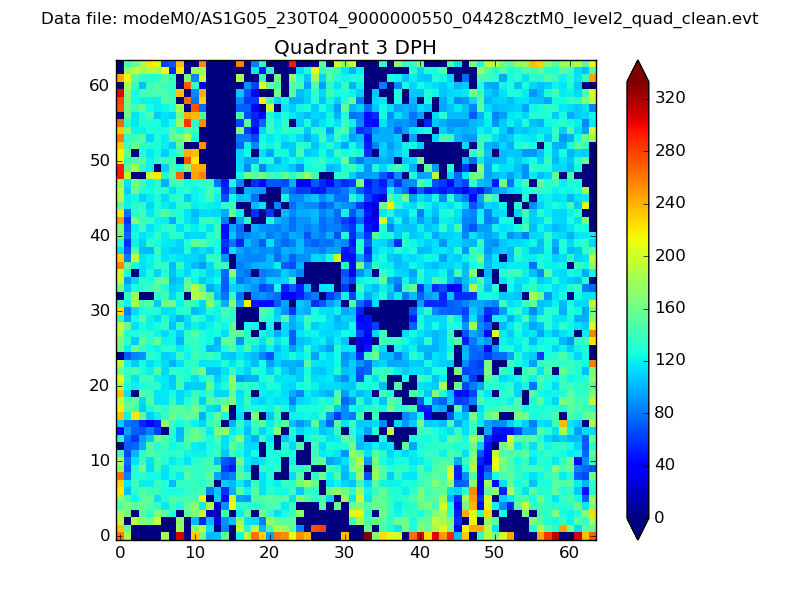 |
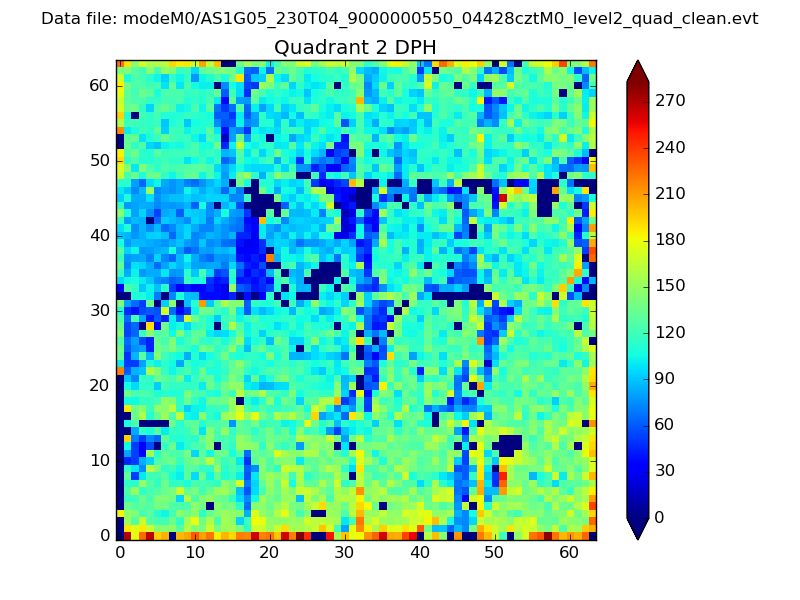 |
Quadrant C |
| Plot type | Count rate plots | Images |
|---|---|---|
| Comparison with Poisson distribution Blue bars denote a histogram of data divided into 1 sec bins. Red curve is a Poisson curve with rate = median count rate of data. |
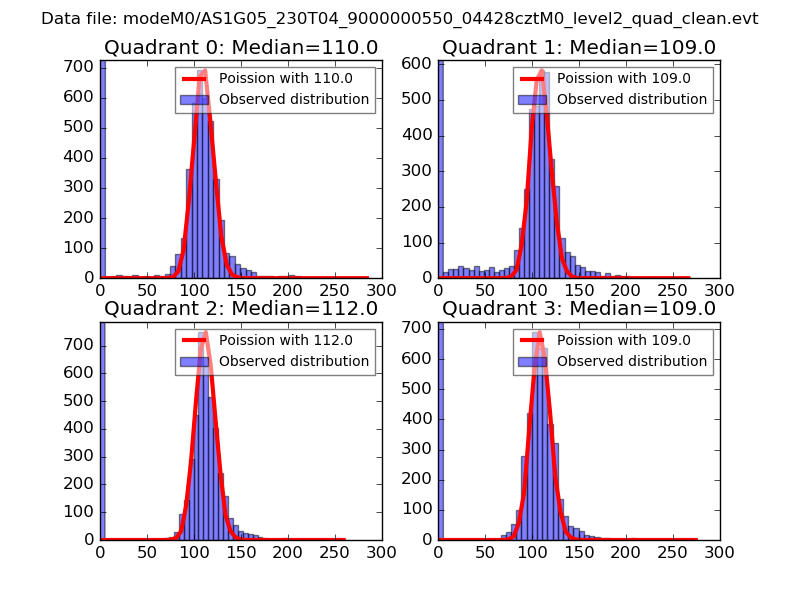 |
 |
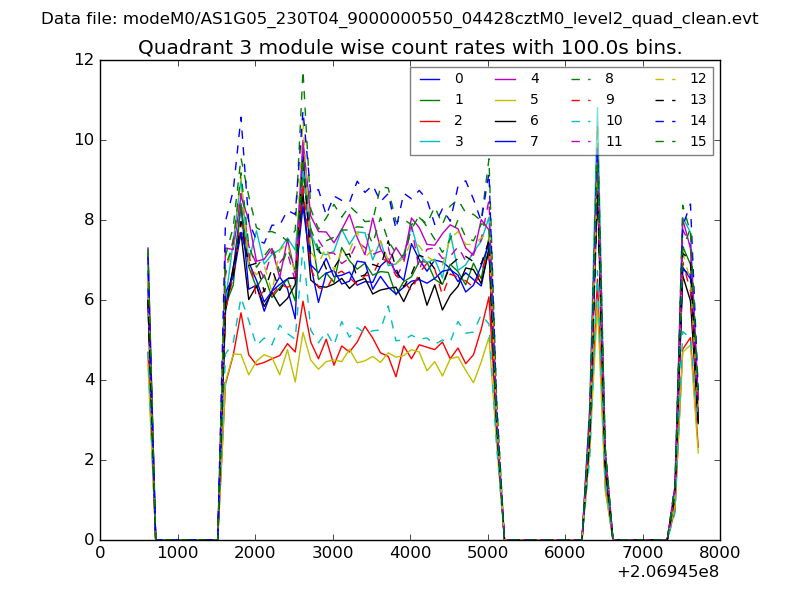
| Quadrant-wise count rates Data is divided into 100 sec bins |
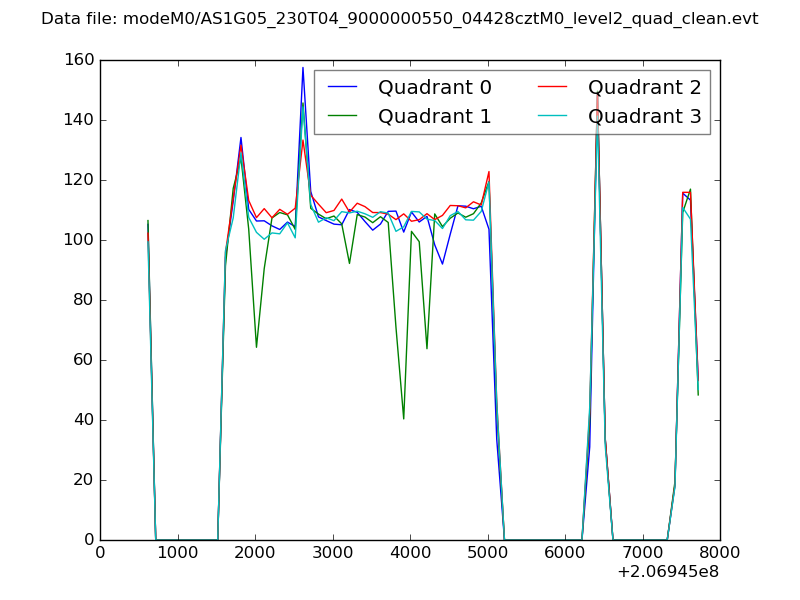 |
|
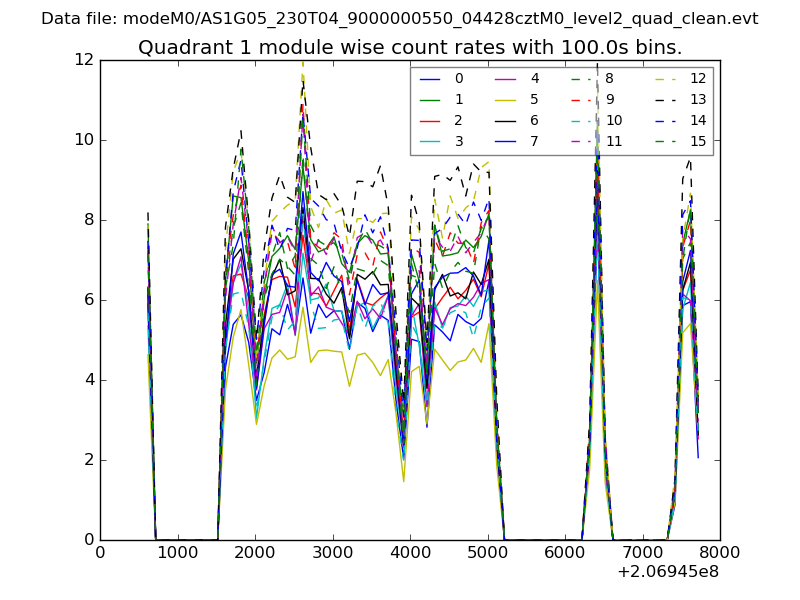
| Module-wise count rates for Quadrant A Data is divided into 100 sec bins |
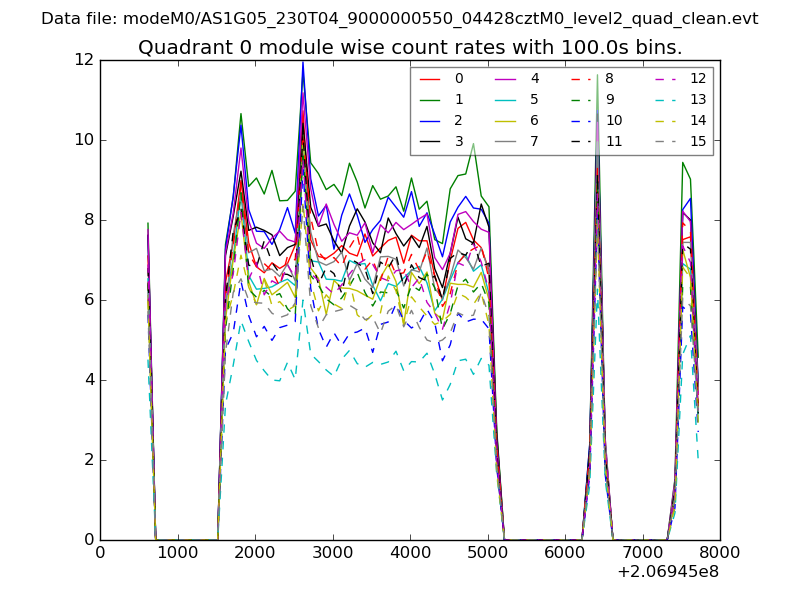 |
 |
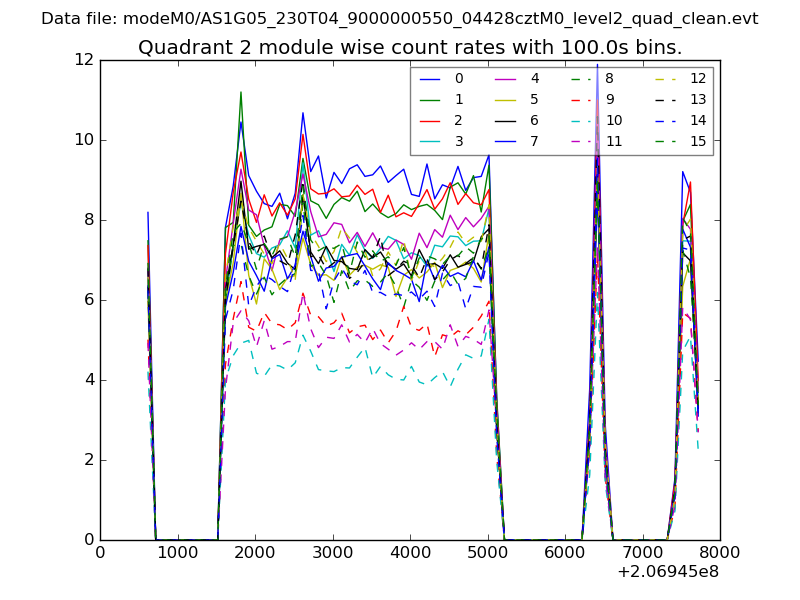
| Module-wise count rates for Quadrant B Data is divided into 100 sec bins |
 |
 |
| Module-wise count rates for Quadrant C Data is divided into 100 sec bins |
 |
 |
| Module-wise count rates for Quadrant D Data is divided into 100 sec bins |
 |
 |
| Parameter | Plot |
|---|---|
| CZT HV Monitor | 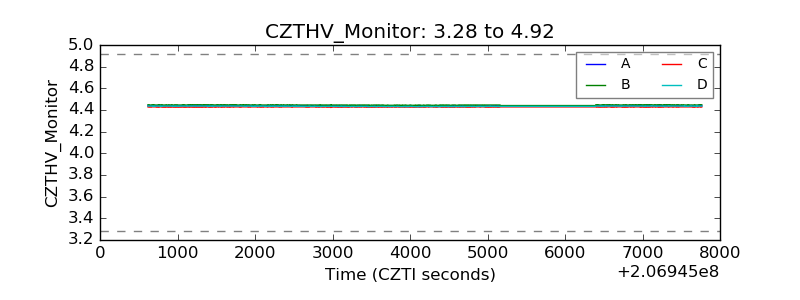 |
| D_VDD | 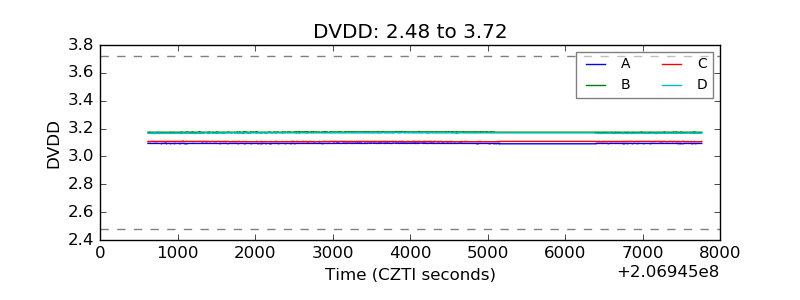 |
| Temperature 1 | 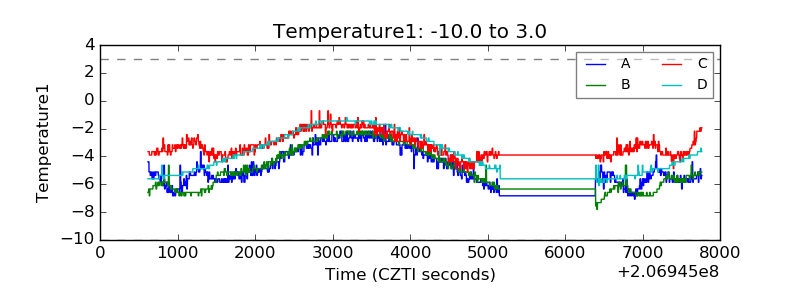 |
| Veto HV Monitor | 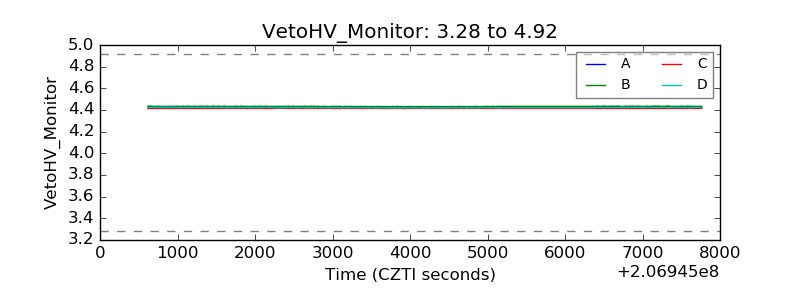 |
| Veto LLD |  |
| Alpha Counter | 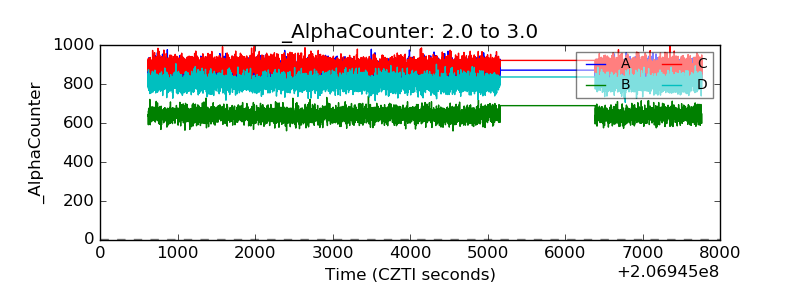 |
| _CPM_Rate | 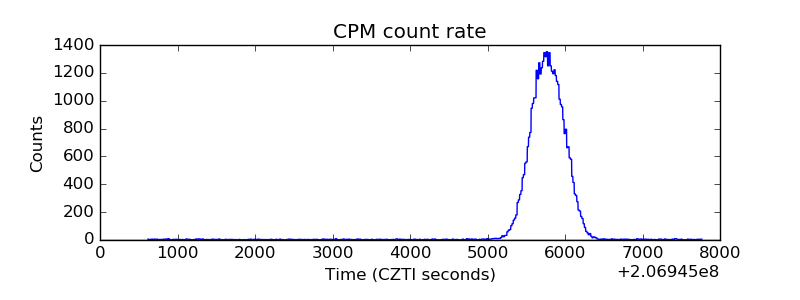 |
| CZT Counter | 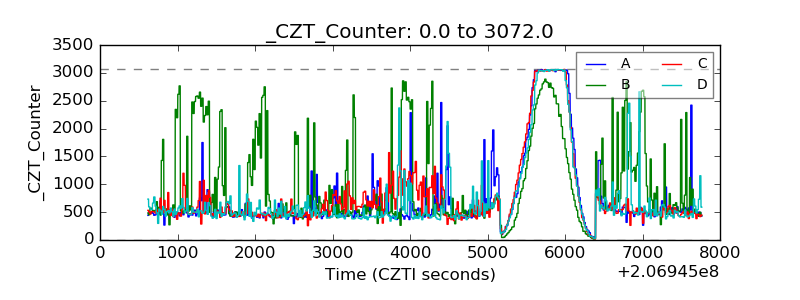 |
| +2.5 Volts monitor |  |
| +5 Volts monitor |  |
| _ROLL_ROT | 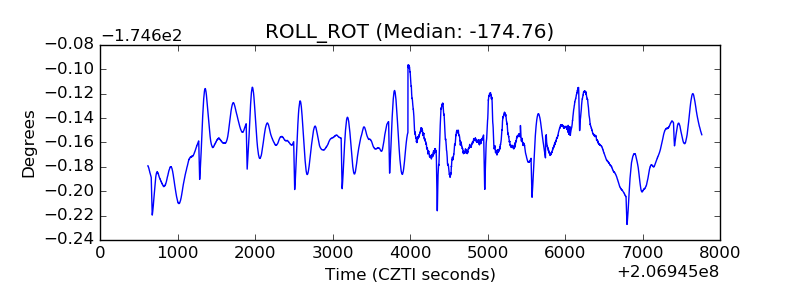 |
| _Roll_DEC | 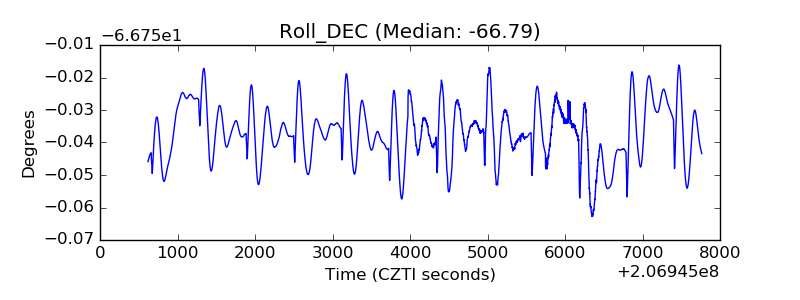 |
| _Roll_RA | 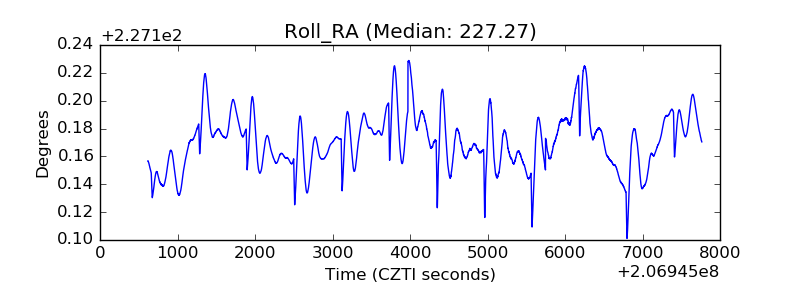 |
| Veto Counter | 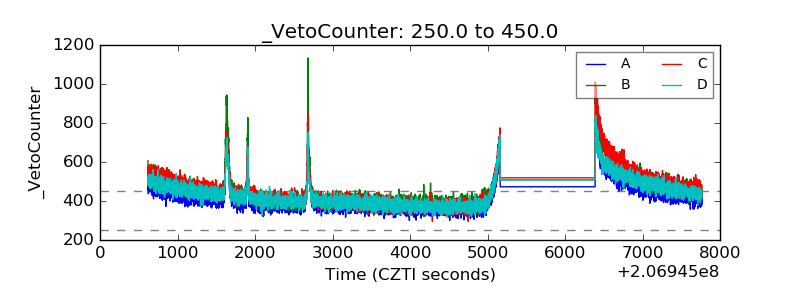 |