| Param | Original file | Final file |
|---|---|---|
| Filename | modeM0/AS1G05_230T04_9000000550_04429cztM0_level2.evt | modeM0/AS1G05_230T04_9000000550_04429cztM0_level2_quad_clean.evt |
| Size (bytes) | 595,722,240 | 77,886,720 |
| Size | 568.1 MB | 74.3 MB |
| Events in quadrant A | 3,576,432 | 492,821 |
| Events in quadrant B | 4,014,647 | 495,333 |
| Events in quadrant C | 2,837,930 | 508,629 |
| Events in quadrant D | 7,202,211 | 437,873 |
| Mode SS | |||
|---|---|---|---|
| Quadrant | BADHDUFLAG | Total packets | Discarded packets |
| A | 0 | 122 | 0 |
| B | 0 | 122 | 0 |
| C | 0 | 122 | 0 |
| D | 0 | 122 | 0 |
| Mode M9 | |||
|---|---|---|---|
| Quadrant | BADHDUFLAG | Total packets | Discarded packets |
| A | 0 | 13 | 0 |
| B | 0 | 13 | 0 |
| C | 0 | 13 | 0 |
| D | 0 | 13 | 0 |
| Mode M0 | |||
|---|---|---|---|
| Quadrant | BADHDUFLAG | Total packets | Discarded packets |
| A | 0 | 14580 | 2 |
| B | 0 | 15878 | 1 |
| C | 0 | 12466 | 1 |
| D | 0 | 25403 | 1 |
| Quadrant | Total seconds | Saturated seconds | Saturation percentage |
|---|---|---|---|
| A | 6062 | 181 | 2.985813% |
| B | 6062 | 390 | 6.433520% |
| C | 6062 | 45 | 0.742329% |
| D | 6062 | 1305 | 21.527549% |
Noise dominated data is calculated using 1-second bins in cleaned event files. If a bin has >2000 counts, and if more than 50% of those come from <1% of pixels, then it is considered to be noise-dominated and hence unusable.
| Quadrant | # 1 sec bins | Bins with >0 counts | Bins with >2000 counts | High rate bins dominated by noise | Noise dominated (total time) | Noise dominated (detector-on time) | Marked lightcurve |
|---|---|---|---|---|---|---|---|
| A | 7337 | 6063 | 98 | 98 | 1.34% | 1.62% | 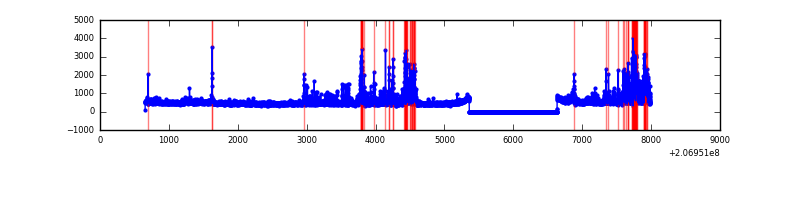 |
| B | 7337 | 6063 | 280 | 280 | 3.82% | 4.62% | 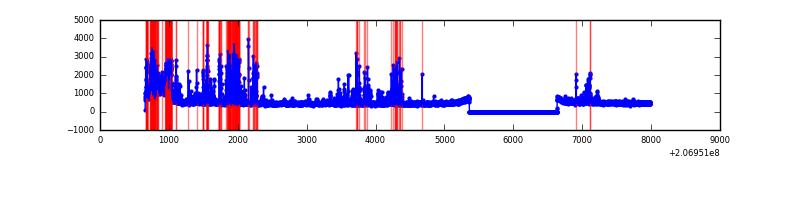 |
| C | 7337 | 6063 | 2 | 2 | 0.03% | 0.03% | 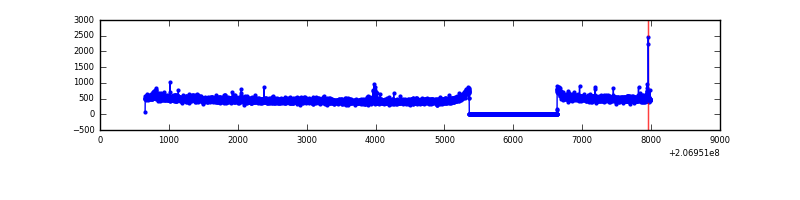 |
| D | 7337 | 6063 | 1381 | 1381 | 18.82% | 22.78% | 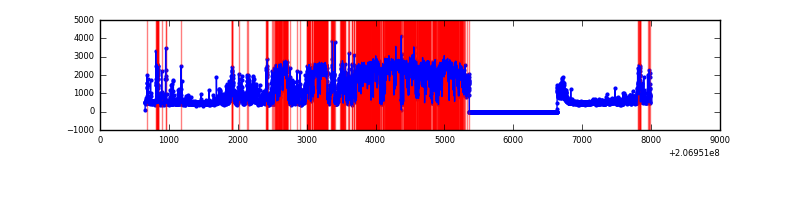 |
Top three noisy pixels from each quadrant. If the there are fewer than three noisy pixels in the level2.evt file, extra rows are filled as -1
| Pixel properties | Quadrant properties | ||||||
|---|---|---|---|---|---|---|---|
| Quadrant | DetID | PixID | Counts | Sigma | Mean | Median | Sigma |
| A | 0 | 13 | 683535 | 4669.97 | 725 | 712 | 146.2 |
| A | 0 | 50 | 40350 | 271.09 | 725 | 712 | 146.2 |
| A | 8 | 15 | 30655 | 204.79 | 725 | 712 | 146.2 |
| B | 14 | 167 | 700142 | 5217.35 | 719 | 700 | 134.1 |
| B | 10 | 16 | 463940 | 3455.45 | 719 | 700 | 134.1 |
| B | 15 | 54 | 27195 | 197.63 | 719 | 700 | 134.1 |
| C | 9 | 247 | 34689 | 208.85 | 714 | 718 | 162.7 |
| C | 12 | 4 | 7554 | 42.03 | 714 | 718 | 162.7 |
| C | 9 | 16 | 7224 | 40.0 | 714 | 718 | 162.7 |
| D | 13 | 114 | 4126159 | 26034.37 | 677 | 660 | 158.5 |
| D | 13 | 239 | 141414 | 888.24 | 677 | 660 | 158.5 |
| D | 13 | 53 | 84626 | 529.88 | 677 | 660 | 158.5 |
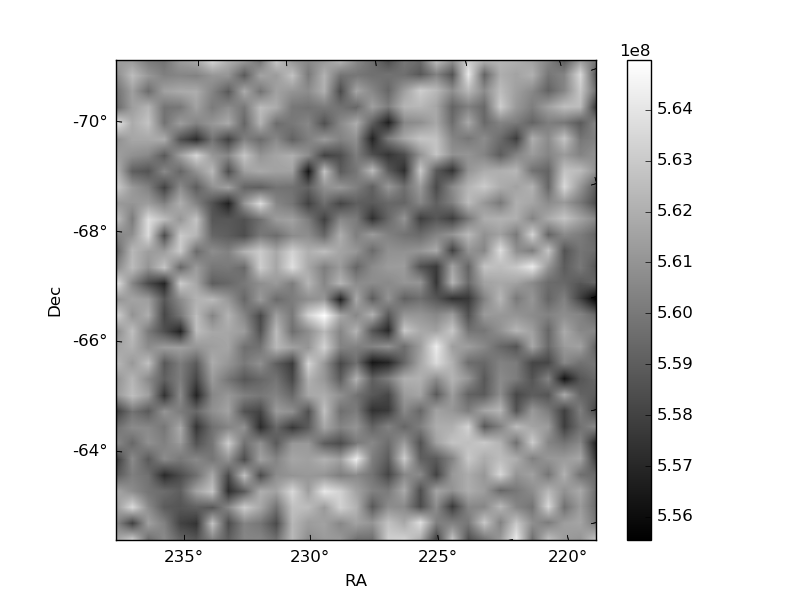
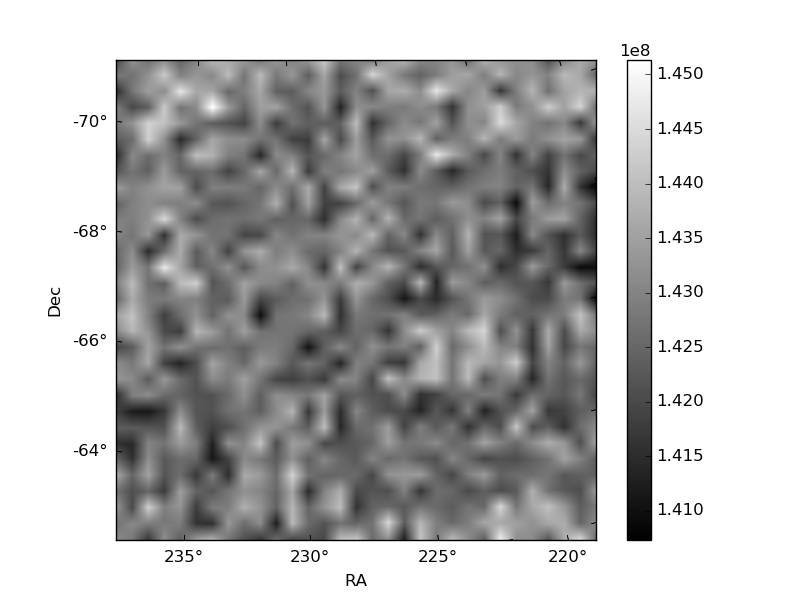
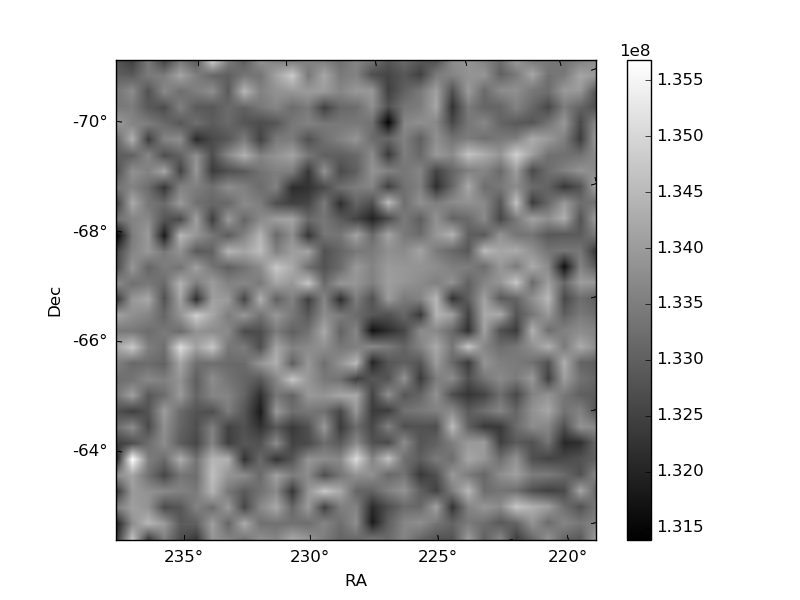
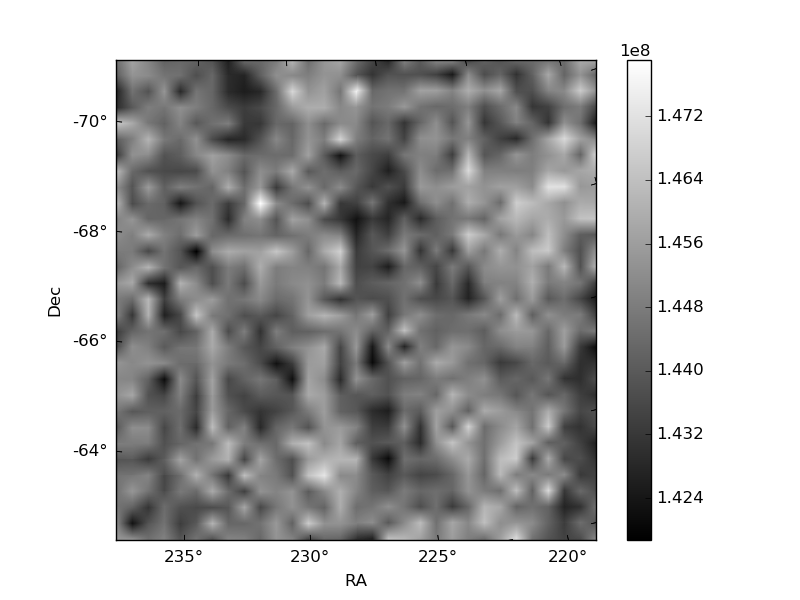
Histogram calculated using DETX and DETY for each event in the final _common_clean file
| Quadrant A | 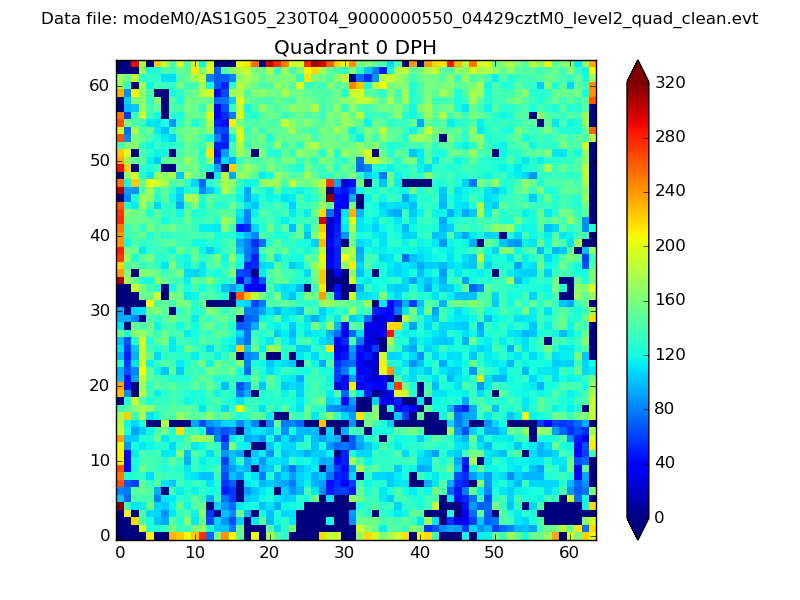 |
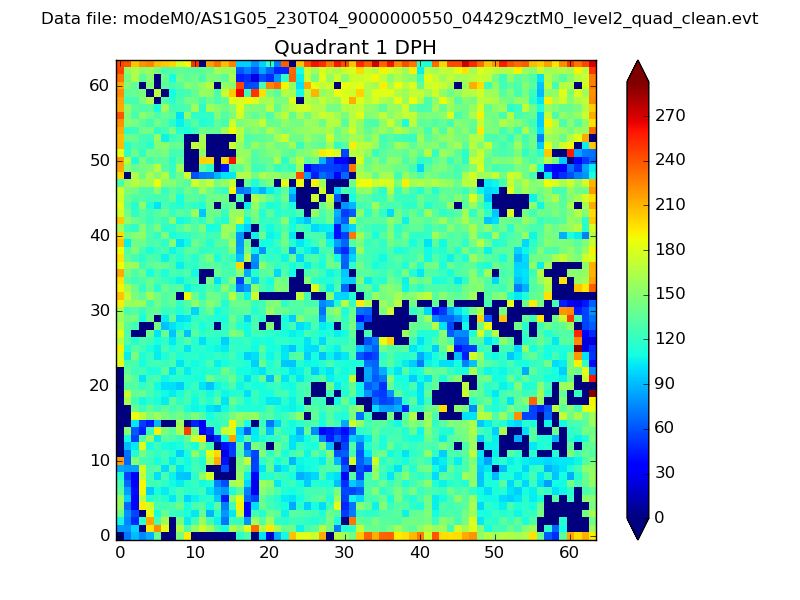 |
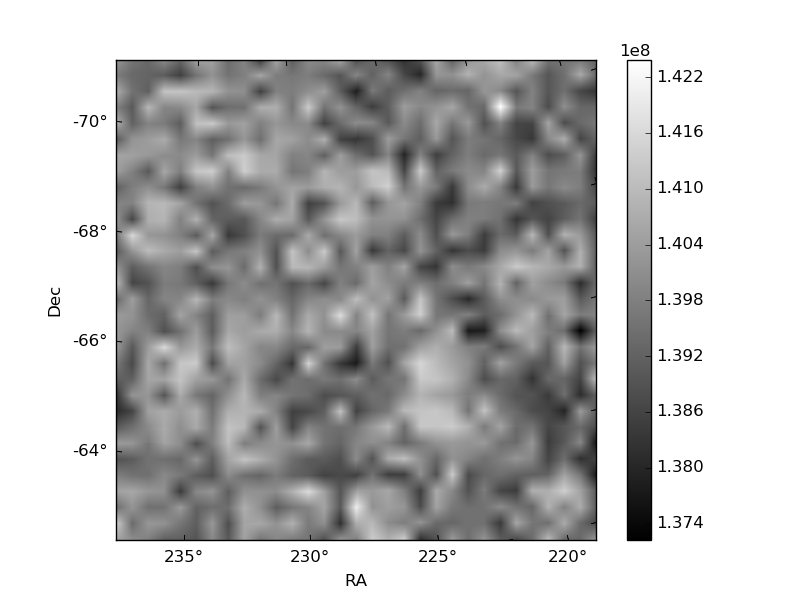
Quadrant B |
|---|---|---|---|
| Quadrant D | 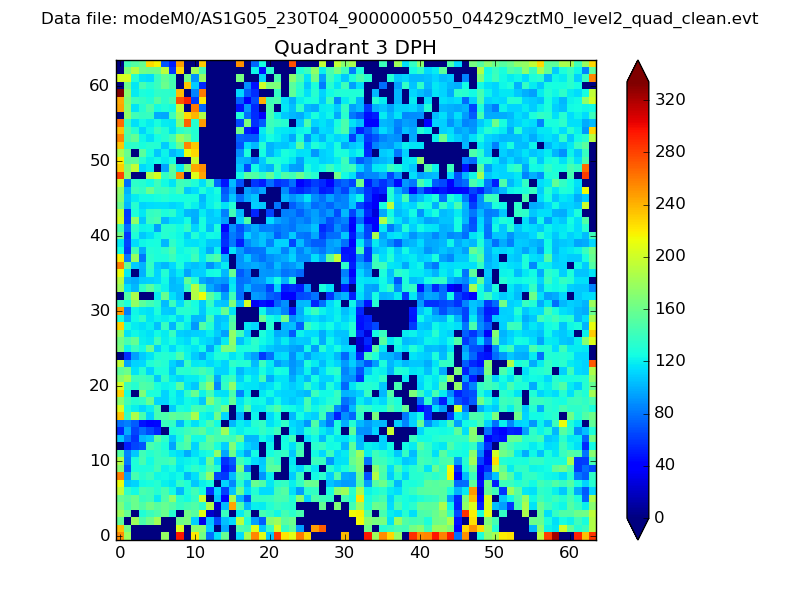 |
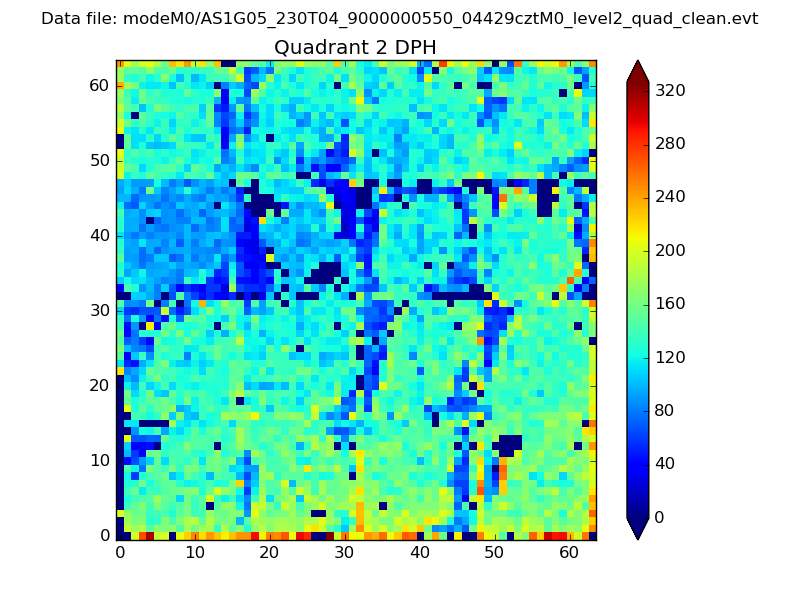 |
Quadrant C |
| Plot type | Count rate plots | Images |
|---|---|---|
| Comparison with Poisson distribution Blue bars denote a histogram of data divided into 1 sec bins. Red curve is a Poisson curve with rate = median count rate of data. |
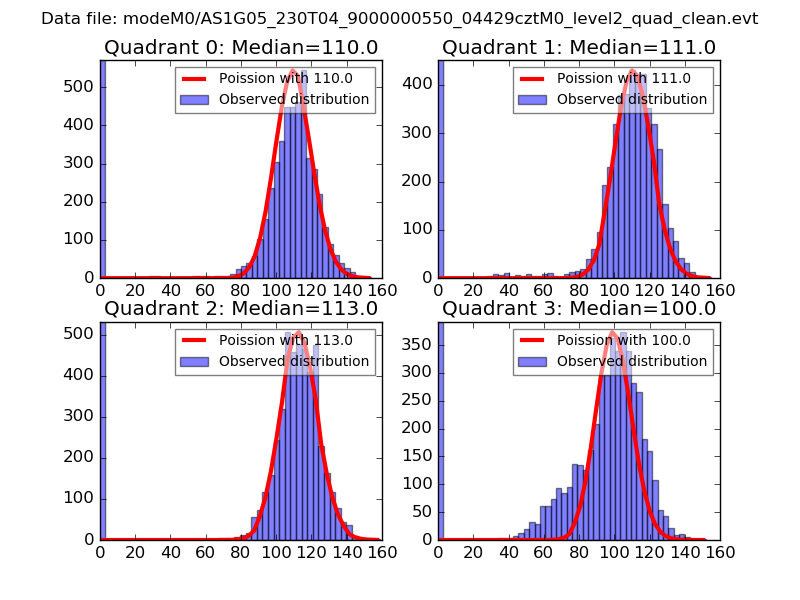 |
 |
| Quadrant-wise count rates Data is divided into 100 sec bins |
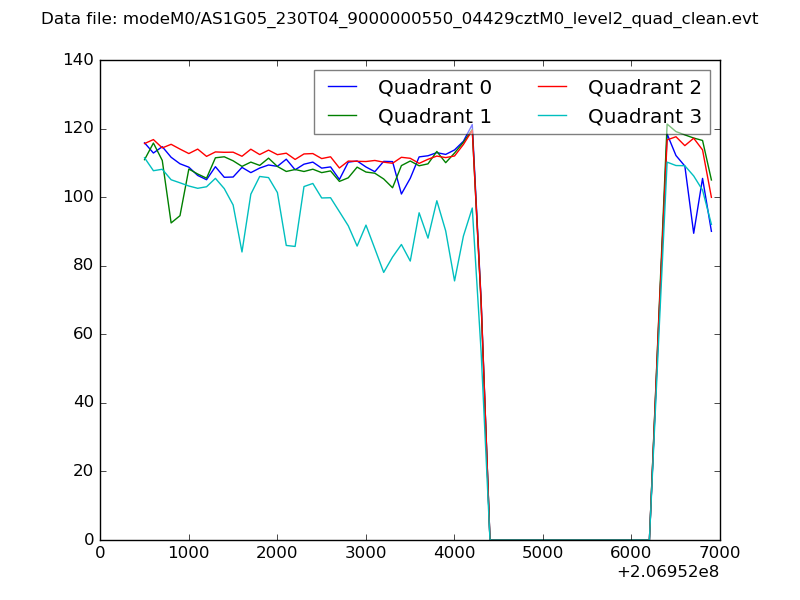 |
|
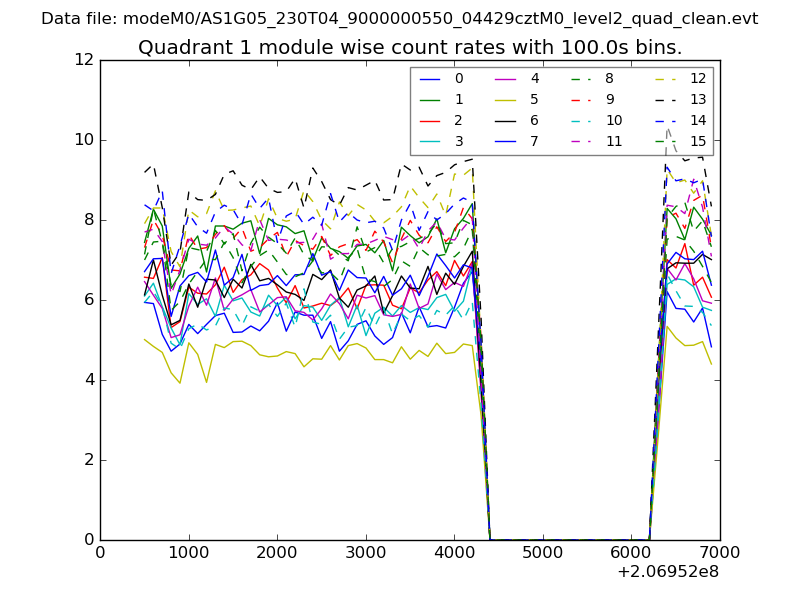
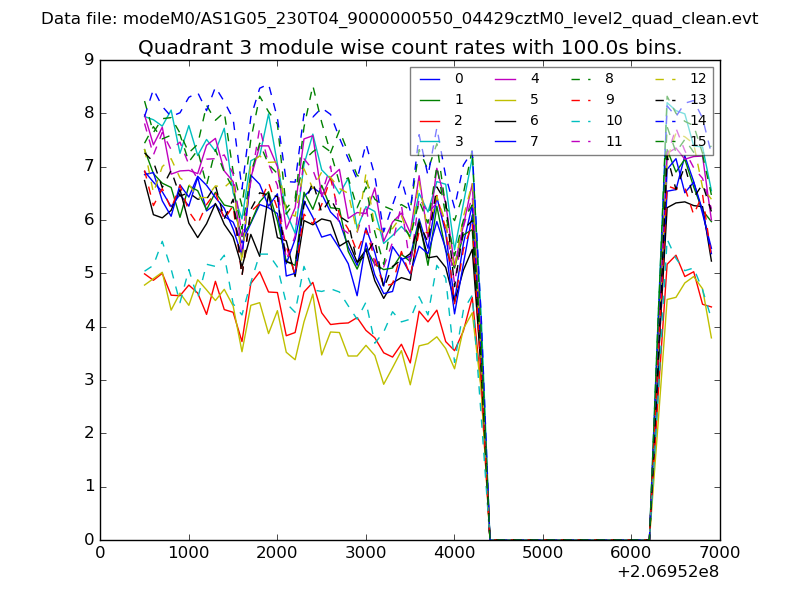
| Module-wise count rates for Quadrant A Data is divided into 100 sec bins |
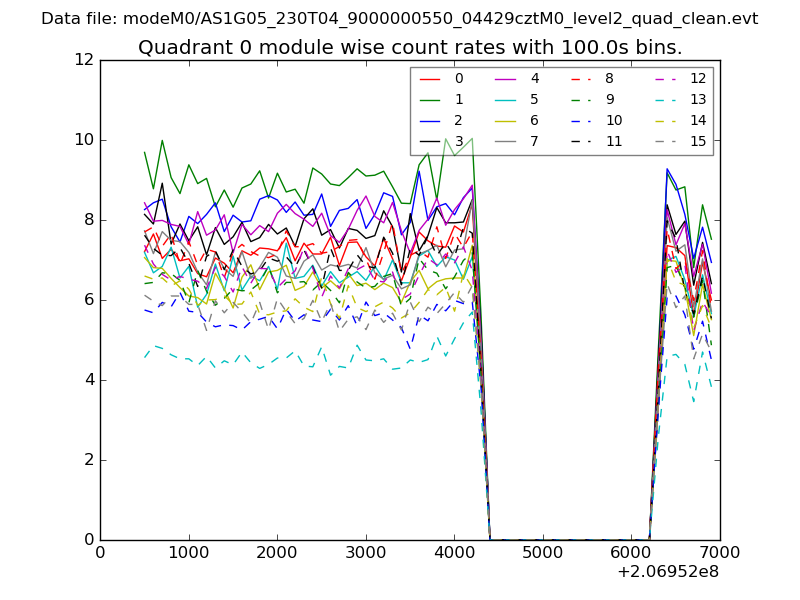 |
 |
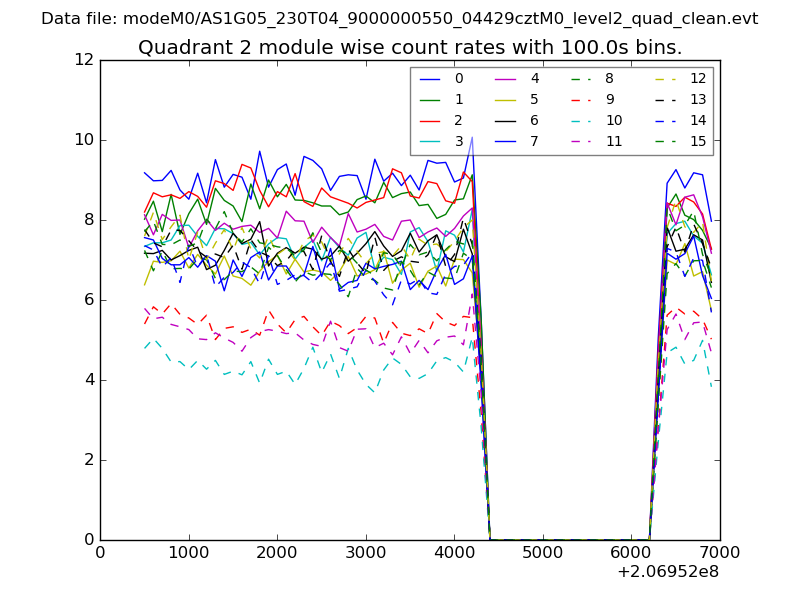
| Module-wise count rates for Quadrant B Data is divided into 100 sec bins |
 |
 |
| Module-wise count rates for Quadrant C Data is divided into 100 sec bins |
 |
 |
| Module-wise count rates for Quadrant D Data is divided into 100 sec bins |
 |
 |
| Parameter | Plot |
|---|---|
| CZT HV Monitor | 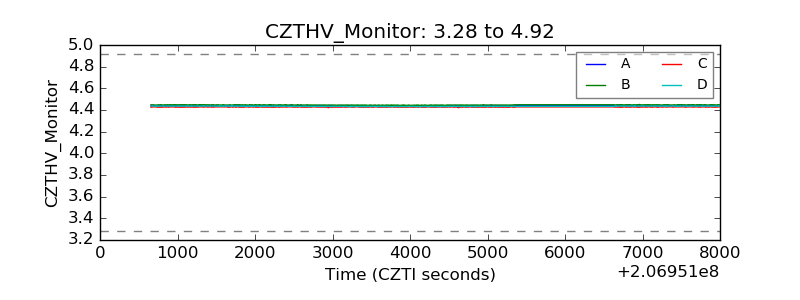 |
| D_VDD | 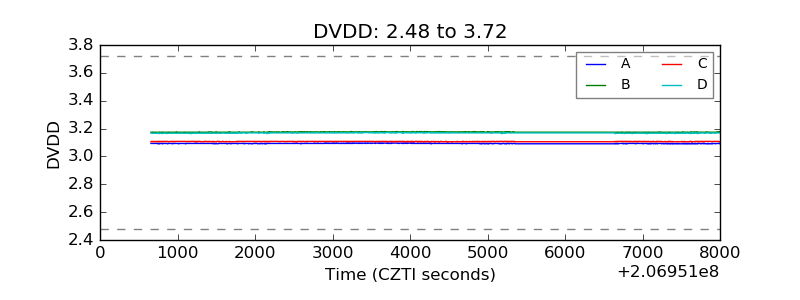 |
| Temperature 1 | 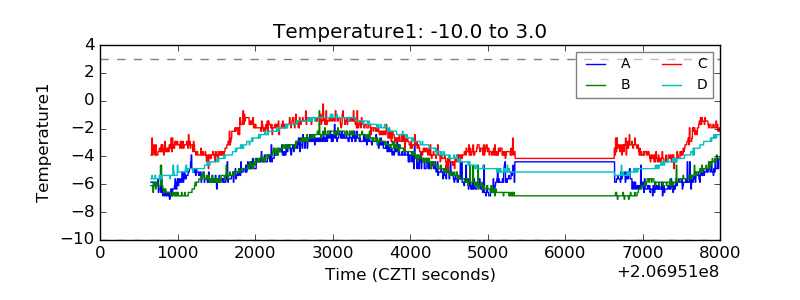 |
| Veto HV Monitor | 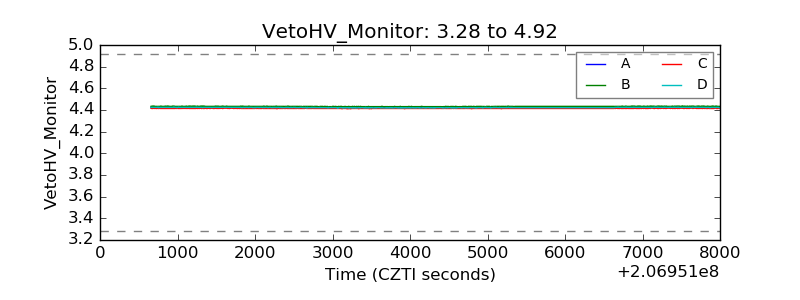 |
| Veto LLD | 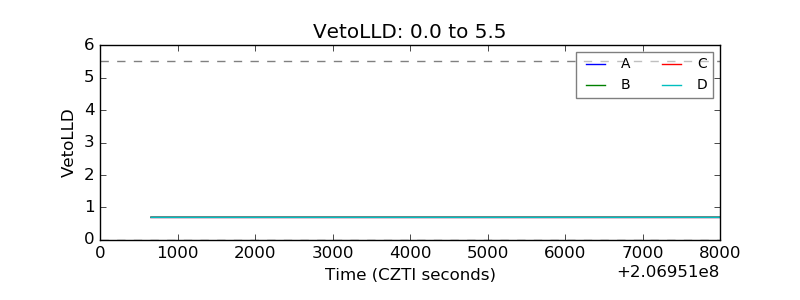 |
| Alpha Counter | 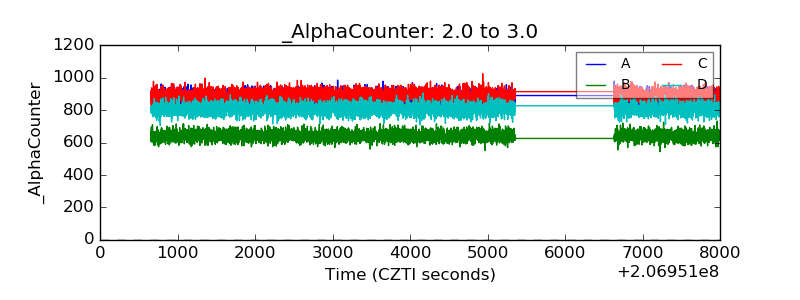 |
| _CPM_Rate | 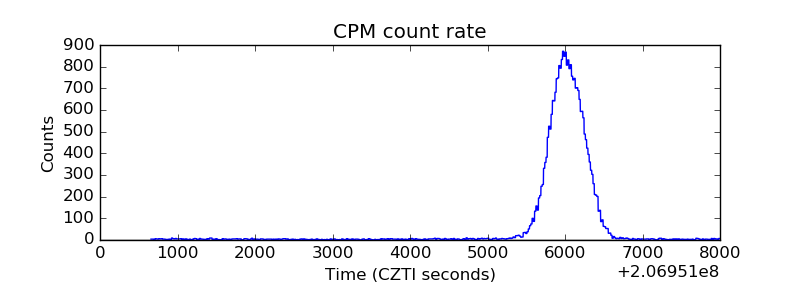 |
| CZT Counter | 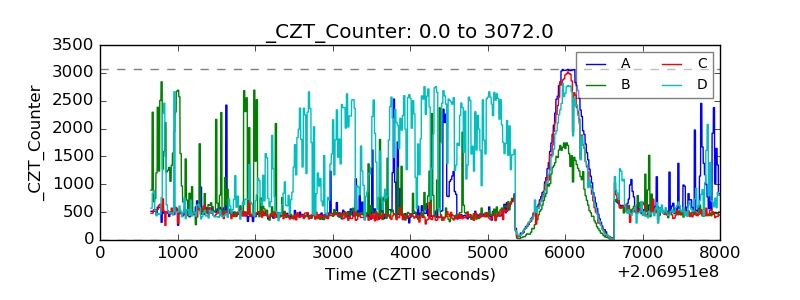 |
| +2.5 Volts monitor |  |
| +5 Volts monitor |  |
| _ROLL_ROT | 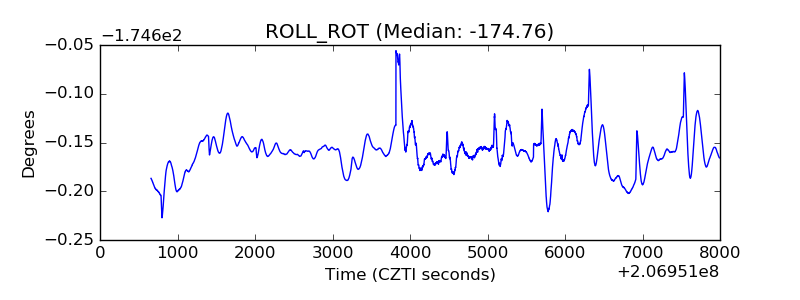 |
| _Roll_DEC | 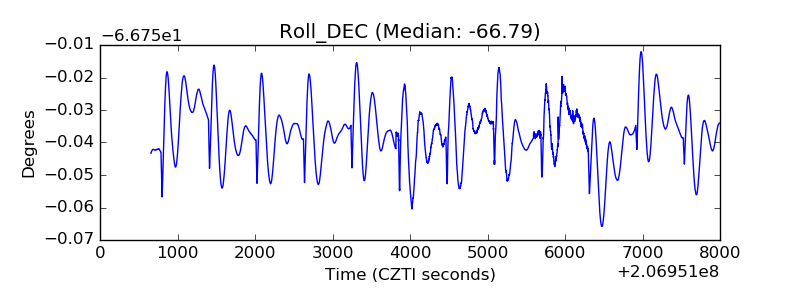 |
| _Roll_RA | 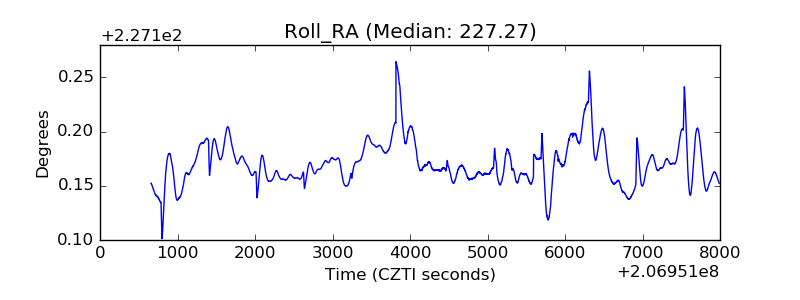 |
| Veto Counter | 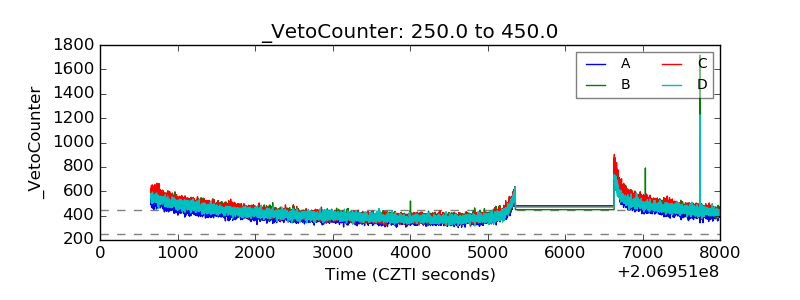 |