| Param | Original file | Final file |
|---|---|---|
| Filename | modeM0/AS1G05_230T04_9000000550_04430cztM0_level2.evt | modeM0/AS1G05_230T04_9000000550_04430cztM0_level2_quad_clean.evt |
| Size (bytes) | 343,889,280 | 44,426,880 |
| Size | 328.0 MB | 42.4 MB |
| Events in quadrant A | 2,090,188 | 293,687 |
| Events in quadrant B | 1,568,401 | 302,171 |
| Events in quadrant C | 1,262,211 | 308,850 |
| Events in quadrant D | 5,296,602 | 233,542 |
| Mode SS | |||
|---|---|---|---|
| Quadrant | BADHDUFLAG | Total packets | Discarded packets |
| A | 0 | 58 | 0 |
| B | 0 | 58 | 0 |
| C | 0 | 58 | 0 |
| D | 0 | 58 | 0 |
| Mode M0 | |||
|---|---|---|---|
| Quadrant | BADHDUFLAG | Total packets | Discarded packets |
| A | 0 | 8143 | 0 |
| B | 0 | 6547 | 0 |
| C | 0 | 5808 | 0 |
| D | 0 | 17678 | 0 |
| Quadrant | Total seconds | Saturated seconds | Saturation percentage |
|---|---|---|---|
| A | 2885 | 150 | 5.199307% |
| B | 2885 | 49 | 1.698440% |
| C | 2885 | 2 | 0.069324% |
| D | 2885 | 1610 | 55.805893% |
Noise dominated data is calculated using 1-second bins in cleaned event files. If a bin has >2000 counts, and if more than 50% of those come from <1% of pixels, then it is considered to be noise-dominated and hence unusable.
| Quadrant | # 1 sec bins | Bins with >0 counts | Bins with >2000 counts | High rate bins dominated by noise | Noise dominated (total time) | Noise dominated (detector-on time) | Marked lightcurve |
|---|---|---|---|---|---|---|---|
| A | 2885 | 2885 | 94 | 94 | 3.26% | 3.26% | 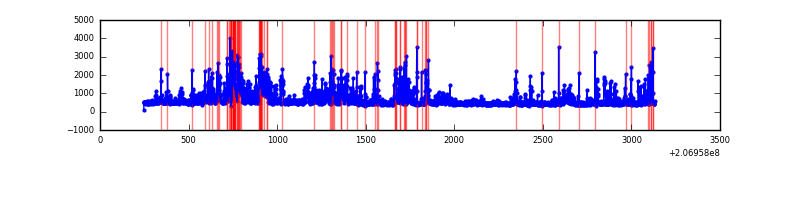 |
| B | 2885 | 2885 | 35 | 35 | 1.21% | 1.21% | 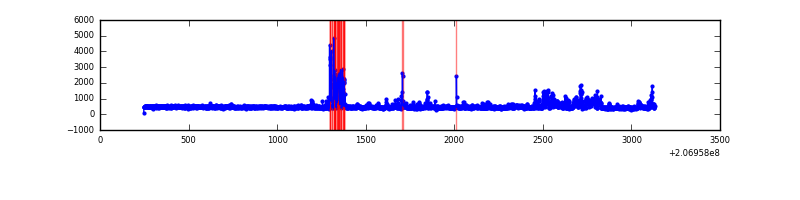 |
| C | 2885 | 2885 | 2 | 2 | 0.07% | 0.07% | 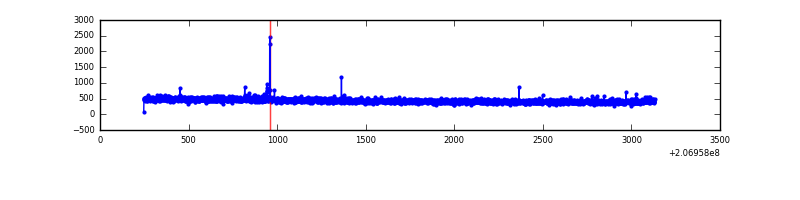 |
| D | 2885 | 2885 | 1677 | 1677 | 58.13% | 58.13% | 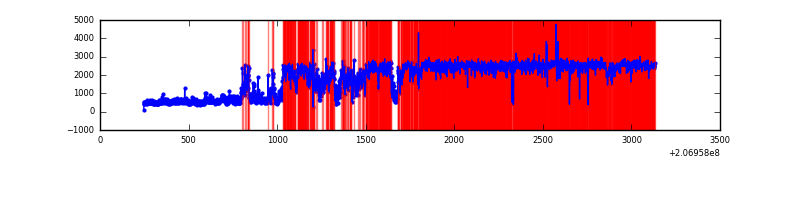 |
Top three noisy pixels from each quadrant. If the there are fewer than three noisy pixels in the level2.evt file, extra rows are filled as -1
| Pixel properties | Quadrant properties | ||||||
|---|---|---|---|---|---|---|---|
| Quadrant | DetID | PixID | Counts | Sigma | Mean | Median | Sigma |
| A | 0 | 13 | 830291 | 12392.9 | 322 | 316 | 67.0 |
| A | 0 | 118 | 9975 | 144.22 | 322 | 316 | 67.0 |
| A | 8 | 15 | 8213 | 117.92 | 322 | 316 | 67.0 |
| B | 14 | 167 | 166896 | 2644.15 | 325 | 319 | 63.0 |
| B | 8 | 3 | 82137 | 1298.73 | 325 | 319 | 63.0 |
| B | 15 | 204 | 24021 | 376.23 | 325 | 319 | 63.0 |
| C | 9 | 247 | 12142 | 158.61 | 319 | 320 | 74.5 |
| C | 12 | 4 | 4113 | 50.89 | 319 | 320 | 74.5 |
| C | 13 | 61 | 2675 | 31.6 | 319 | 320 | 74.5 |
| D | 13 | 114 | 3684190 | 54963.68 | 277 | 270 | 67.0 |
| D | 13 | 53 | 347042 | 5173.8 | 277 | 270 | 67.0 |
| D | 7 | 6 | 70822 | 1052.63 | 277 | 270 | 67.0 |
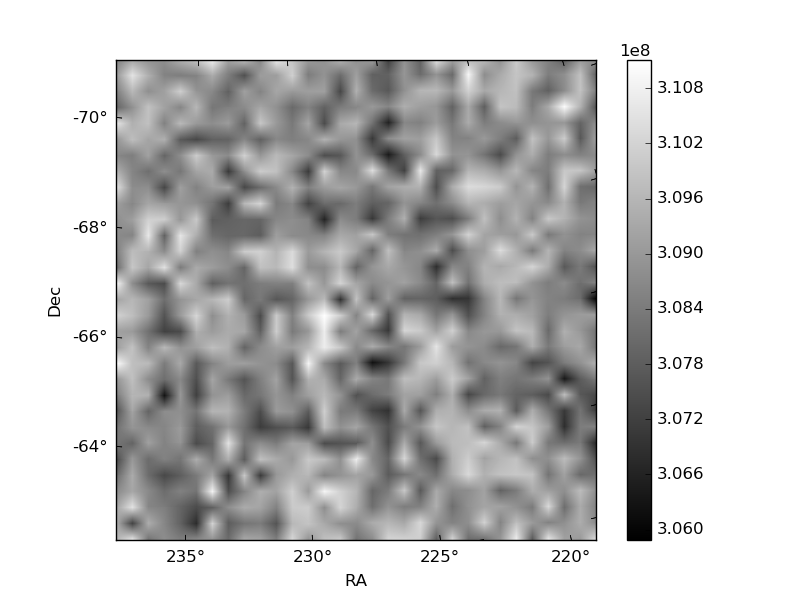
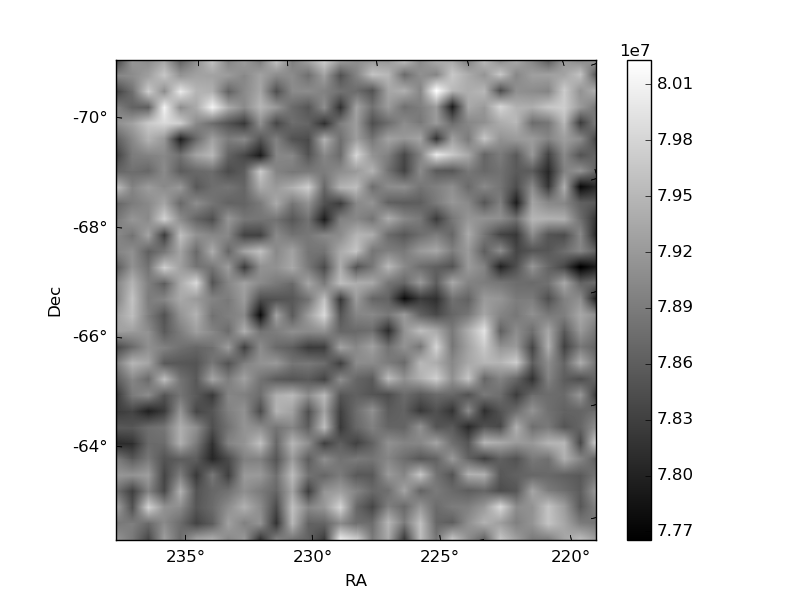
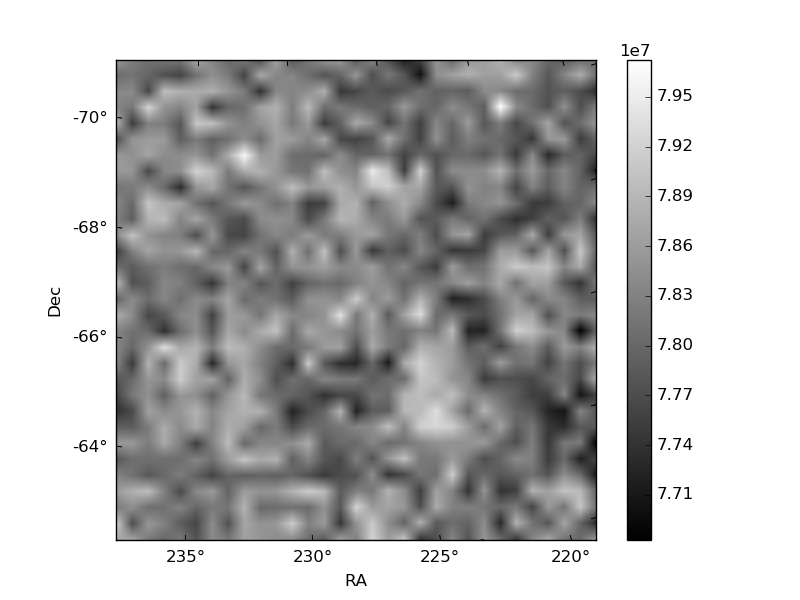
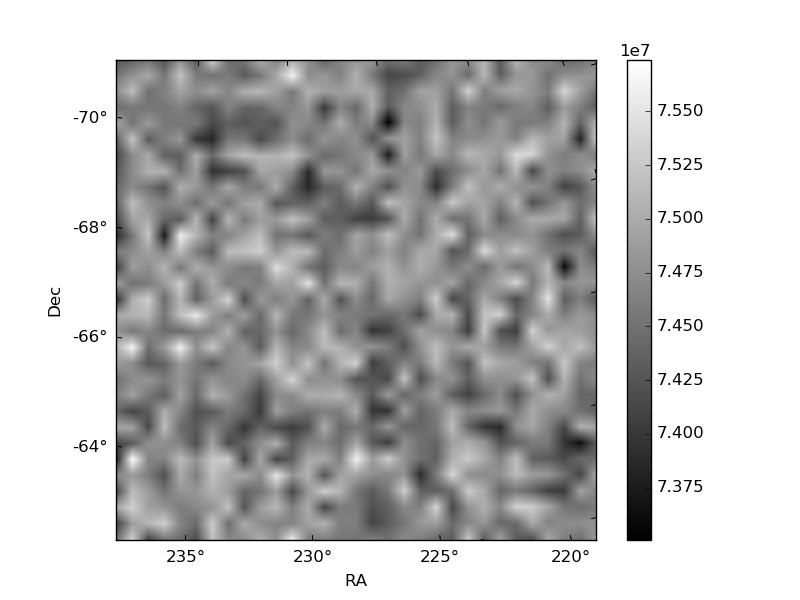
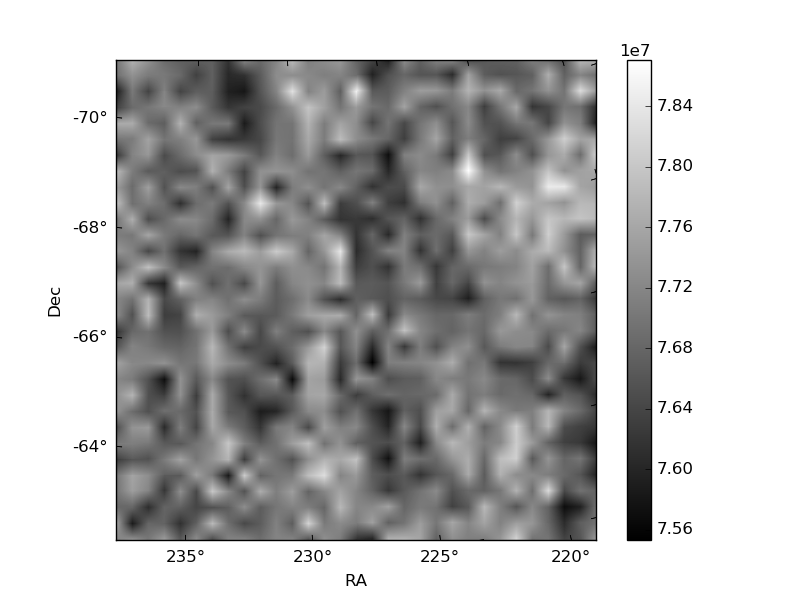
Histogram calculated using DETX and DETY for each event in the final _common_clean file
| Quadrant A | 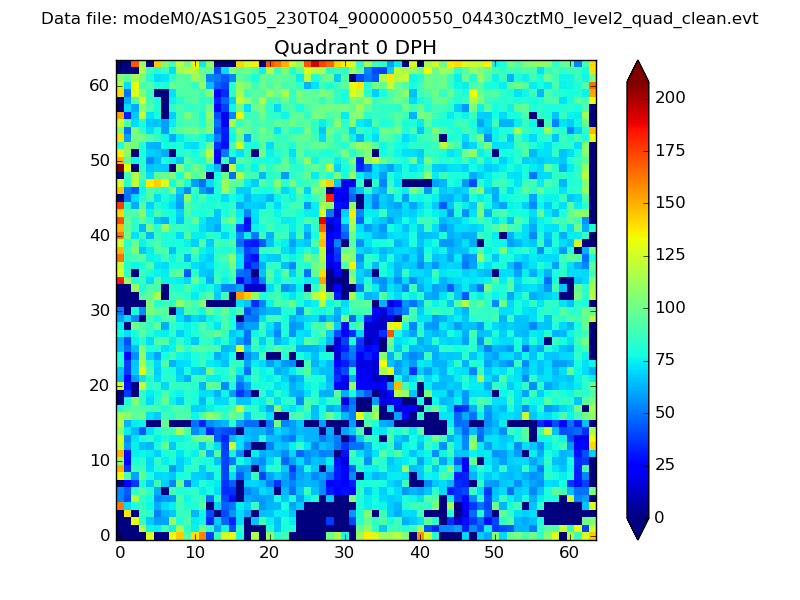 |
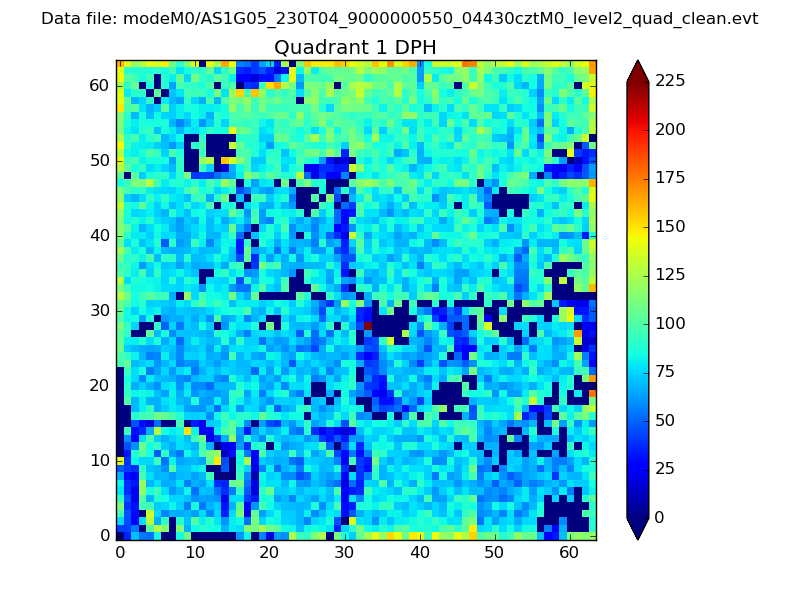 |
Quadrant B |
|---|---|---|---|
| Quadrant D | 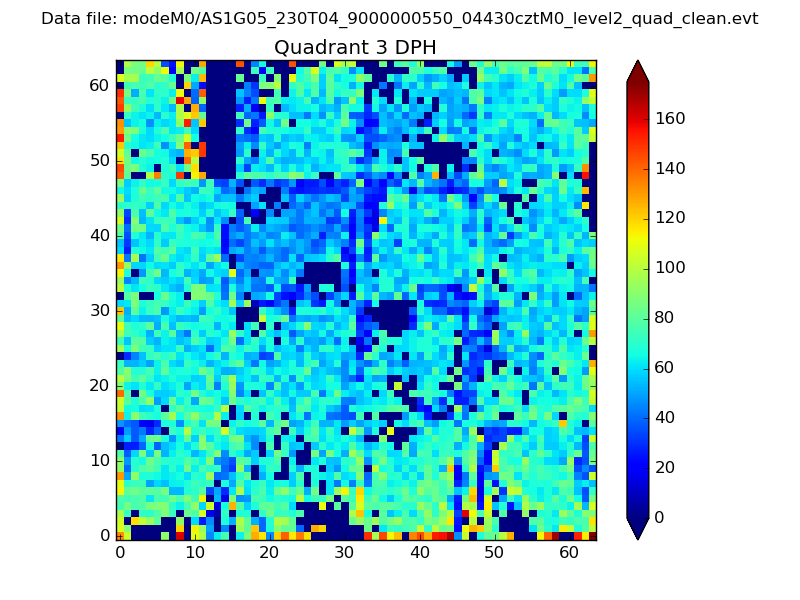 |
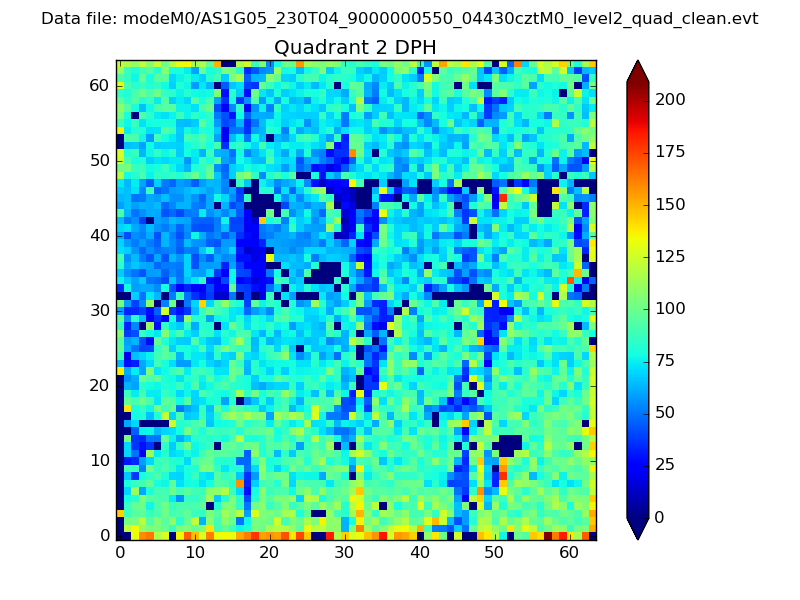 |
Quadrant C |
| Plot type | Count rate plots | Images |
|---|---|---|
| Comparison with Poisson distribution Blue bars denote a histogram of data divided into 1 sec bins. Red curve is a Poisson curve with rate = median count rate of data. |
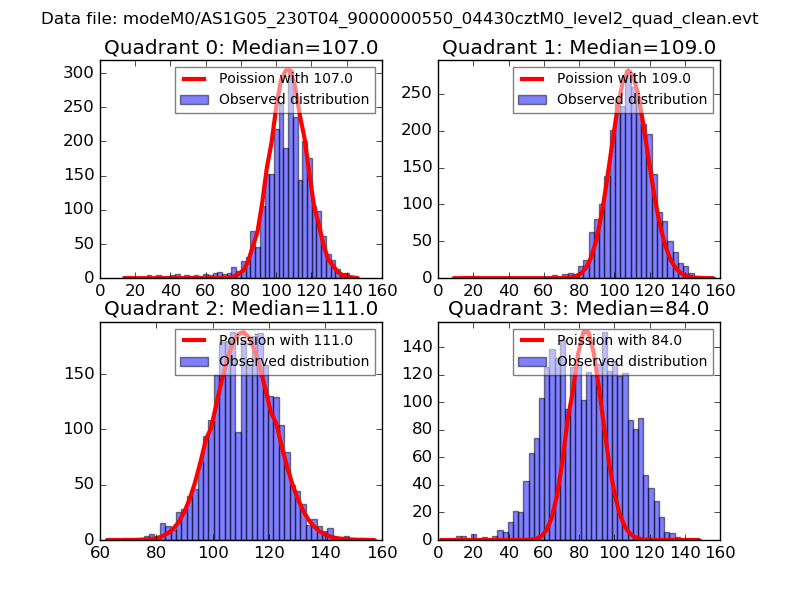 |
 |
| Quadrant-wise count rates Data is divided into 100 sec bins |
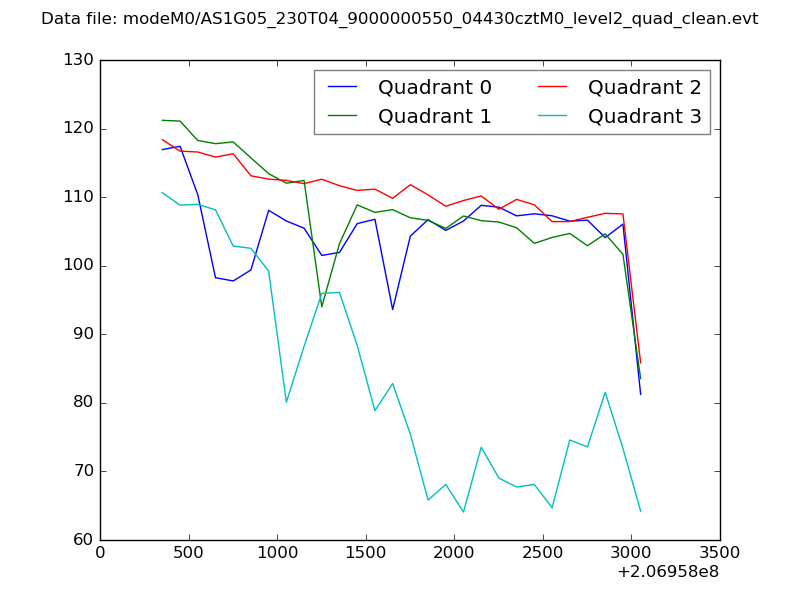 |
|
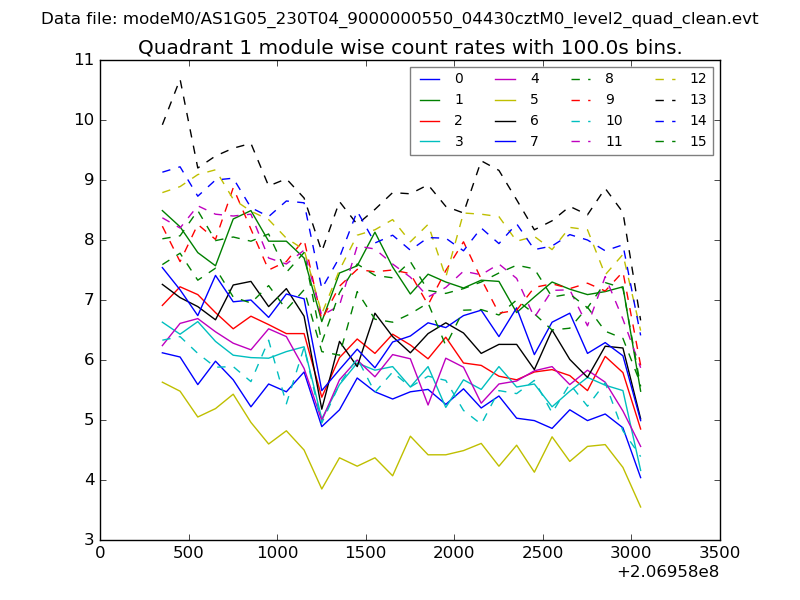
| Module-wise count rates for Quadrant A Data is divided into 100 sec bins |
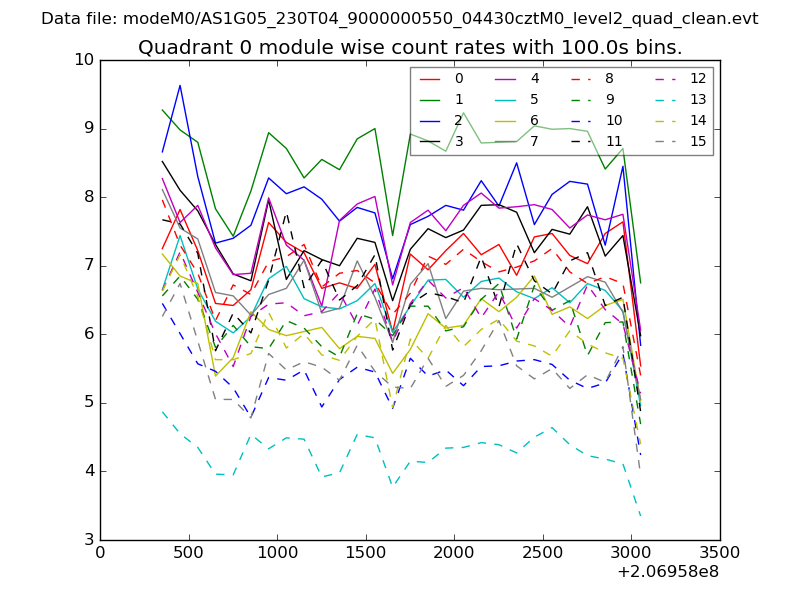 |
 |
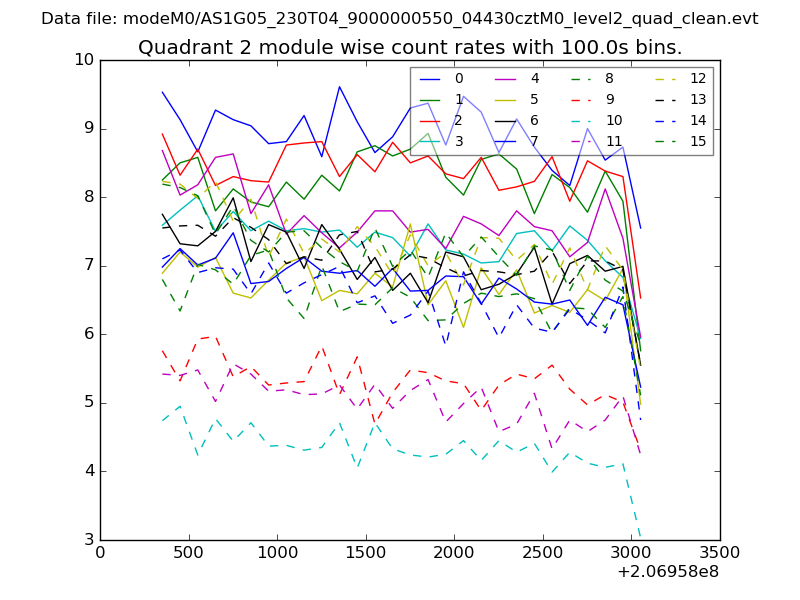
| Module-wise count rates for Quadrant B Data is divided into 100 sec bins |
 |
 |
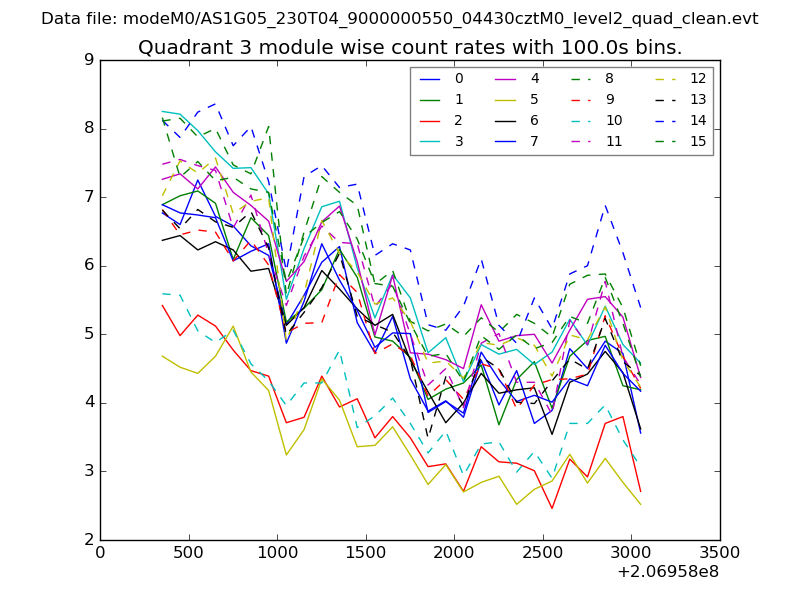
| Module-wise count rates for Quadrant C Data is divided into 100 sec bins |
 |
 |
| Module-wise count rates for Quadrant D Data is divided into 100 sec bins |
 |
 |
| Parameter | Plot |
|---|---|
| CZT HV Monitor | 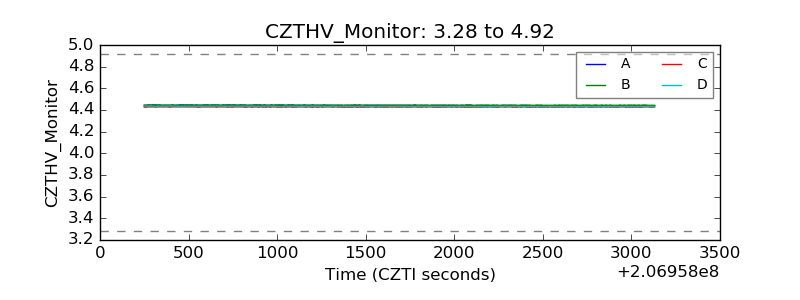 |
| D_VDD | 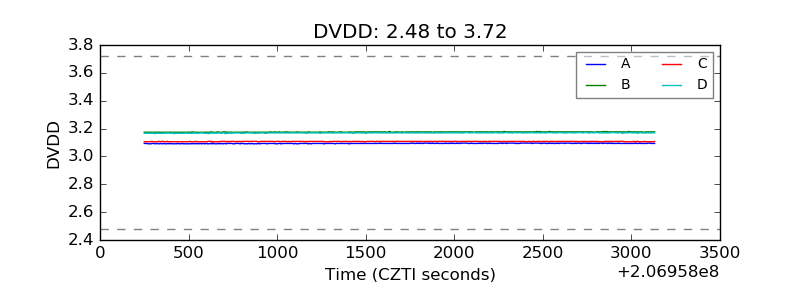 |
| Temperature 1 | 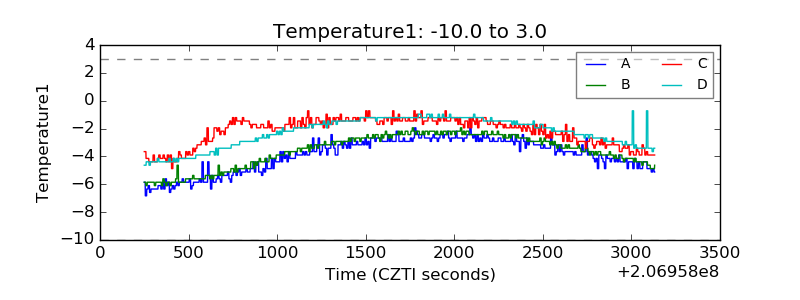 |
| Veto HV Monitor | 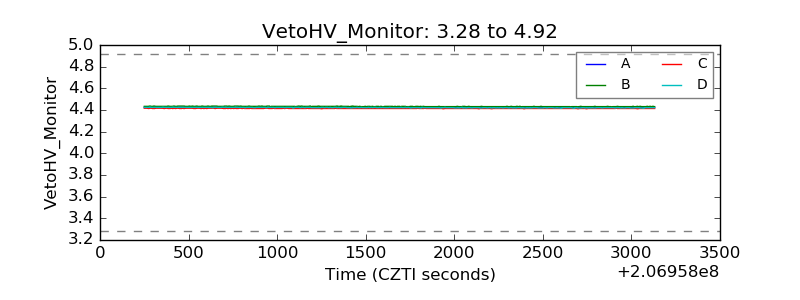 |
| Veto LLD | 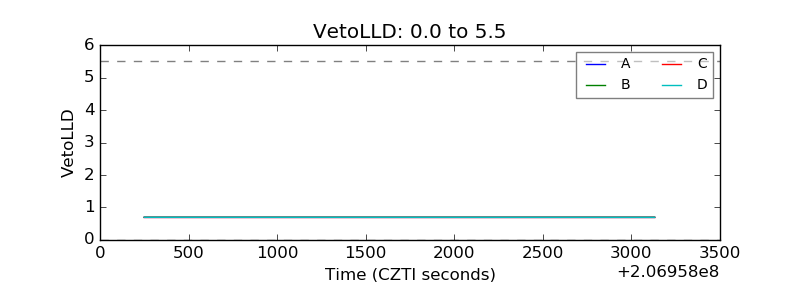 |
| Alpha Counter | 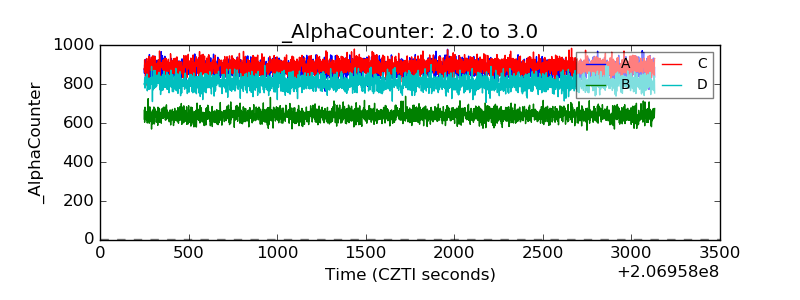 |
| _CPM_Rate | 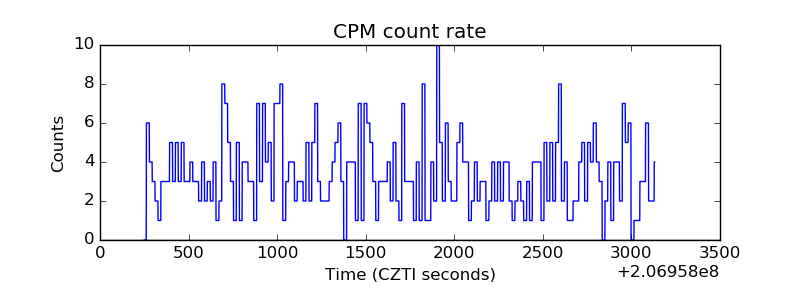 |
| CZT Counter | 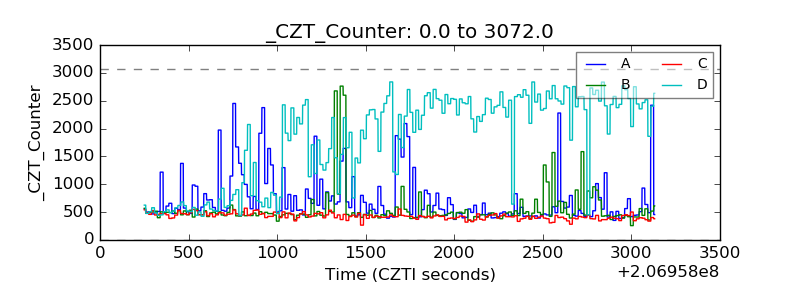 |
| +2.5 Volts monitor | 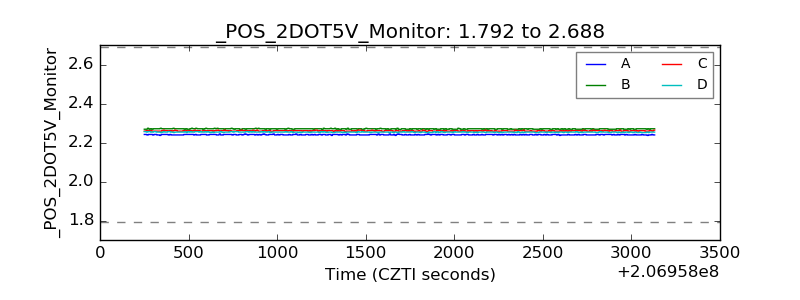 |
| +5 Volts monitor |  |
| _ROLL_ROT | 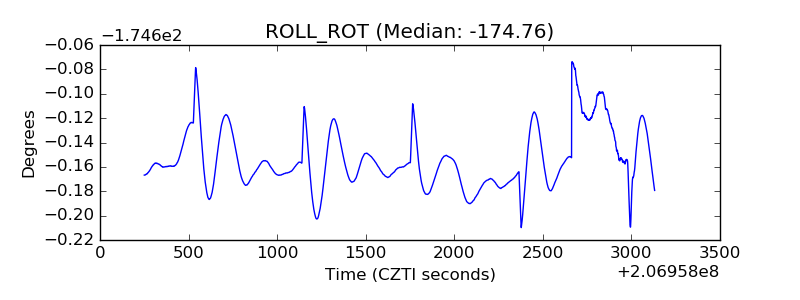 |
| _Roll_DEC | 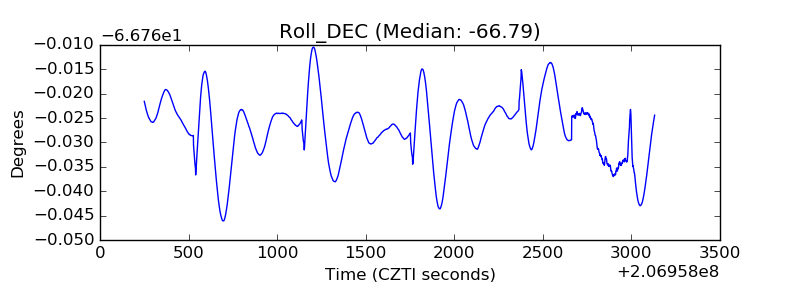 |
| _Roll_RA | 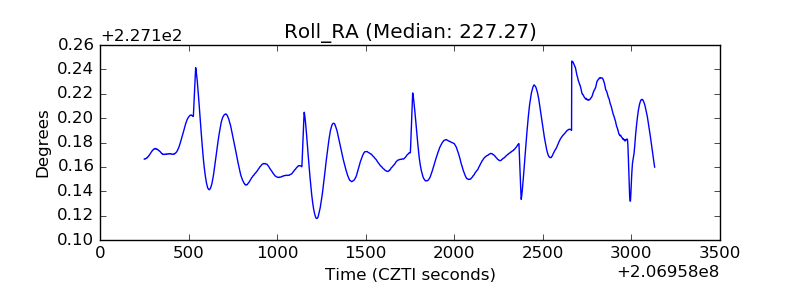 |
| Veto Counter | 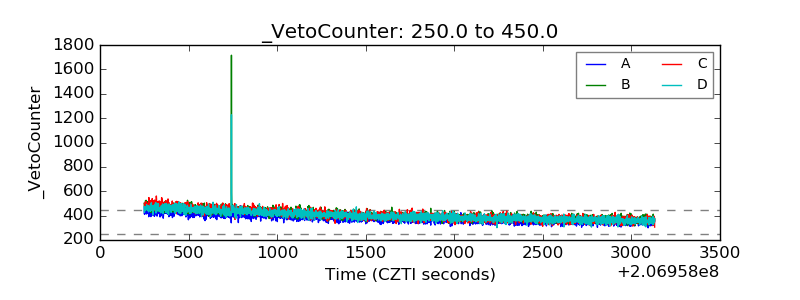 |