| Param | Original file | Final file |
|---|---|---|
| Filename | modeM0/AS1G05_214T01_9000000552cztM0_level2.fits | modeM0/AS1G05_214T01_9000000552cztM0_level2_quad_clean.evt |
| Size (bytes) | 420,837,120 | 421,231,680 |
| Size | 401.3 MB | 401.7 MB |
| Events in quadrant A | 2,507,360 | 2,464,251 |
| Events in quadrant B | 2,433,582 | 2,507,828 |
| Events in quadrant C | 2,499,354 | 2,438,508 |
| Events in quadrant D | 2,124,136 | 2,167,587 |
| Mode SS | |||
|---|---|---|---|
| Quadrant | BADHDUFLAG | Total packets | Discarded packets |
| A | 0 | 946 | 0 |
| B | 0 | 946 | 0 |
| C | 0 | 946 | 0 |
| D | 0 | 946 | 0 |
| Mode M0 | |||
|---|---|---|---|
| Quadrant | BADHDUFLAG | Total packets | Discarded packets |
| A | 0 | 98678 | 0 |
| B | 0 | 102274 | 0 |
| C | 0 | 99428 | 0 |
| D | 0 | 111623 | 0 |
| Mode M9 | |||
|---|---|---|---|
| Quadrant | BADHDUFLAG | Total packets | Discarded packets |
| A | 0 | 52 | 0 |
| B | 0 | 52 | 0 |
| C | 0 | 52 | 0 |
| D | 0 | 52 | 0 |
| Quadrant | Total seconds | Saturated seconds | Saturation percentage |
|---|---|---|---|
| A | 46316 | 1269 | 2.739874% |
| B | 46316 | 1449 | 3.128509% |
| C | 46316 | 1029 | 2.221694% |
| D | 46292 | 1787 | 3.860278% |
Noise dominated data is calculated using 1-second bins in cleaned event files. If a bin has >2000 counts, and if more than 50% of those come from <1% of pixels, then it is considered to be noise-dominated and hence unusable.
| Quadrant | # 1 sec bins | Bins with >0 counts | Bins with >2000 counts | High rate bins dominated by noise | Noise dominated (total time) | Noise dominated (detector-on time) | Marked lightcurve |
|---|---|---|---|---|---|---|---|
| A | 50831 | 46317 | 0 | 0 | 0.00% | 0.00% |  |
| B | 50831 | 46317 | 0 | 0 | 0.00% | 0.00% |  |
| C | 50831 | 46315 | 0 | 0 | 0.00% | 0.00% |  |
| D | 50831 | 46293 | 0 | 0 | 0.00% | 0.00% |  |
Top three noisy pixels from each quadrant. If the there are fewer than three noisy pixels in the level2.evt file, extra rows are filled as -1
| Pixel properties | Quadrant properties | ||||||
|---|---|---|---|---|---|---|---|
| Quadrant | DetID | PixID | Counts | Sigma | Mean | Median | Sigma |
| A | 14 | 188 | 2326 | 10.16 | 649 | 601 | 169.8 |
| A | 7 | 110 | 2111 | 8.89 | 649 | 601 | 169.8 |
| A | 14 | 204 | 2050 | 8.53 | 649 | 601 | 169.8 |
| B | 2 | 9 | 1984 | 10.44 | 639 | 604 | 132.2 |
| B | 14 | 254 | 1827 | 9.25 | 639 | 604 | 132.2 |
| B | 12 | 226 | 1690 | 8.21 | 639 | 604 | 132.2 |
| C | 1 | 81 | 1851 | 6.89 | 660 | 607 | 180.6 |
| C | 1 | 80 | 1823 | 6.73 | 660 | 607 | 180.6 |
| C | 12 | 241 | 1775 | 6.47 | 660 | 607 | 180.6 |
| D | 11 | 82 | 1768 | 7.46 | 605 | 547 | 163.6 |
| D | 3 | 14 | 1573 | 6.27 | 605 | 547 | 163.6 |
| D | 1 | 19 | 1561 | 6.2 | 605 | 547 | 163.6 |
Histogram calculated using DETX and DETY for each event in the final _common_clean file
| Quadrant A |  |
 |
Quadrant B |
|---|---|---|---|
| Quadrant D | 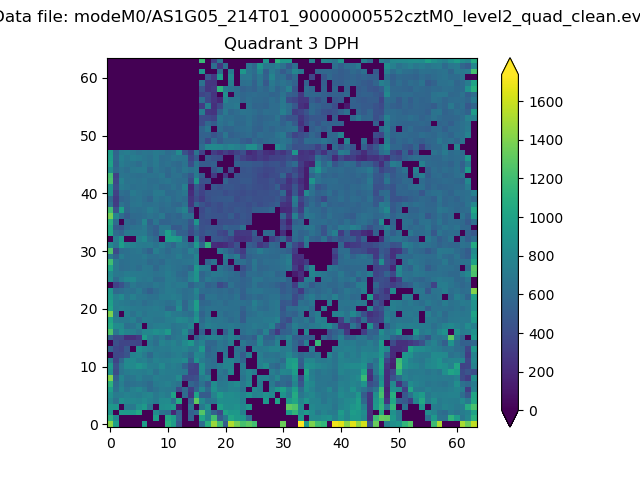 |
 |
Quadrant C |
| Plot type | Count rate plots | Images |
|---|---|---|
| Comparison with Poisson distribution Blue bars denote a histogram of data divided into 1 sec bins. Red curve is a Poisson curve with rate = median count rate of data. |
 |
 |
| Quadrant-wise count rates Data is divided into 100 sec bins |
 |
|
| Module-wise count rates for Quadrant A Data is divided into 100 sec bins |
 |
 |
| Module-wise count rates for Quadrant B Data is divided into 100 sec bins |
 |
 |
| Module-wise count rates for Quadrant C Data is divided into 100 sec bins |
 |
 |
| Module-wise count rates for Quadrant D Data is divided into 100 sec bins |
 |
 |
| Parameter | Plot |
|---|---|
| CZT HV Monitor |  |
| D_VDD |  |
| Temperature 1 |  |
| Veto HV Monitor | 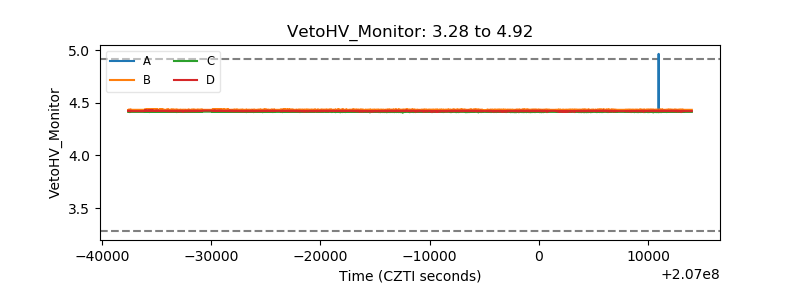 |
| Veto LLD |  |
| Alpha Counter |  |
| _CPM_Rate |  |
| CZT Counter |  |
| +2.5 Volts monitor |  |
| +5 Volts monitor |  |
| _ROLL_ROT |  |
| _Roll_DEC |  |
| _Roll_RA |  |
| Veto Counter |  |