| Param | Original file | Final file |
|---|---|---|
| Filename | modeM0/AS1G05_214T01_9000000552_04433cztM0_level2.evt | modeM0/AS1G05_214T01_9000000552_04433cztM0_level2_quad_clean.evt |
| Size (bytes) | 534,591,360 | 78,528,960 |
| Size | 509.8 MB | 74.9 MB |
| Events in quadrant A | 3,722,671 | 463,165 |
| Events in quadrant B | 4,044,715 | 472,616 |
| Events in quadrant C | 3,494,767 | 471,144 |
| Events in quadrant D | 4,416,843 | 447,242 |
| Mode SS | |||
|---|---|---|---|
| Quadrant | BADHDUFLAG | Total packets | Discarded packets |
| A | 0 | 152 | 0 |
| B | 0 | 152 | 0 |
| C | 0 | 152 | 0 |
| D | 0 | 152 | 0 |
| Mode M0 | |||
|---|---|---|---|
| Quadrant | BADHDUFLAG | Total packets | Discarded packets |
| A | 0 | 16206 | 3 |
| B | 0 | 16907 | 2 |
| C | 0 | 15593 | 2 |
| D | 0 | 18262 | 2 |
| Mode M9 | |||
|---|---|---|---|
| Quadrant | BADHDUFLAG | Total packets | Discarded packets |
| A | 0 | 1 | 0 |
| B | 0 | 1 | 0 |
| C | 0 | 1 | 0 |
| D | 0 | 1 | 0 |
| Quadrant | Total seconds | Saturated seconds | Saturation percentage |
|---|---|---|---|
| A | 7528 | 258 | 3.427205% |
| B | 7528 | 285 | 3.785866% |
| C | 7528 | 205 | 2.723167% |
| D | 7528 | 420 | 5.579171% |
Noise dominated data is calculated using 1-second bins in cleaned event files. If a bin has >2000 counts, and if more than 50% of those come from <1% of pixels, then it is considered to be noise-dominated and hence unusable.
| Quadrant | # 1 sec bins | Bins with >0 counts | Bins with >2000 counts | High rate bins dominated by noise | Noise dominated (total time) | Noise dominated (detector-on time) | Marked lightcurve |
|---|---|---|---|---|---|---|---|
| A | 7628 | 7530 | 6 | 6 | 0.08% | 0.08% | 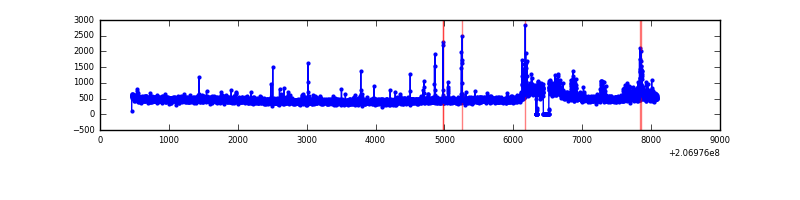 |
| B | 7628 | 7530 | 34 | 34 | 0.45% | 0.45% | 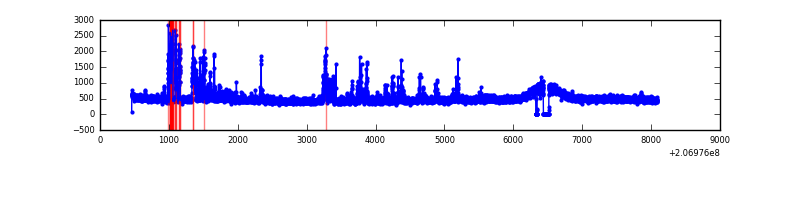 |
| C | 7628 | 7530 | 0 | 0 | 0.00% | 0.00% | 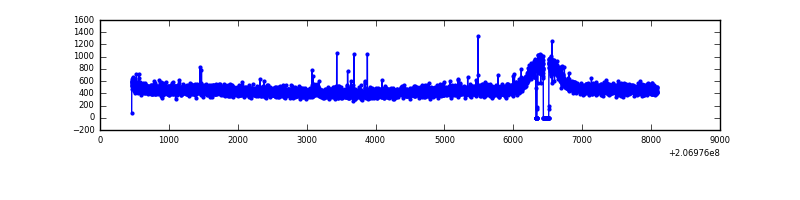 |
| D | 7628 | 7530 | 153 | 153 | 2.01% | 2.03% | 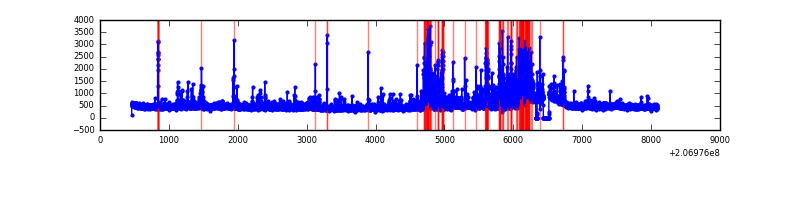 |
Top three noisy pixels from each quadrant. If the there are fewer than three noisy pixels in the level2.evt file, extra rows are filled as -1
| Pixel properties | Quadrant properties | ||||||
|---|---|---|---|---|---|---|---|
| Quadrant | DetID | PixID | Counts | Sigma | Mean | Median | Sigma |
| A | 0 | 13 | 240234 | 1278.6 | 904 | 881 | 187.2 |
| A | 12 | 194 | 9138 | 44.11 | 904 | 881 | 187.2 |
| A | 0 | 226 | 8944 | 43.07 | 904 | 881 | 187.2 |
| B | 14 | 167 | 466618 | 2631.13 | 912 | 890 | 177.0 |
| B | 12 | 111 | 17089 | 91.52 | 912 | 890 | 177.0 |
| B | 0 | 228 | 13868 | 73.32 | 912 | 890 | 177.0 |
| C | 9 | 247 | 14449 | 64.9 | 888 | 891 | 208.9 |
| C | 13 | 61 | 7328 | 30.81 | 888 | 891 | 208.9 |
| C | 12 | 4 | 5022 | 19.78 | 888 | 891 | 208.9 |
| D | 12 | 233 | 764213 | 3310.71 | 858 | 839 | 230.6 |
| D | 2 | 63 | 144976 | 625.11 | 858 | 839 | 230.6 |
| D | 13 | 239 | 108255 | 465.86 | 858 | 839 | 230.6 |
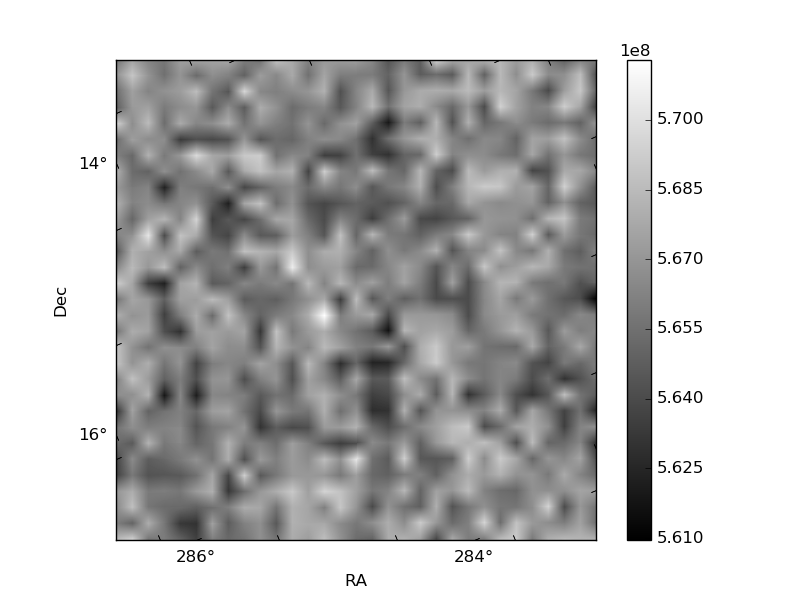
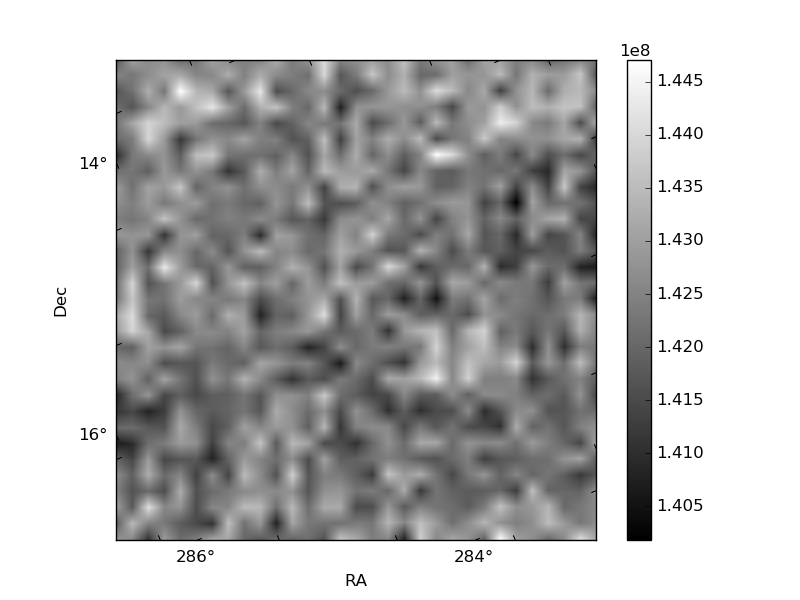
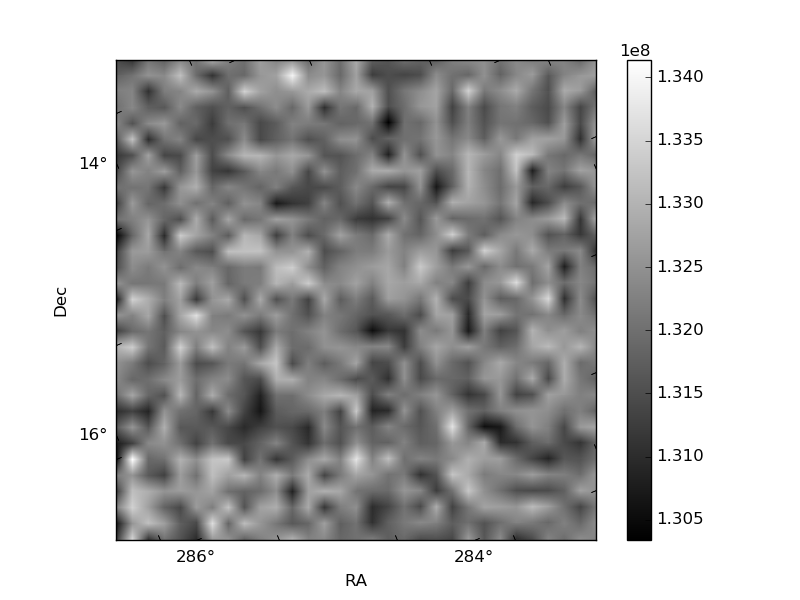
Histogram calculated using DETX and DETY for each event in the final _common_clean file
| Quadrant A | 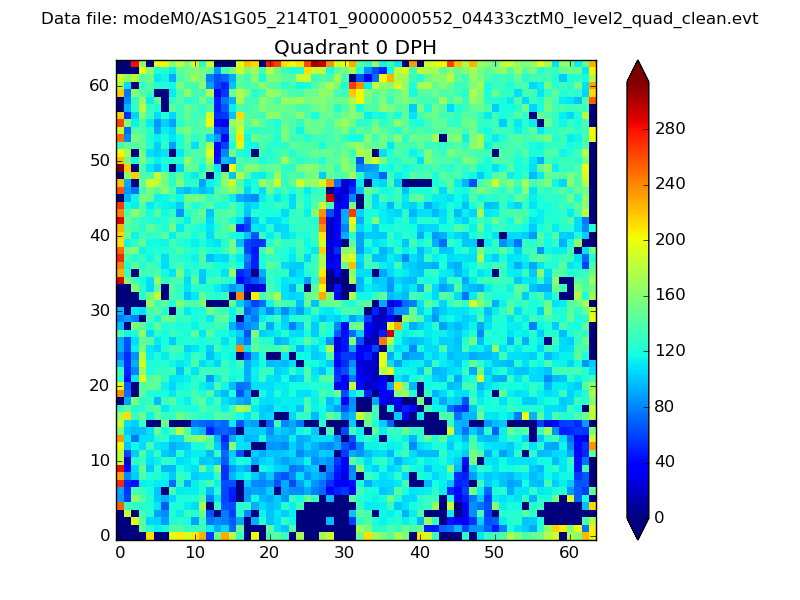 |
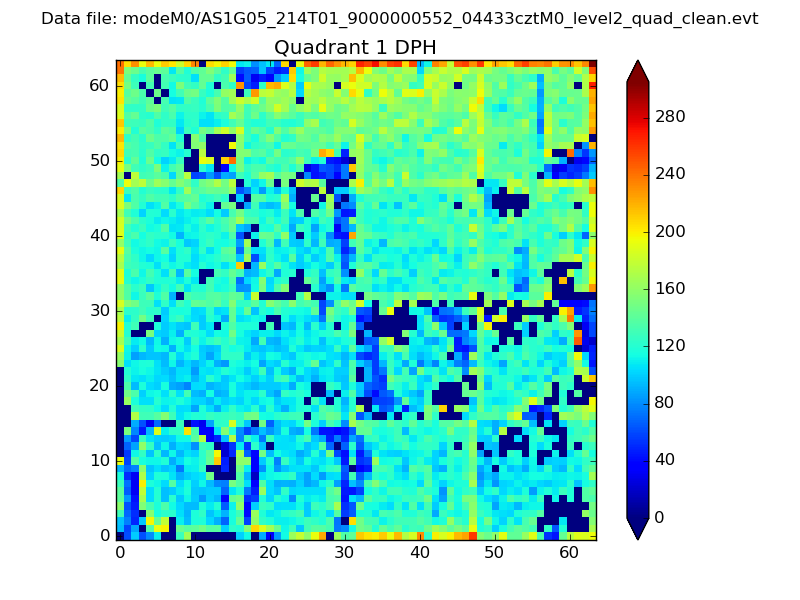 |
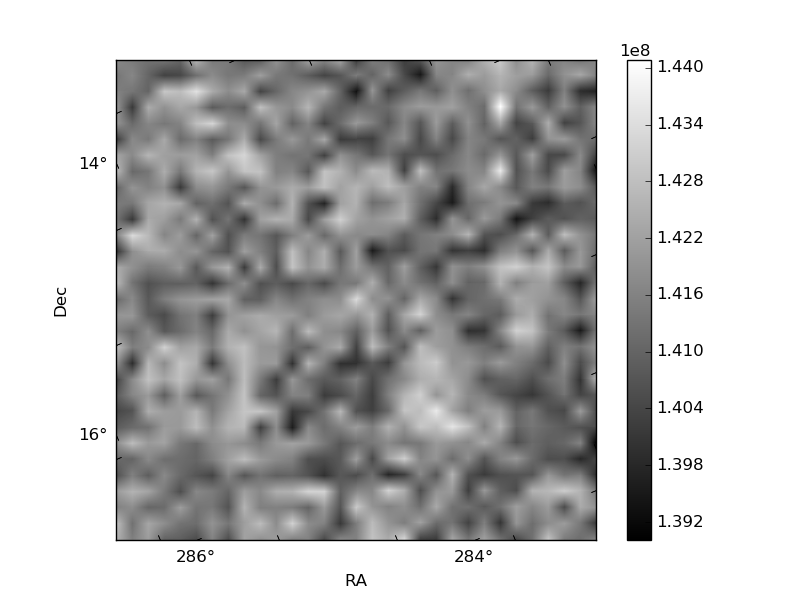
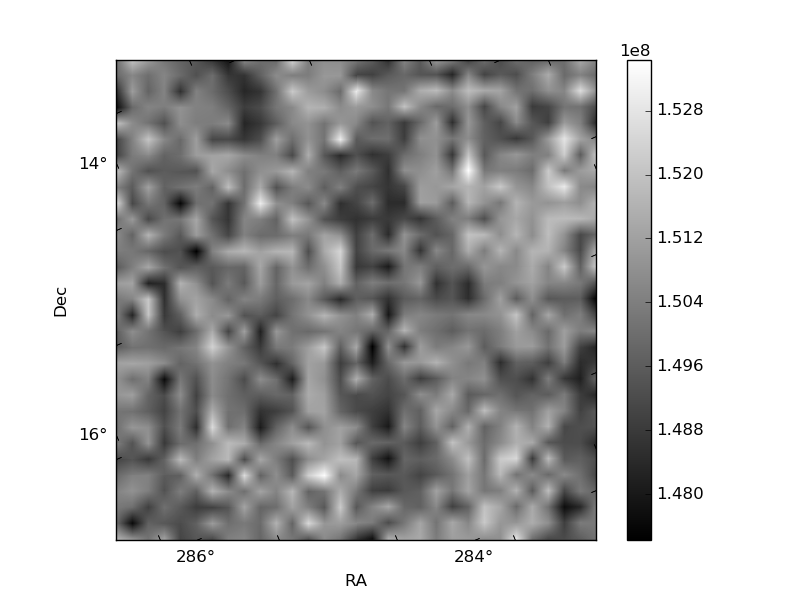
Quadrant B |
|---|---|---|---|
| Quadrant D | 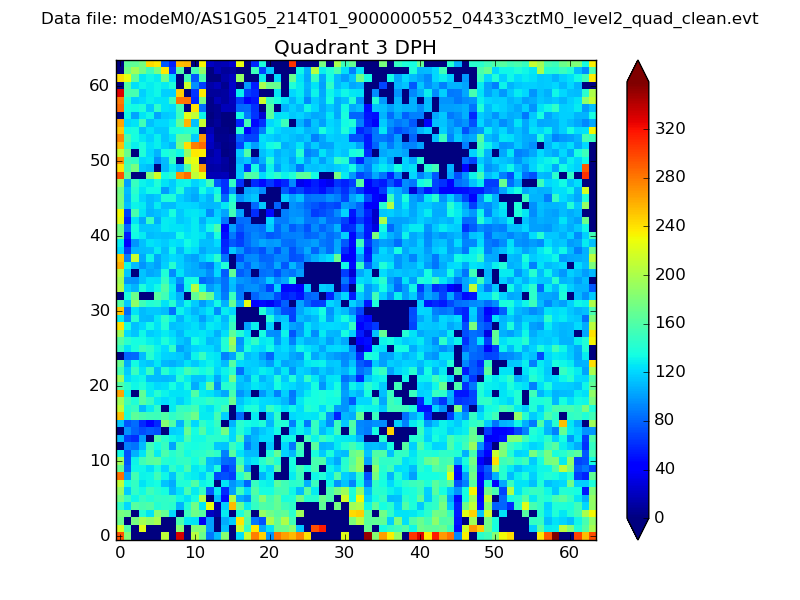 |
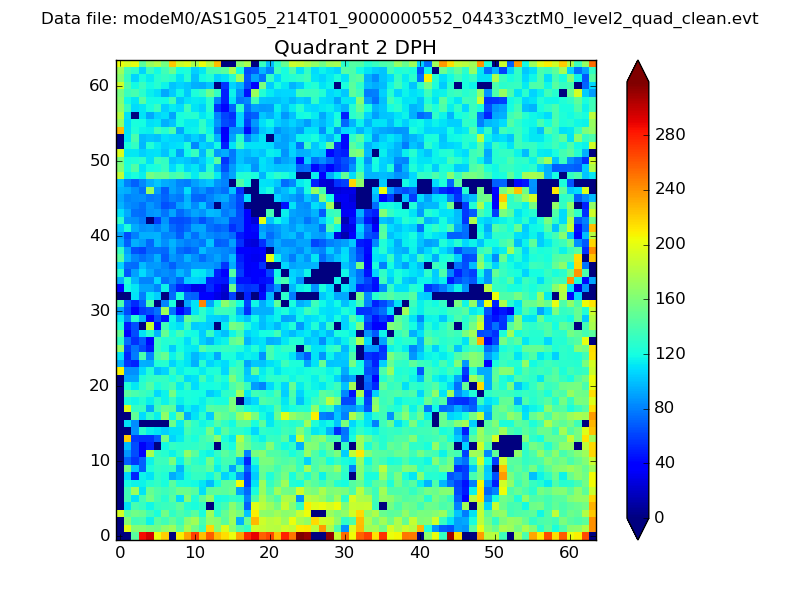 |
Quadrant C |
| Plot type | Count rate plots | Images |
|---|---|---|
| Comparison with Poisson distribution Blue bars denote a histogram of data divided into 1 sec bins. Red curve is a Poisson curve with rate = median count rate of data. |
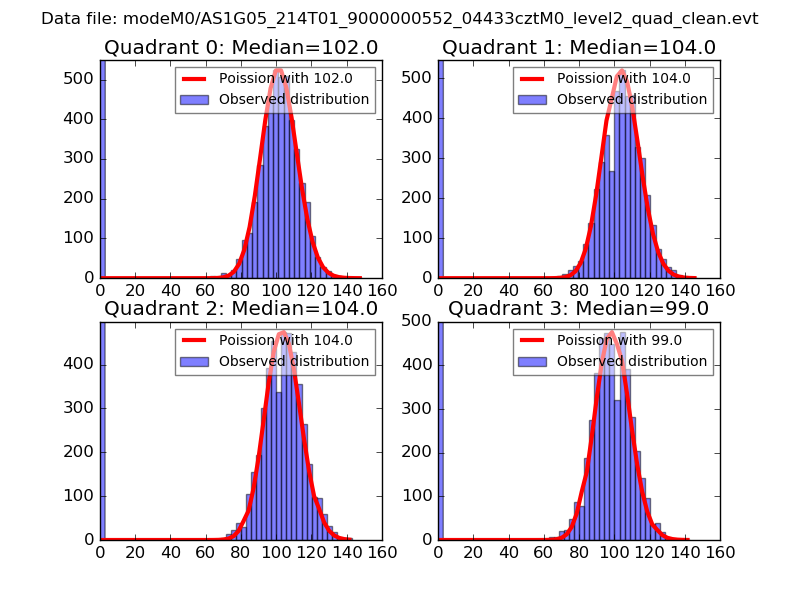 |
 |
| Quadrant-wise count rates Data is divided into 100 sec bins |
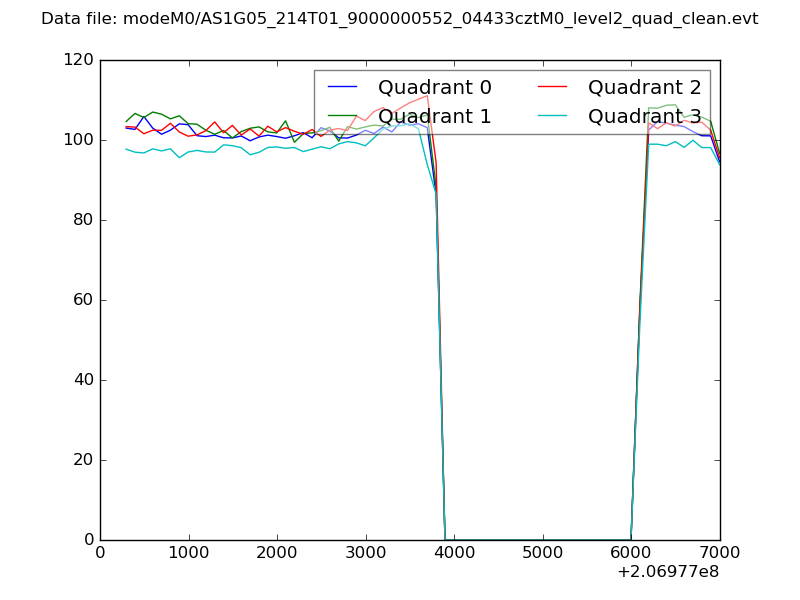 |
|
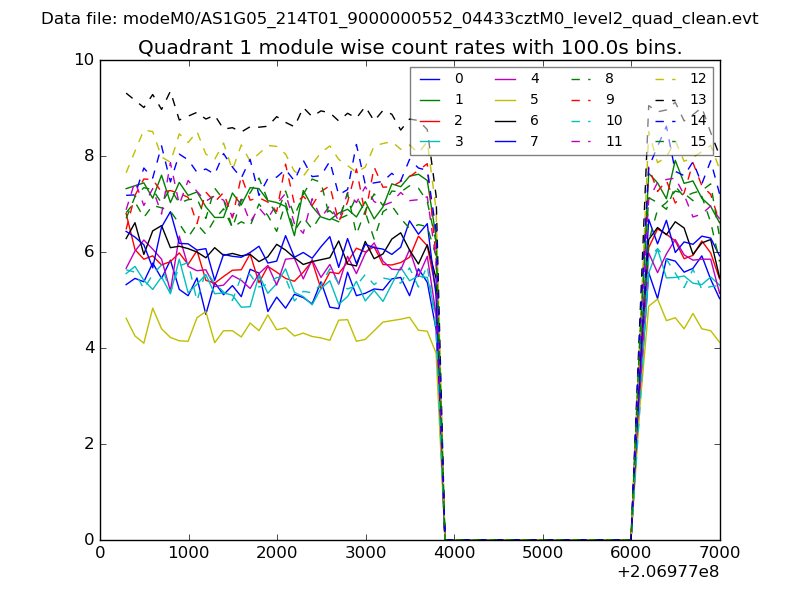
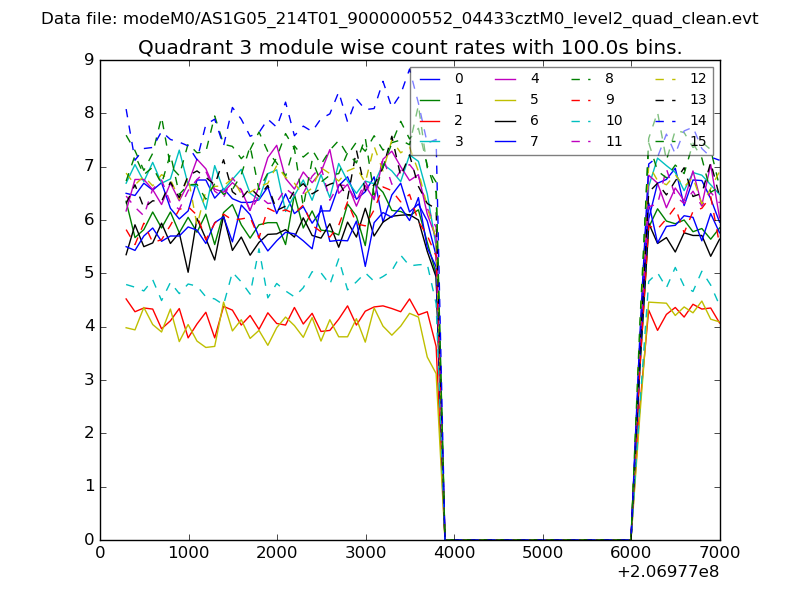
| Module-wise count rates for Quadrant A Data is divided into 100 sec bins |
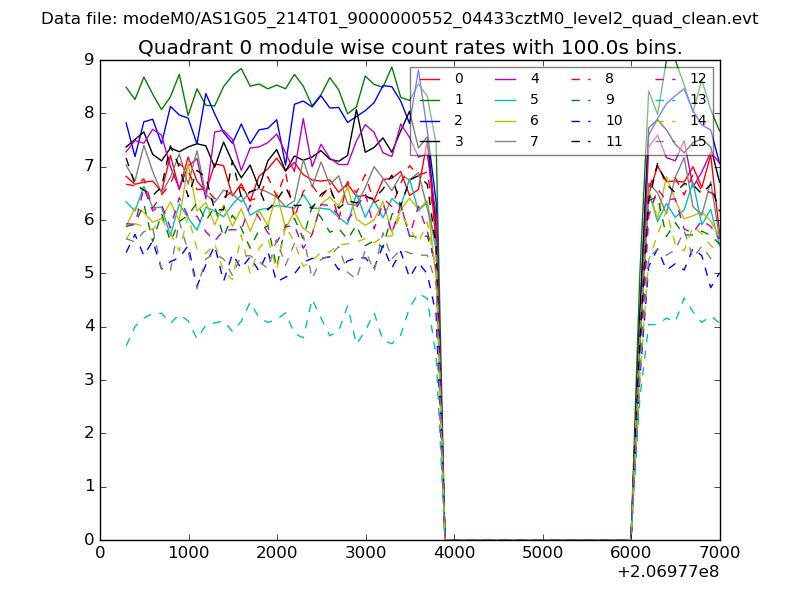 |
 |
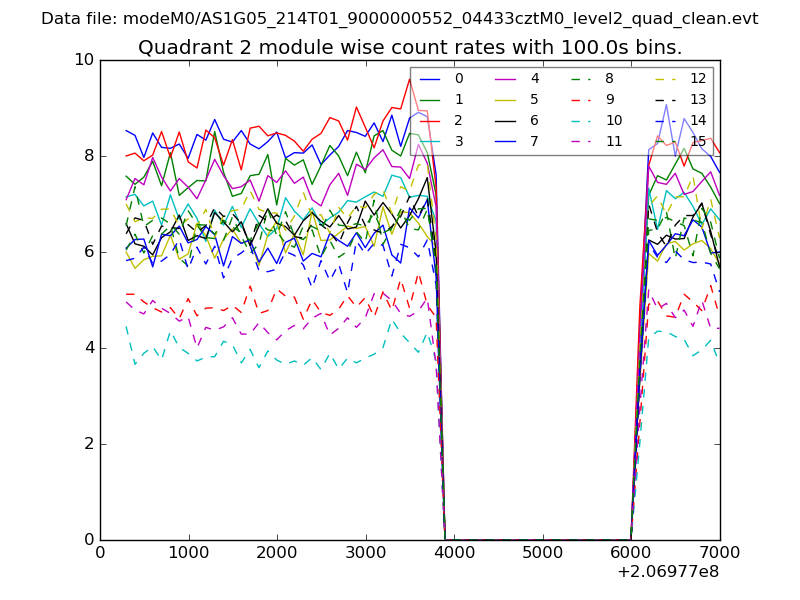
| Module-wise count rates for Quadrant B Data is divided into 100 sec bins |
 |
 |
| Module-wise count rates for Quadrant C Data is divided into 100 sec bins |
 |
 |
| Module-wise count rates for Quadrant D Data is divided into 100 sec bins |
 |
 |
| Parameter | Plot |
|---|---|
| CZT HV Monitor | 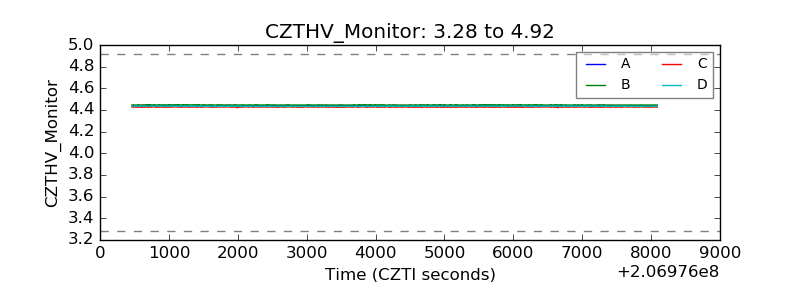 |
| D_VDD | 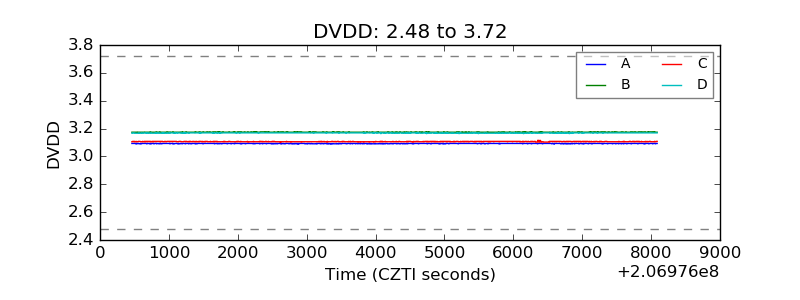 |
| Temperature 1 | 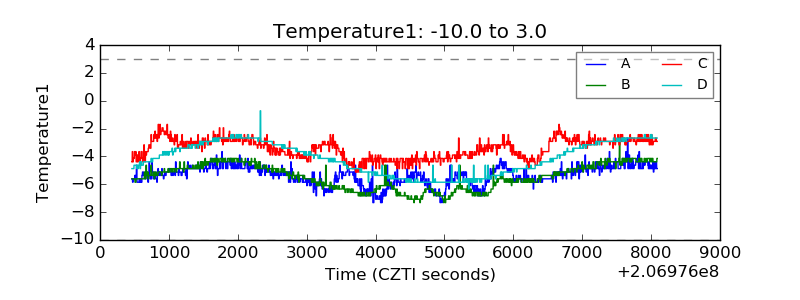 |
| Veto HV Monitor | 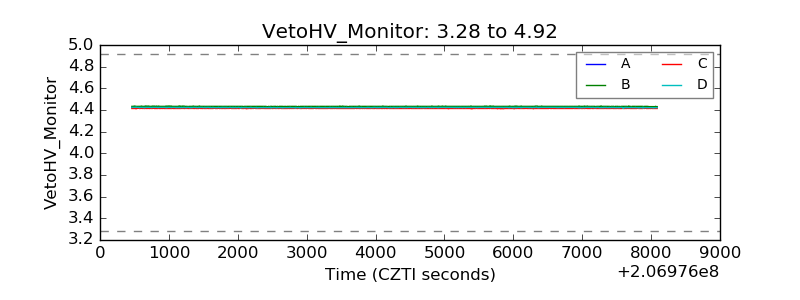 |
| Veto LLD | 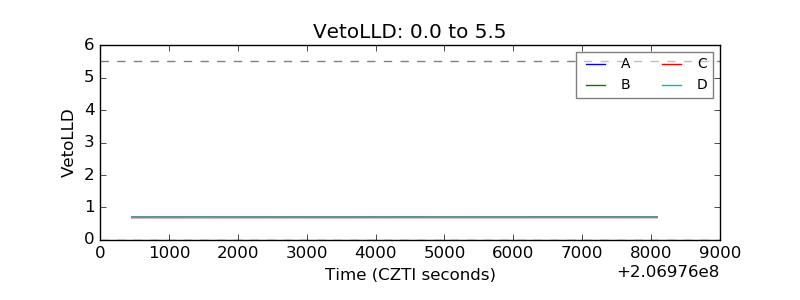 |
| Alpha Counter | 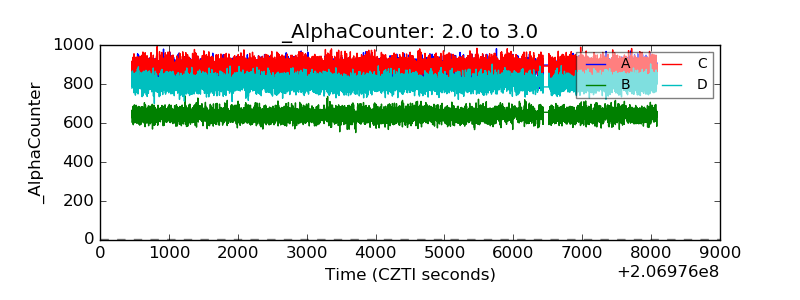 |
| _CPM_Rate | 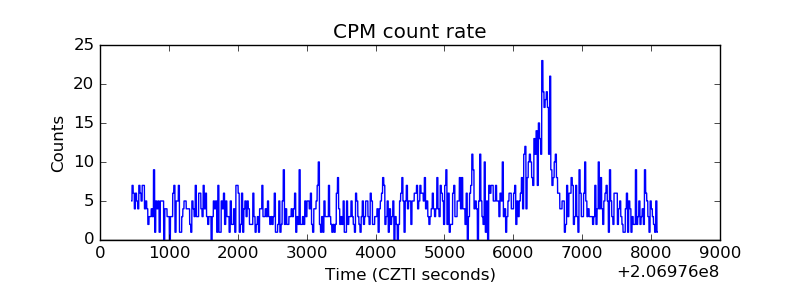 |
| CZT Counter | 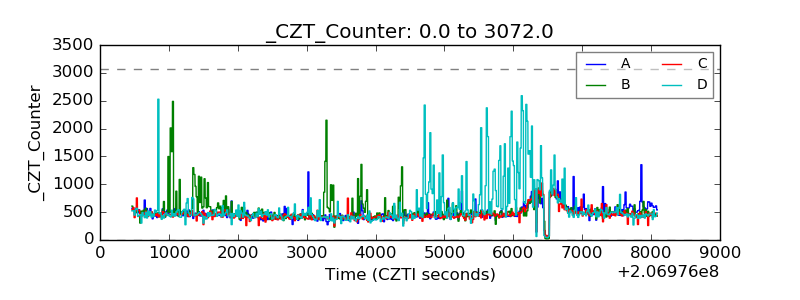 |
| +2.5 Volts monitor | 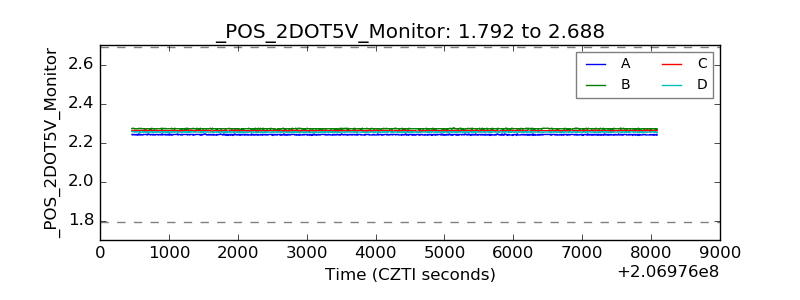 |
| +5 Volts monitor | 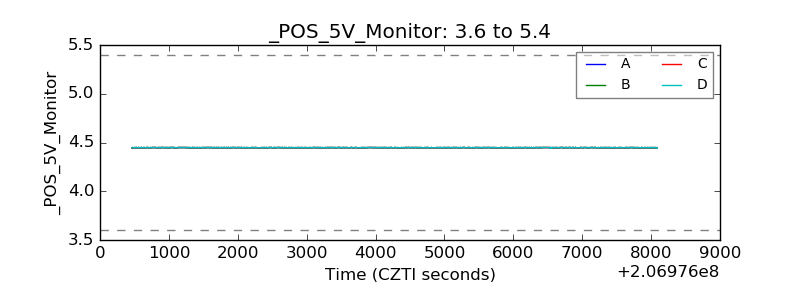 |
| _ROLL_ROT | 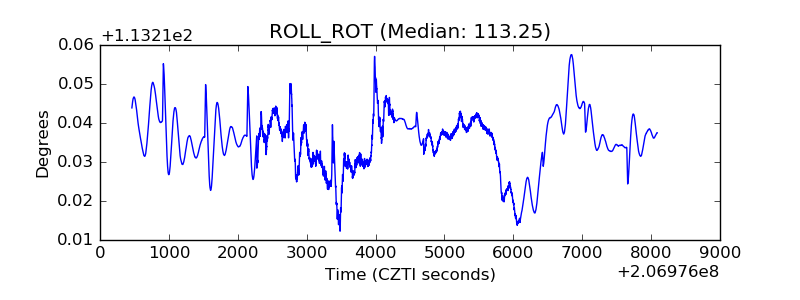 |
| _Roll_DEC | 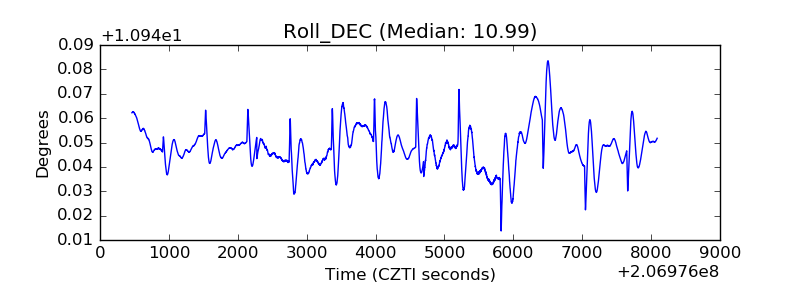 |
| _Roll_RA | 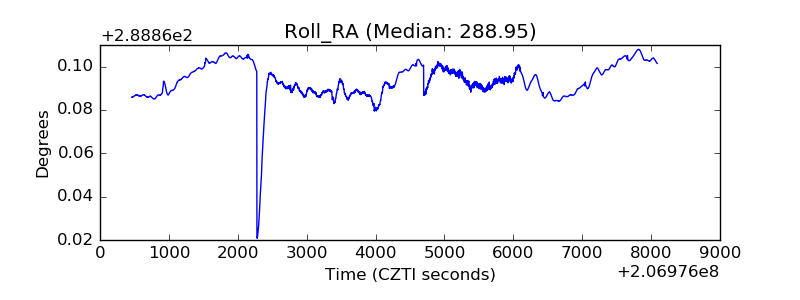 |
| Veto Counter | 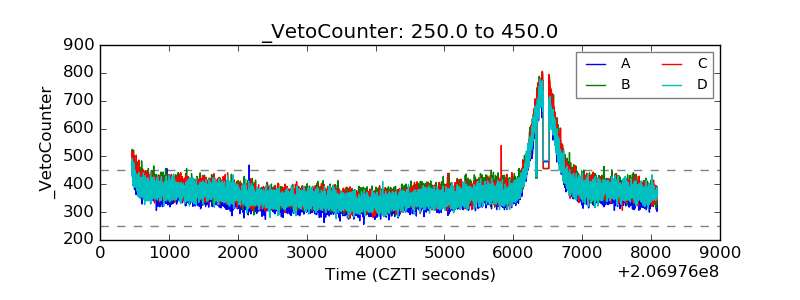 |