| Param | Original file | Final file |
|---|---|---|
| Filename | modeM0/AS1G05_214T01_9000000552_04437cztM0_level2.evt | modeM0/AS1G05_214T01_9000000552_04437cztM0_level2_quad_clean.evt |
| Size (bytes) | 1,217,960,640 | 198,397,440 |
| Size | 1.1 GB | 189.2 MB |
| Events in quadrant A | 8,444,317 | 1,182,936 |
| Events in quadrant B | 9,755,020 | 1,199,579 |
| Events in quadrant C | 8,250,384 | 1,211,874 |
| Events in quadrant D | 9,189,860 | 1,144,527 |
| Mode SS | |||
|---|---|---|---|
| Quadrant | BADHDUFLAG | Total packets | Discarded packets |
| A | 0 | 374 | 0 |
| B | 0 | 374 | 0 |
| C | 0 | 374 | 0 |
| D | 0 | 374 | 0 |
| Mode M0 | |||
|---|---|---|---|
| Quadrant | BADHDUFLAG | Total packets | Discarded packets |
| A | 0 | 38414 | 4 |
| B | 0 | 41769 | 3 |
| C | 0 | 37828 | 3 |
| D | 0 | 41005 | 3 |
| Mode M9 | |||
|---|---|---|---|
| Quadrant | BADHDUFLAG | Total packets | Discarded packets |
| A | 0 | 17 | 0 |
| B | 0 | 17 | 0 |
| C | 0 | 17 | 0 |
| D | 0 | 17 | 0 |
| Quadrant | Total seconds | Saturated seconds | Saturation percentage |
|---|---|---|---|
| A | 18420 | 266 | 1.444083% |
| B | 18420 | 489 | 2.654723% |
| C | 18420 | 146 | 0.792617% |
| D | 18420 | 382 | 2.073833% |
Noise dominated data is calculated using 1-second bins in cleaned event files. If a bin has >2000 counts, and if more than 50% of those come from <1% of pixels, then it is considered to be noise-dominated and hence unusable.
| Quadrant | # 1 sec bins | Bins with >0 counts | Bins with >2000 counts | High rate bins dominated by noise | Noise dominated (total time) | Noise dominated (detector-on time) | Marked lightcurve |
|---|---|---|---|---|---|---|---|
| A | 20140 | 18423 | 44 | 44 | 0.22% | 0.24% |  |
| B | 20140 | 18423 | 262 | 262 | 1.30% | 1.42% | 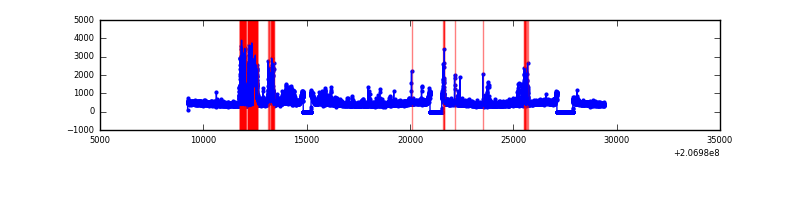 |
| C | 20140 | 18423 | 0 | 0 | 0.00% | 0.00% |  |
| D | 20140 | 18423 | 183 | 183 | 0.91% | 0.99% | 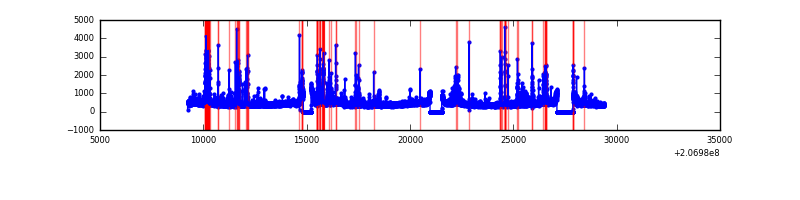 |
Top three noisy pixels from each quadrant. If the there are fewer than three noisy pixels in the level2.evt file, extra rows are filled as -1
| Pixel properties | Quadrant properties | ||||||
|---|---|---|---|---|---|---|---|
| Quadrant | DetID | PixID | Counts | Sigma | Mean | Median | Sigma |
| A | 0 | 13 | 189861 | 435.64 | 2112 | 2065 | 431.1 |
| A | 0 | 118 | 97613 | 221.65 | 2112 | 2065 | 431.1 |
| A | 0 | 226 | 28521 | 61.37 | 2112 | 2065 | 431.1 |
| B | 14 | 167 | 1353203 | 3292.93 | 2137 | 2087 | 410.3 |
| B | 4 | 48 | 82099 | 195.0 | 2137 | 2087 | 410.3 |
| B | 12 | 111 | 39503 | 91.19 | 2137 | 2087 | 410.3 |
| C | 7 | 239 | 48063 | 93.88 | 2084 | 2094 | 489.6 |
| C | 9 | 247 | 43655 | 84.88 | 2084 | 2094 | 489.6 |
| C | 13 | 61 | 17174 | 30.8 | 2084 | 2094 | 489.6 |
| D | 13 | 239 | 479602 | 961.36 | 2051 | 1992 | 496.8 |
| D | 14 | 34 | 377810 | 756.47 | 2051 | 1992 | 496.8 |
| D | 2 | 136 | 192109 | 382.68 | 2051 | 1992 | 496.8 |
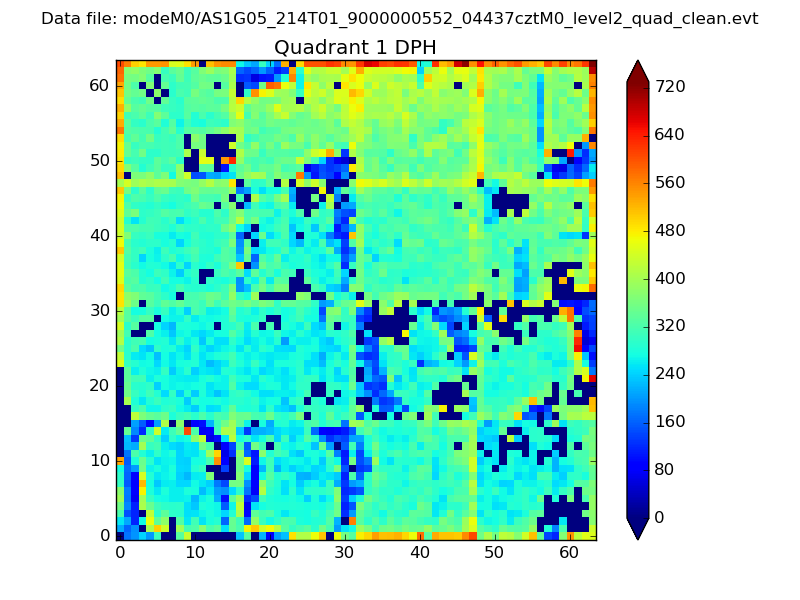
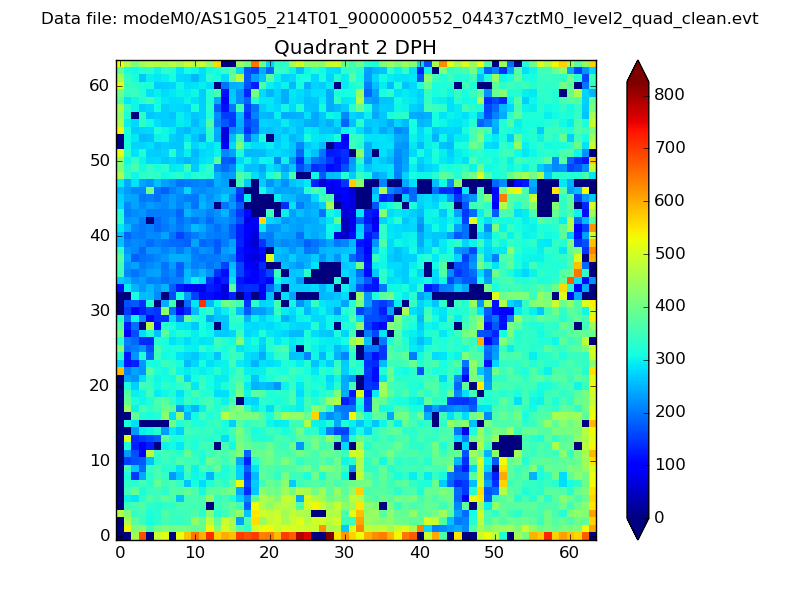
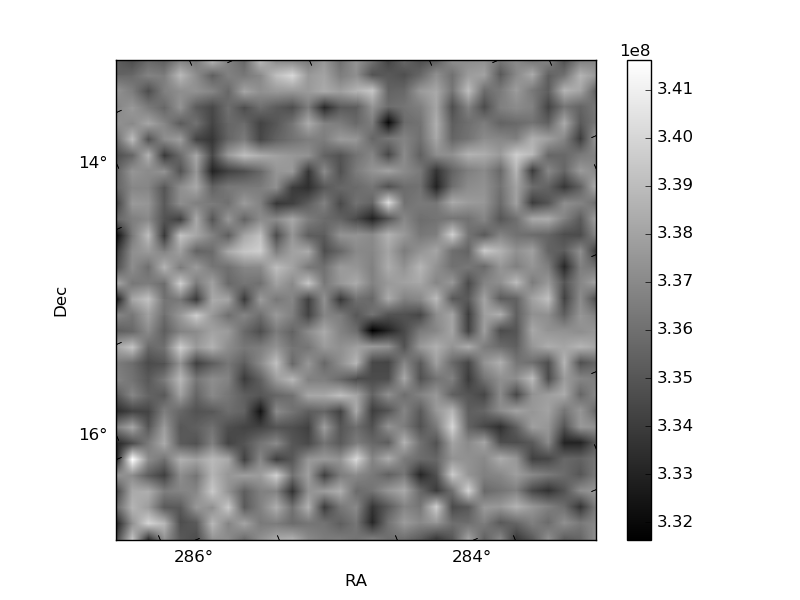
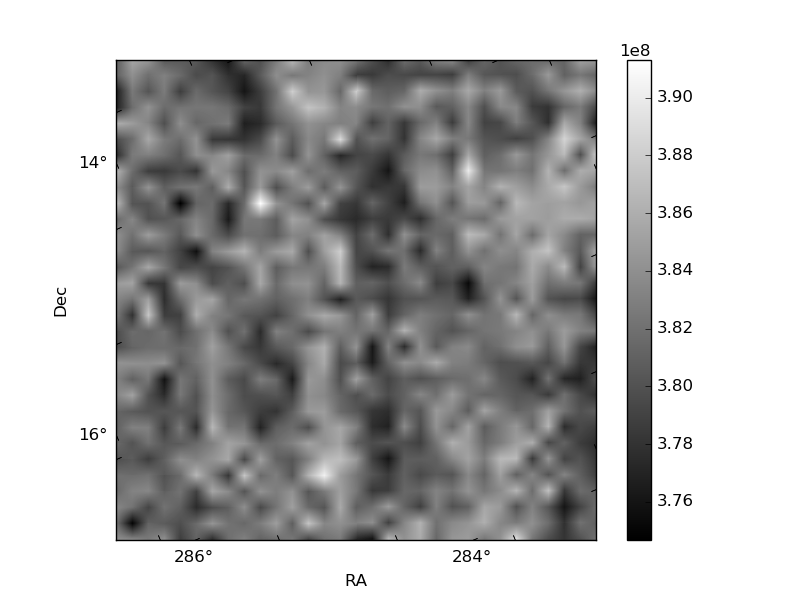
Histogram calculated using DETX and DETY for each event in the final _common_clean file
| Quadrant A | 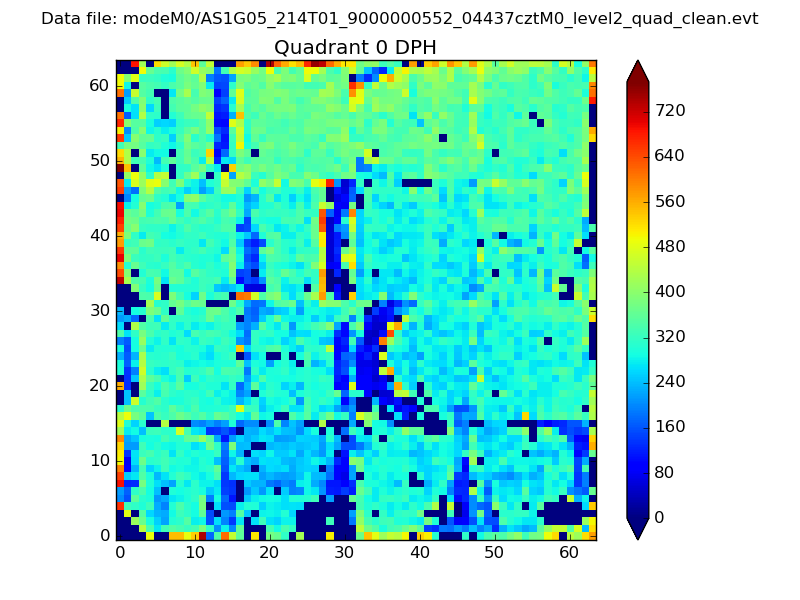 |
 |
Quadrant B |
|---|---|---|---|
| Quadrant D |  |
 |
Quadrant C |
| Plot type | Count rate plots | Images |
|---|---|---|
| Comparison with Poisson distribution Blue bars denote a histogram of data divided into 1 sec bins. Red curve is a Poisson curve with rate = median count rate of data. |
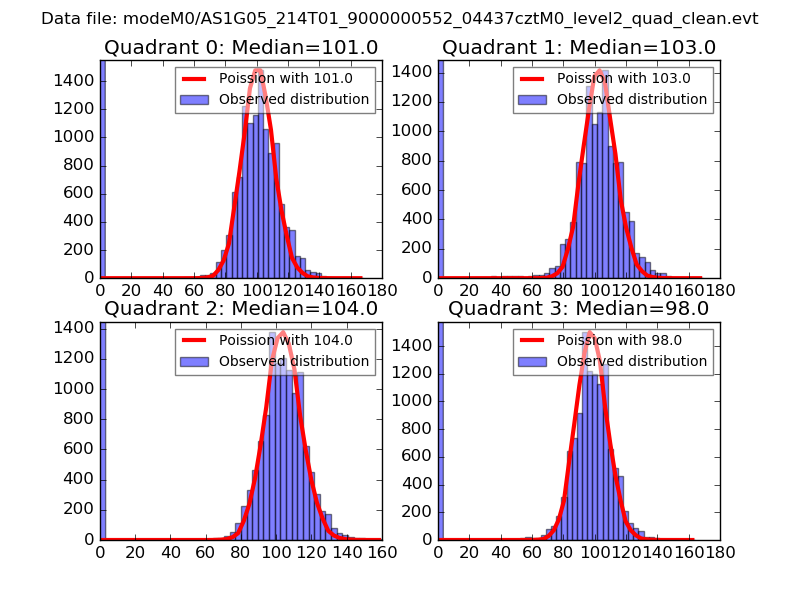 |
 |
| Quadrant-wise count rates Data is divided into 100 sec bins |
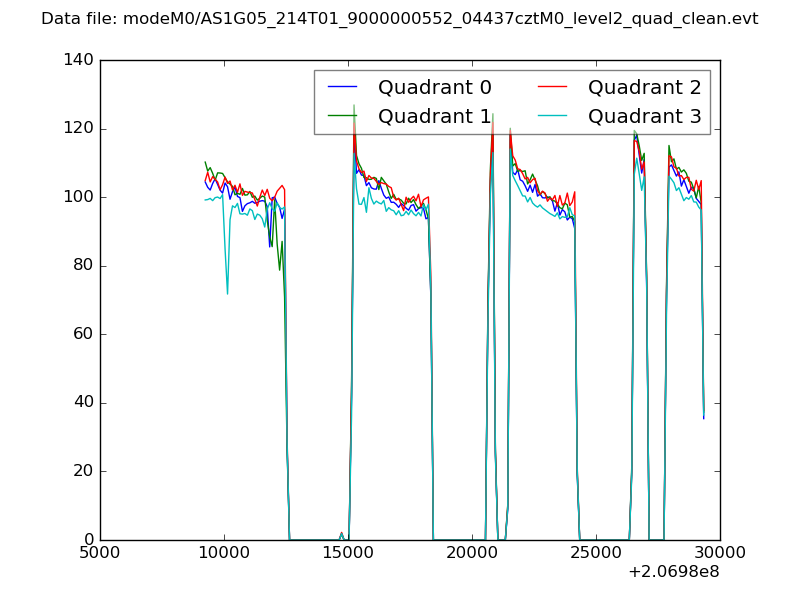 |
|
| Module-wise count rates for Quadrant A Data is divided into 100 sec bins |
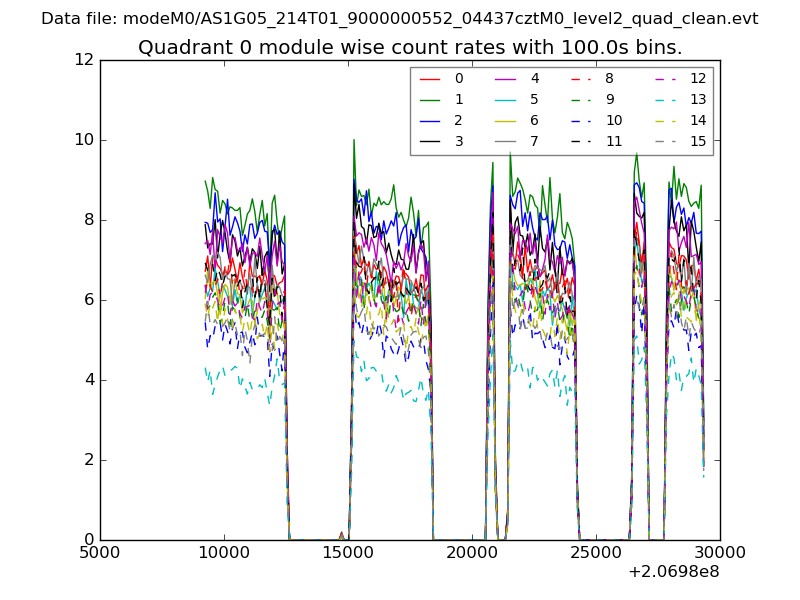 |
 |
| Module-wise count rates for Quadrant B Data is divided into 100 sec bins |
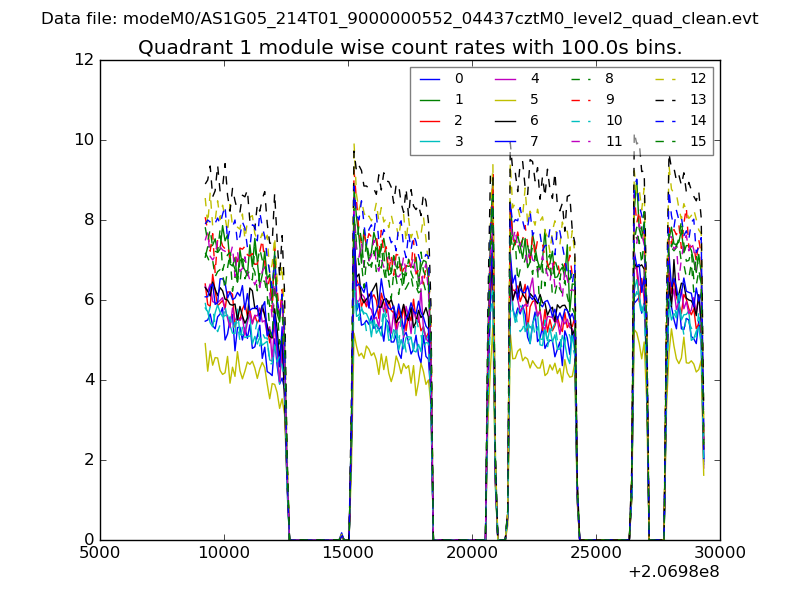 |
 |
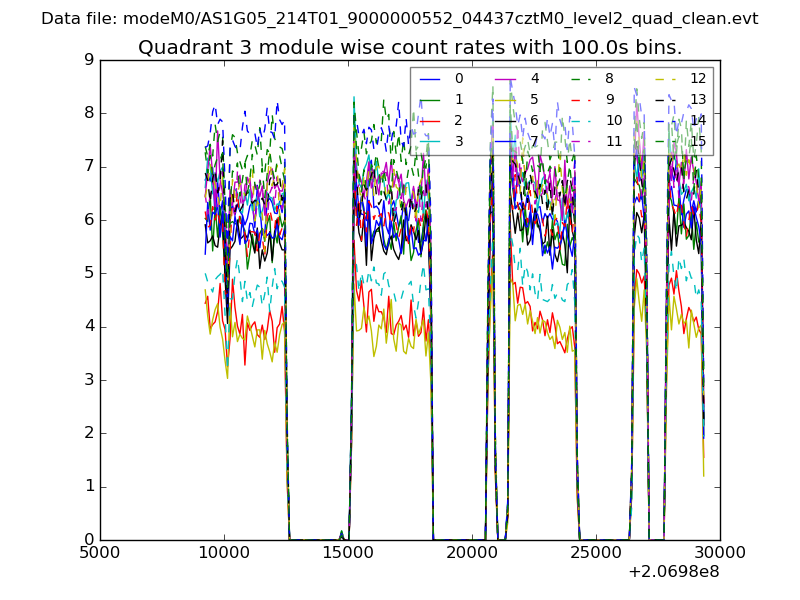
| Module-wise count rates for Quadrant C Data is divided into 100 sec bins |
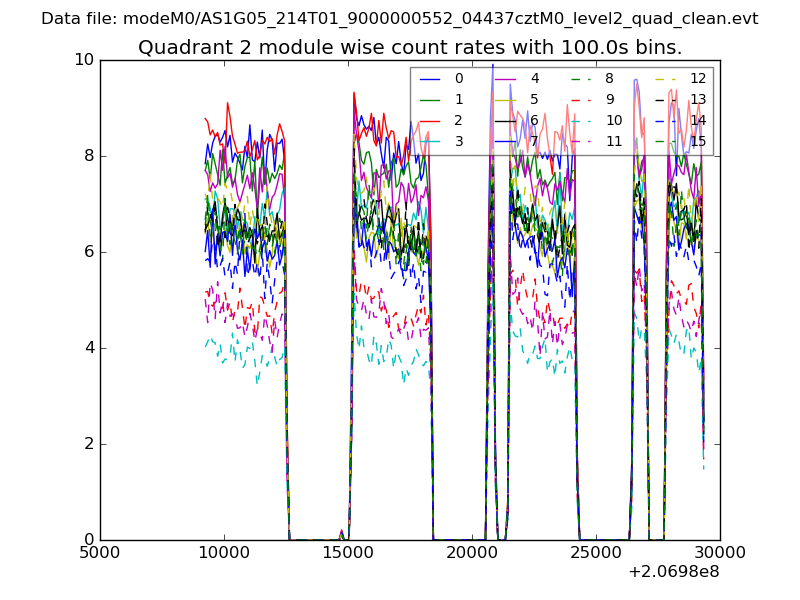 |
 |
| Module-wise count rates for Quadrant D Data is divided into 100 sec bins |
 |
 |
| Parameter | Plot |
|---|---|
| CZT HV Monitor | 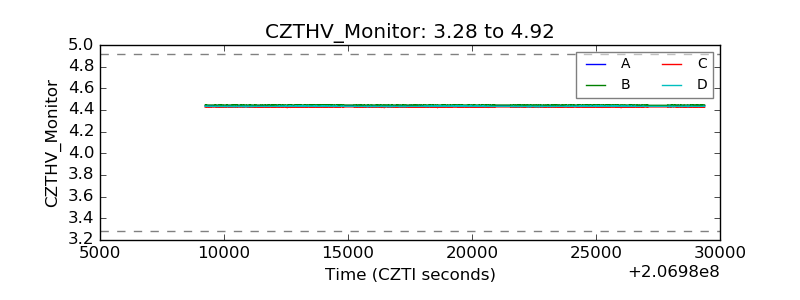 |
| D_VDD | 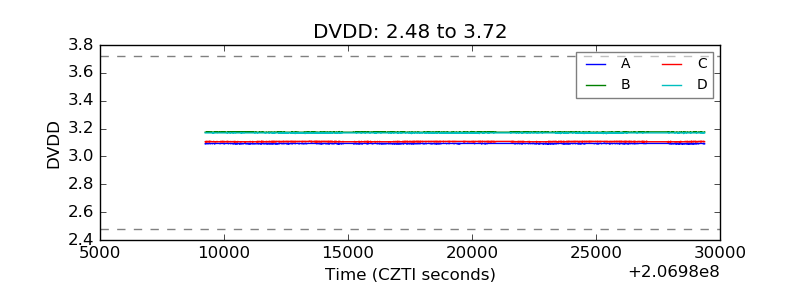 |
| Temperature 1 | 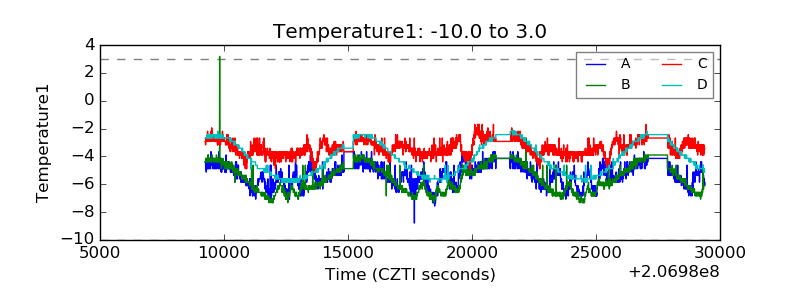 |
| Veto HV Monitor | 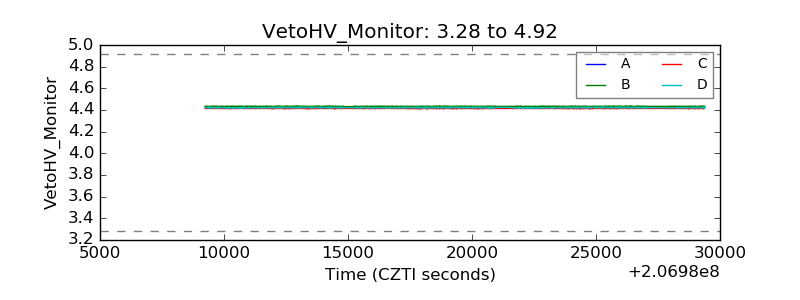 |
| Veto LLD | 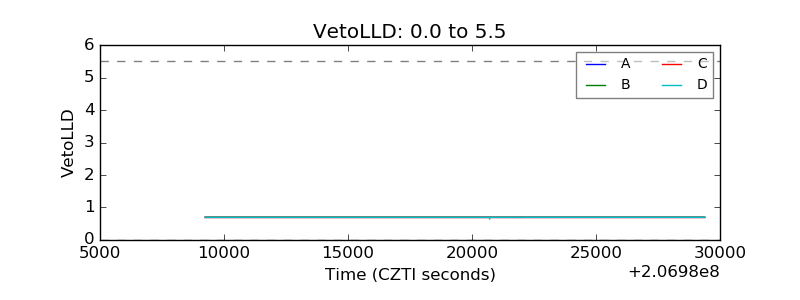 |
| Alpha Counter | 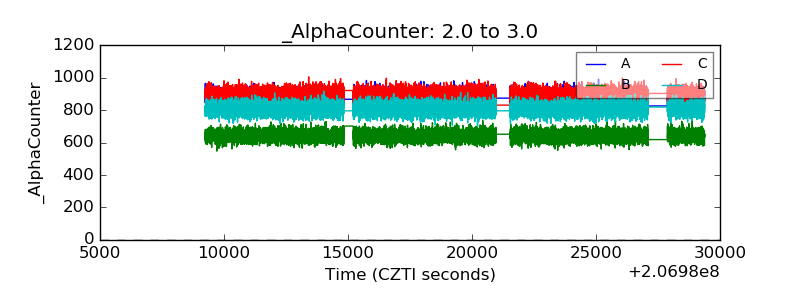 |
| _CPM_Rate | 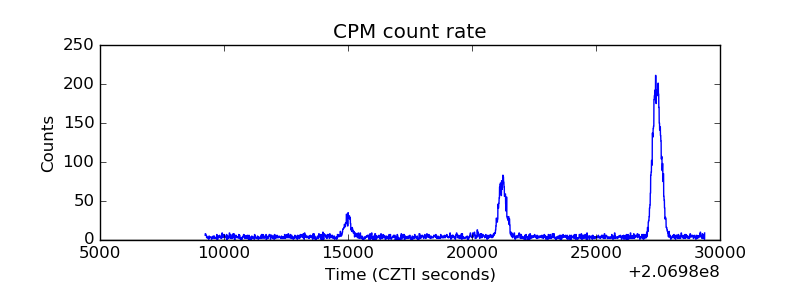 |
| CZT Counter | 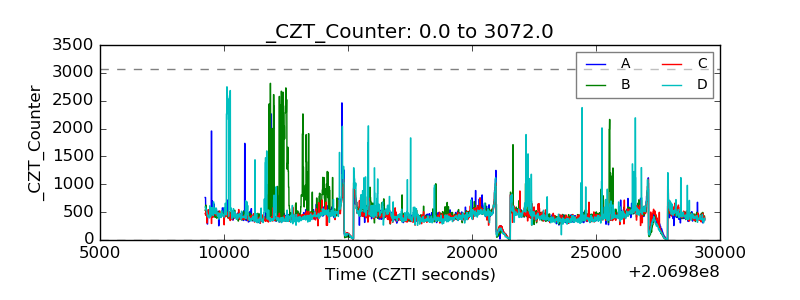 |
| +2.5 Volts monitor |  |
| +5 Volts monitor |  |
| _ROLL_ROT | 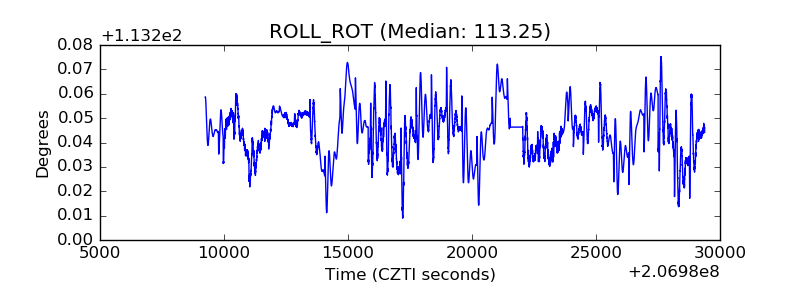 |
| _Roll_DEC | 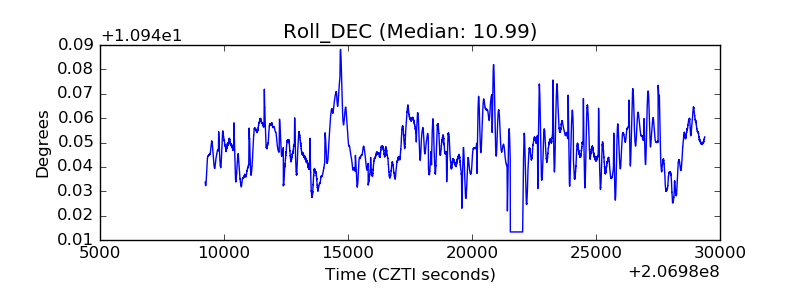 |
| _Roll_RA | 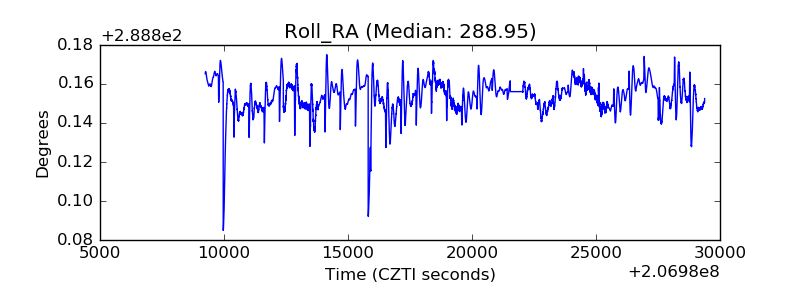 |
| Veto Counter | 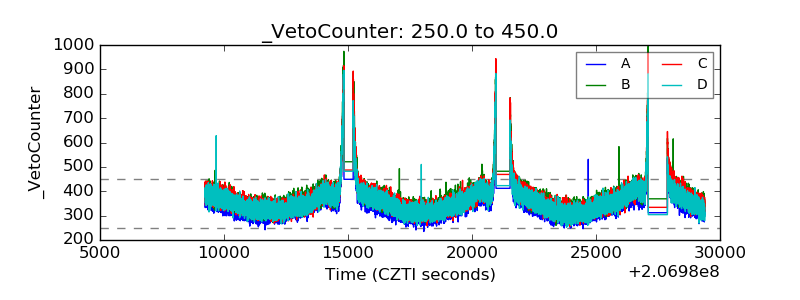 |