| Param | Original file | Final file |
|---|---|---|
| Filename | modeM0/AS1SLEW_01234_9000000551_04430cztM0_level2.evt | modeM0/AS1SLEW_01234_9000000551_04430cztM0_level2_quad_clean.evt |
| Size (bytes) | 147,902,400 | 3,553,920 |
| Size | 141.1 MB | 3.4 MB |
| Events in quadrant A | 720,274 | 2,754 |
| Events in quadrant B | 640,420 | 2,815 |
| Events in quadrant C | 548,711 | 2,762 |
| Events in quadrant D | 2,480,015 | 2,070 |
| Mode SS | |||
|---|---|---|---|
| Quadrant | BADHDUFLAG | Total packets | Discarded packets |
| A | 0 | 26 | 0 |
| B | 0 | 26 | 0 |
| C | 0 | 26 | 0 |
| D | 0 | 26 | 0 |
| Mode M0 | |||
|---|---|---|---|
| Quadrant | BADHDUFLAG | Total packets | Discarded packets |
| A | 0 | 2966 | 0 |
| B | 0 | 2749 | 0 |
| C | 0 | 2577 | 0 |
| D | 0 | 8229 | 0 |
| Quadrant | Total seconds | Saturated seconds | Saturation percentage |
|---|---|---|---|
| A | 1281 | 19 | 1.483216% |
| B | 1281 | 14 | 1.092896% |
| C | 1281 | 0 | 0.000000% |
| D | 1281 | 678 | 52.927400% |
Noise dominated data is calculated using 1-second bins in cleaned event files. If a bin has >2000 counts, and if more than 50% of those come from <1% of pixels, then it is considered to be noise-dominated and hence unusable.
| Quadrant | # 1 sec bins | Bins with >0 counts | Bins with >2000 counts | High rate bins dominated by noise | Noise dominated (total time) | Noise dominated (detector-on time) | Marked lightcurve |
|---|---|---|---|---|---|---|---|
| A | 1281 | 1281 | 15 | 15 | 1.17% | 1.17% | 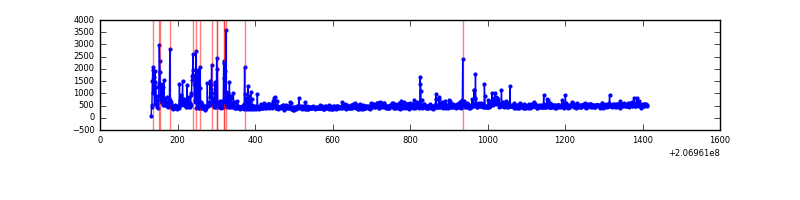 |
| B | 1281 | 1281 | 12 | 12 | 0.94% | 0.94% | 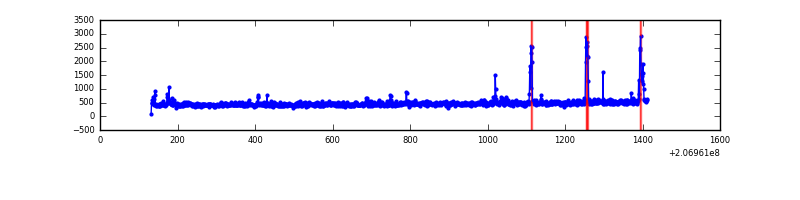 |
| C | 1281 | 1281 | 0 | 0 | 0.00% | 0.00% | 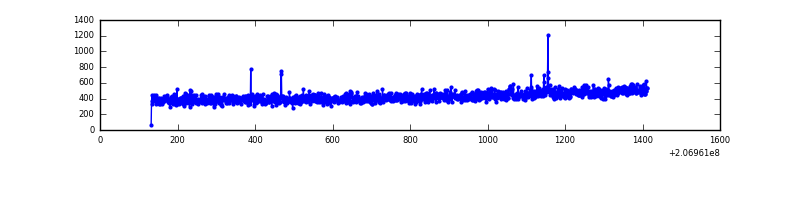 |
| D | 1281 | 1281 | 802 | 802 | 62.61% | 62.61% | 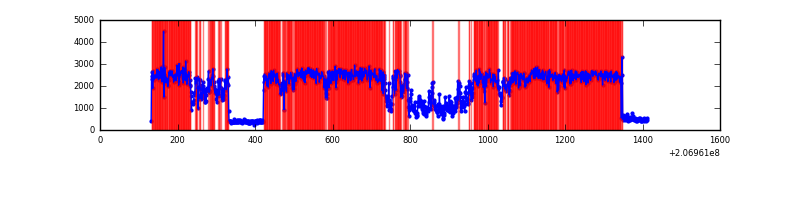 |
Top three noisy pixels from each quadrant. If the there are fewer than three noisy pixels in the level2.evt file, extra rows are filled as -1
| Pixel properties | Quadrant properties | ||||||
|---|---|---|---|---|---|---|---|
| Quadrant | DetID | PixID | Counts | Sigma | Mean | Median | Sigma |
| A | 0 | 13 | 148415 | 4809.24 | 144 | 142 | 30.8 |
| A | 0 | 118 | 9495 | 303.36 | 144 | 142 | 30.8 |
| A | 8 | 15 | 4491 | 141.06 | 144 | 142 | 30.8 |
| B | 10 | 16 | 59415 | 1936.88 | 146 | 142 | 30.6 |
| B | 14 | 167 | 10836 | 349.45 | 146 | 142 | 30.6 |
| B | 15 | 204 | 4496 | 142.28 | 146 | 142 | 30.6 |
| C | 9 | 247 | 3742 | 104.7 | 139 | 140 | 34.4 |
| C | 13 | 61 | 1159 | 29.62 | 139 | 140 | 34.4 |
| C | 12 | 4 | 743 | 17.53 | 139 | 140 | 34.4 |
| D | 13 | 114 | 1912478 | 59483.76 | 124 | 120 | 32.1 |
| D | 13 | 239 | 48451 | 1503.33 | 124 | 120 | 32.1 |
| D | 13 | 53 | 18013 | 556.56 | 124 | 120 | 32.1 |
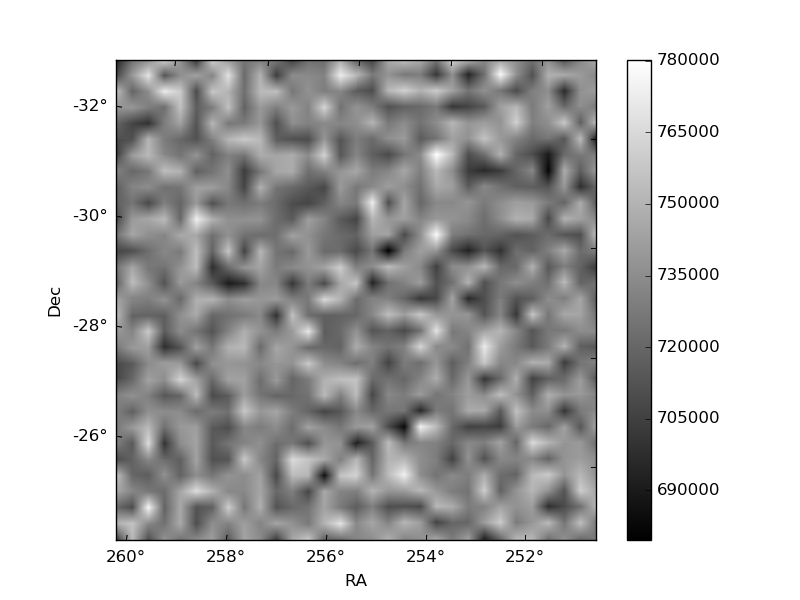
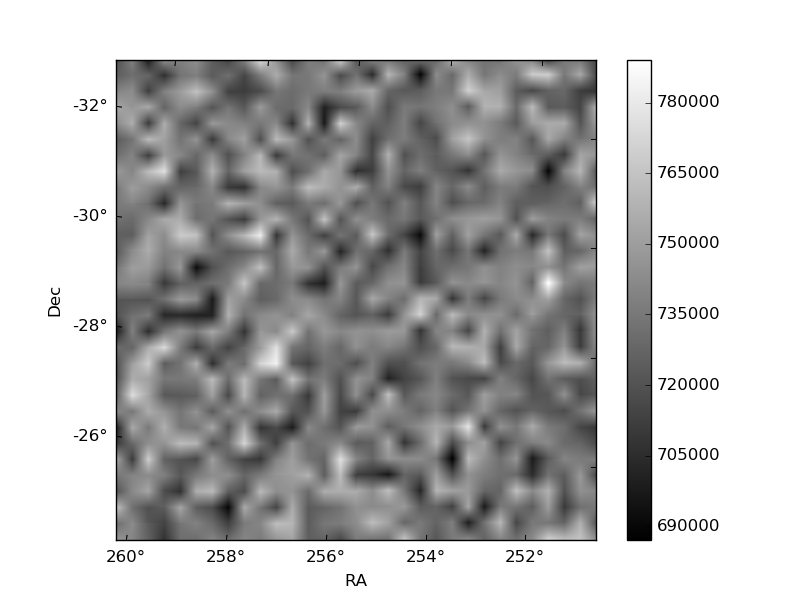
Histogram calculated using DETX and DETY for each event in the final _common_clean file
| Quadrant A |  |
 |
Quadrant B |
|---|---|---|---|
| Quadrant D |  |
 |
Quadrant C |
| Plot type | Count rate plots | Images |
|---|---|---|
| Comparison with Poisson distribution Blue bars denote a histogram of data divided into 1 sec bins. Red curve is a Poisson curve with rate = median count rate of data. |
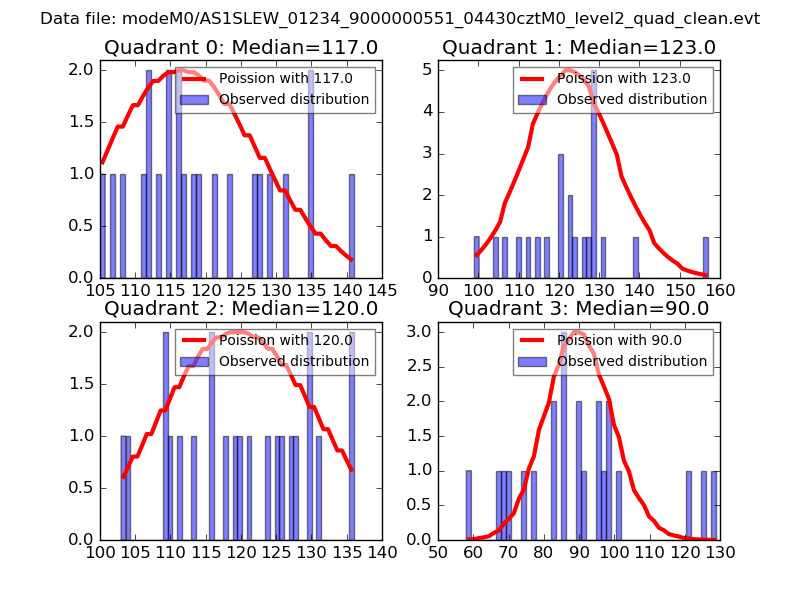 |
 |
| Quadrant-wise count rates Data is divided into 100 sec bins |
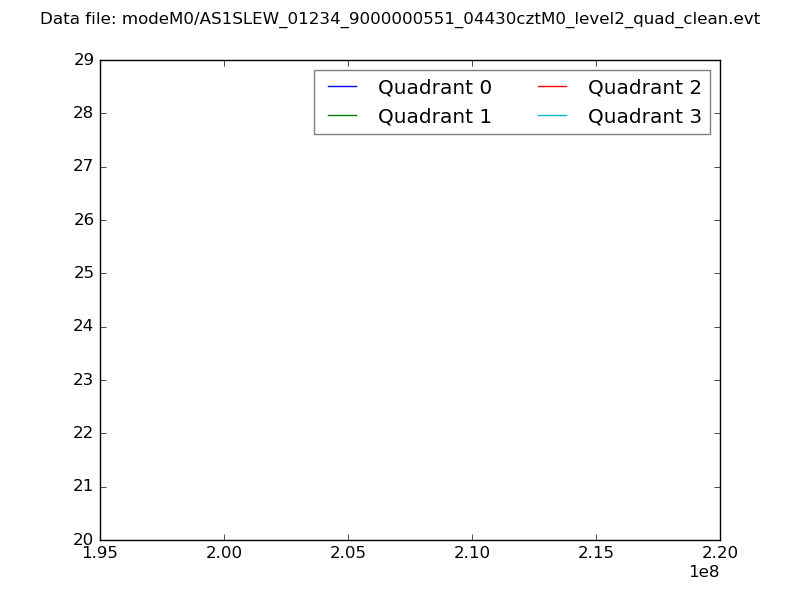 |
|
| Module-wise count rates for Quadrant A Data is divided into 100 sec bins |
 |
 |
| Module-wise count rates for Quadrant B Data is divided into 100 sec bins |
 |
 |
| Module-wise count rates for Quadrant C Data is divided into 100 sec bins |
 |
 |
| Module-wise count rates for Quadrant D Data is divided into 100 sec bins |
 |
 |
| Parameter | Plot |
|---|---|
| CZT HV Monitor | 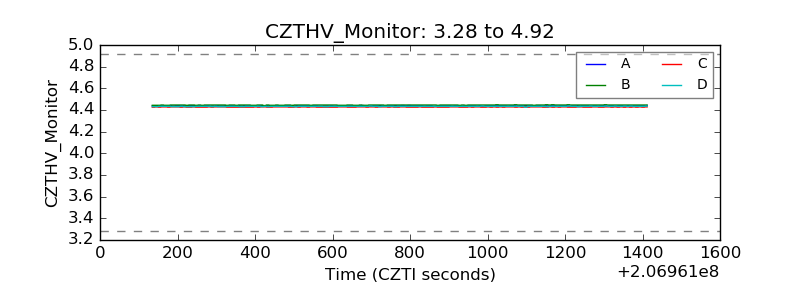 |
| D_VDD | 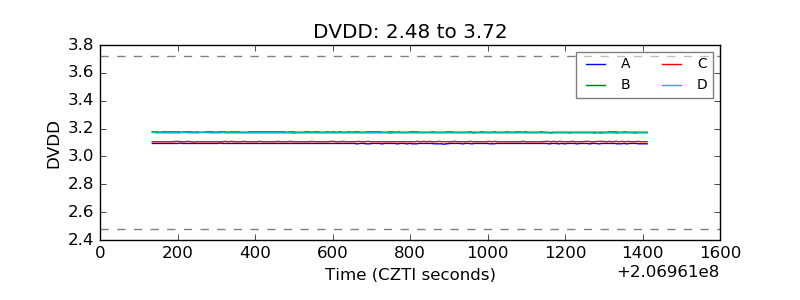 |
| Temperature 1 | 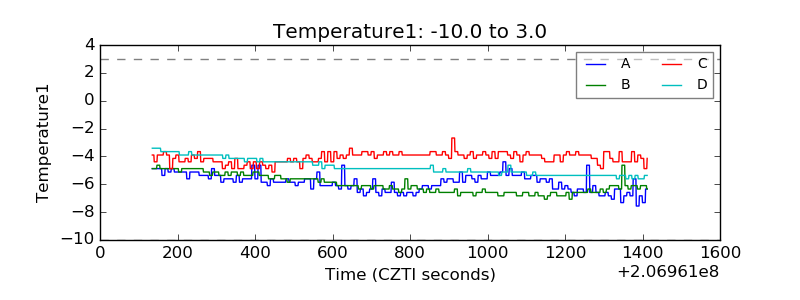 |
| Veto HV Monitor | 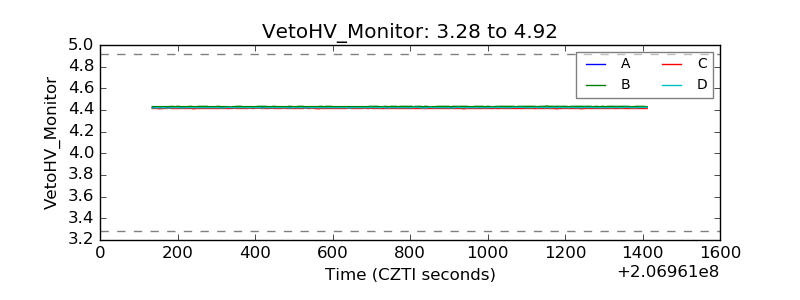 |
| Veto LLD | 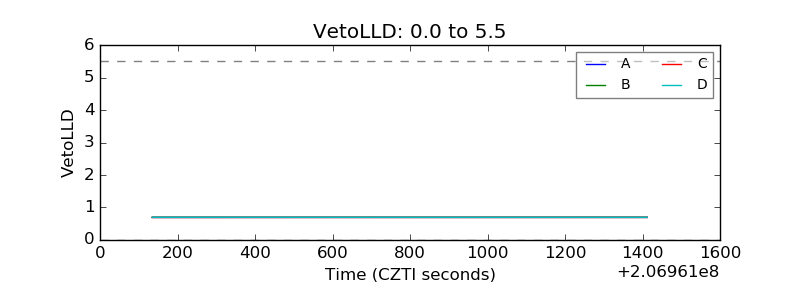 |
| Alpha Counter | 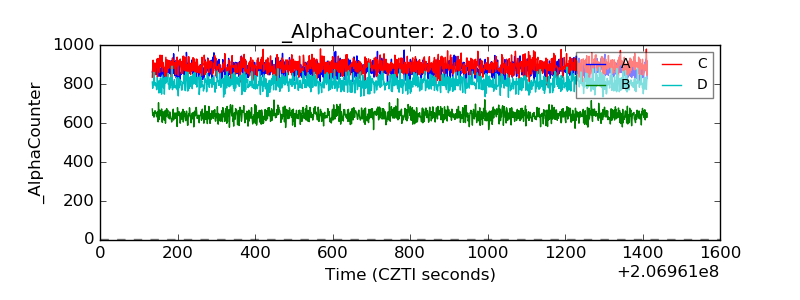 |
| _CPM_Rate | 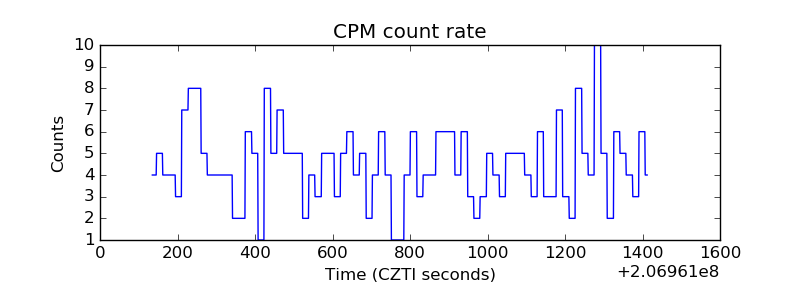 |
| CZT Counter | 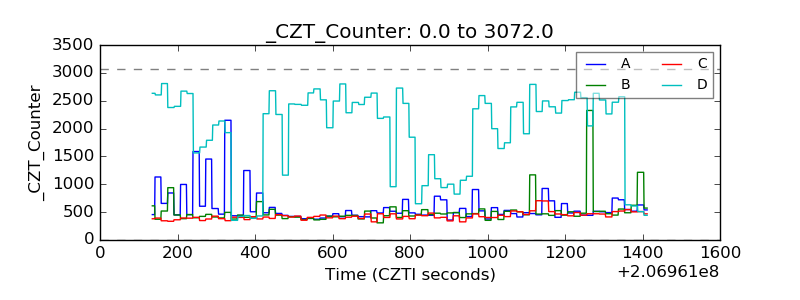 |
| +2.5 Volts monitor |  |
| +5 Volts monitor |  |
| _ROLL_ROT | 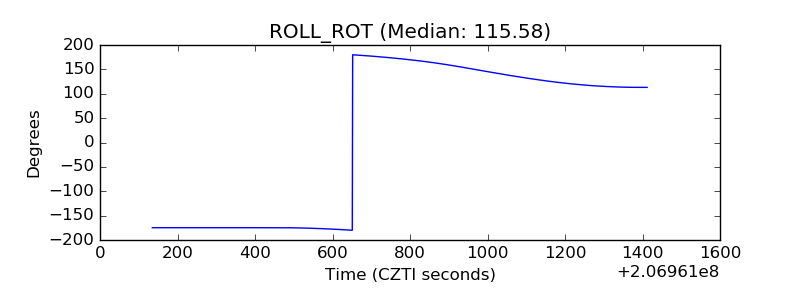 |
| _Roll_DEC | 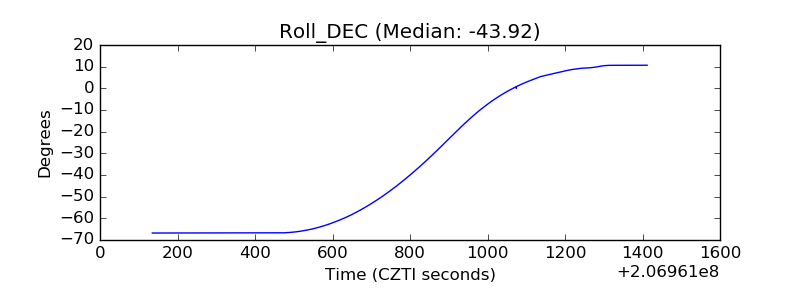 |
| _Roll_RA | 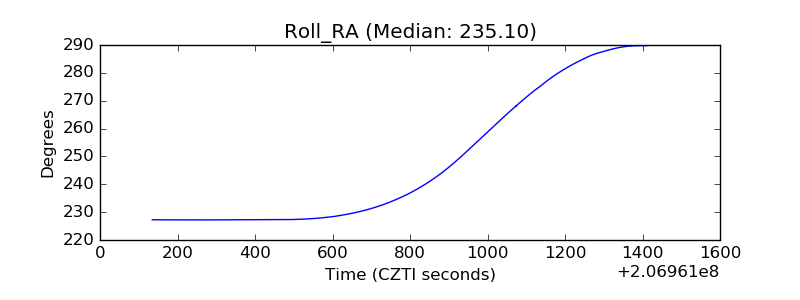 |
| Veto Counter | 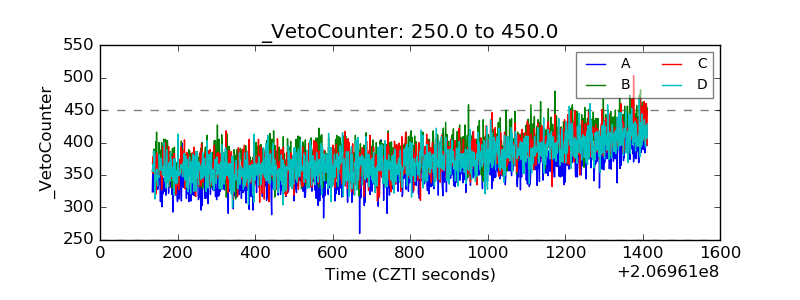 |