| Param | Original file | Final file |
|---|---|---|
| Filename | modeM0/AS1SLEW_01234_9000000553_04438cztM0_level2.evt | modeM0/AS1SLEW_01234_9000000553_04438cztM0_level2_quad_clean.evt |
| Size (bytes) | 30,196,800 | 1,592,640 |
| Size | 28.8 MB | 1.5 MB |
| Events in quadrant A | 208,325 | 2,578 |
| Events in quadrant B | 218,913 | 2,651 |
| Events in quadrant C | 216,426 | 2,510 |
| Events in quadrant D | 238,619 | 2,407 |
| Mode M9 | |||
|---|---|---|---|
| Quadrant | BADHDUFLAG | Total packets | Discarded packets |
| A | 0 | 1 | 0 |
| B | 0 | 1 | 0 |
| C | 0 | 1 | 0 |
| D | 0 | 1 | 0 |
| Mode M0 | |||
|---|---|---|---|
| Quadrant | BADHDUFLAG | Total packets | Discarded packets |
| A | 0 | 877 | 1 |
| B | 0 | 905 | 1 |
| C | 0 | 890 | 1 |
| D | 0 | 976 | 1 |
| Mode SS | |||
|---|---|---|---|
| Quadrant | BADHDUFLAG | Total packets | Discarded packets |
| A | 0 | 8 | 0 |
| B | 0 | 8 | 0 |
| C | 0 | 8 | 0 |
| D | 0 | 8 | 0 |
| Quadrant | Total seconds | Saturated seconds | Saturation percentage |
|---|---|---|---|
| A | 421 | 2 | 0.475059% |
| B | 421 | 2 | 0.475059% |
| C | 421 | 2 | 0.475059% |
| D | 421 | 1 | 0.237530% |
Noise dominated data is calculated using 1-second bins in cleaned event files. If a bin has >2000 counts, and if more than 50% of those come from <1% of pixels, then it is considered to be noise-dominated and hence unusable.
| Quadrant | # 1 sec bins | Bins with >0 counts | Bins with >2000 counts | High rate bins dominated by noise | Noise dominated (total time) | Noise dominated (detector-on time) | Marked lightcurve |
|---|---|---|---|---|---|---|---|
| A | 421 | 421 | 0 | 0 | 0.00% | 0.00% | 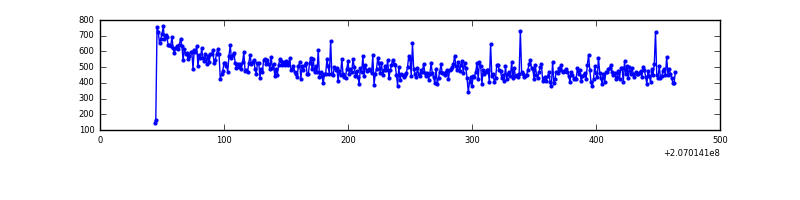 |
| B | 421 | 421 | 0 | 0 | 0.00% | 0.00% | 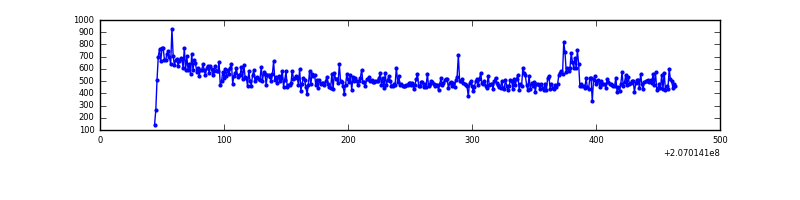 |
| C | 421 | 421 | 0 | 0 | 0.00% | 0.00% | 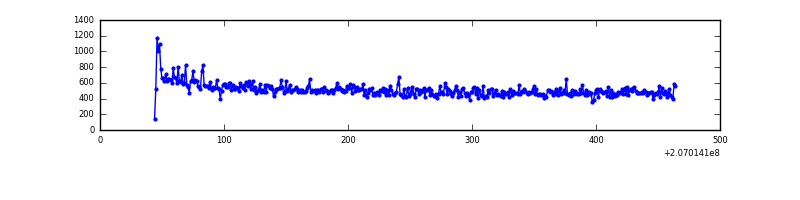 |
| D | 421 | 421 | 0 | 0 | 0.00% | 0.00% | 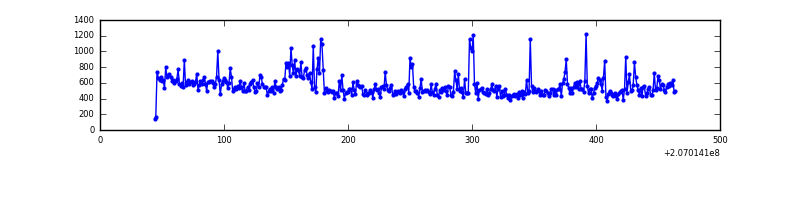 |
Top three noisy pixels from each quadrant. If the there are fewer than three noisy pixels in the level2.evt file, extra rows are filled as -1
| Pixel properties | Quadrant properties | ||||||
|---|---|---|---|---|---|---|---|
| Quadrant | DetID | PixID | Counts | Sigma | Mean | Median | Sigma |
| A | 0 | 226 | 527 | 36.17 | 53 | 52 | 13.1 |
| A | 12 | 194 | 496 | 33.81 | 53 | 52 | 13.1 |
| A | 15 | 234 | 365 | 23.83 | 53 | 52 | 13.1 |
| B | 14 | 167 | 3089 | 239.78 | 54 | 53 | 12.7 |
| B | 15 | 204 | 2789 | 216.09 | 54 | 53 | 12.7 |
| B | 4 | 48 | 1126 | 84.74 | 54 | 53 | 12.7 |
| C | 7 | 237 | 1818 | 120.24 | 53 | 53 | 14.7 |
| C | 14 | 48 | 1284 | 83.86 | 53 | 53 | 14.7 |
| C | 9 | 247 | 1041 | 67.31 | 53 | 53 | 14.7 |
| D | 2 | 63 | 30965 | 2126.92 | 52 | 51 | 14.5 |
| D | 8 | 230 | 2342 | 157.62 | 52 | 51 | 14.5 |
| D | 13 | 238 | 1895 | 126.87 | 52 | 51 | 14.5 |
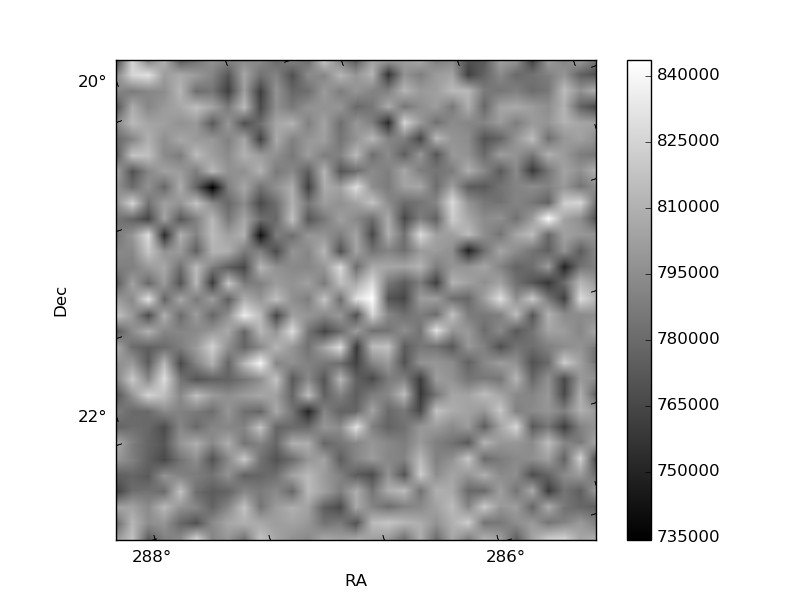
Histogram calculated using DETX and DETY for each event in the final _common_clean file
| Quadrant A |  |
 |
Quadrant B |
|---|---|---|---|
| Quadrant D |  |
 |
Quadrant C |
| Plot type | Count rate plots | Images |
|---|---|---|
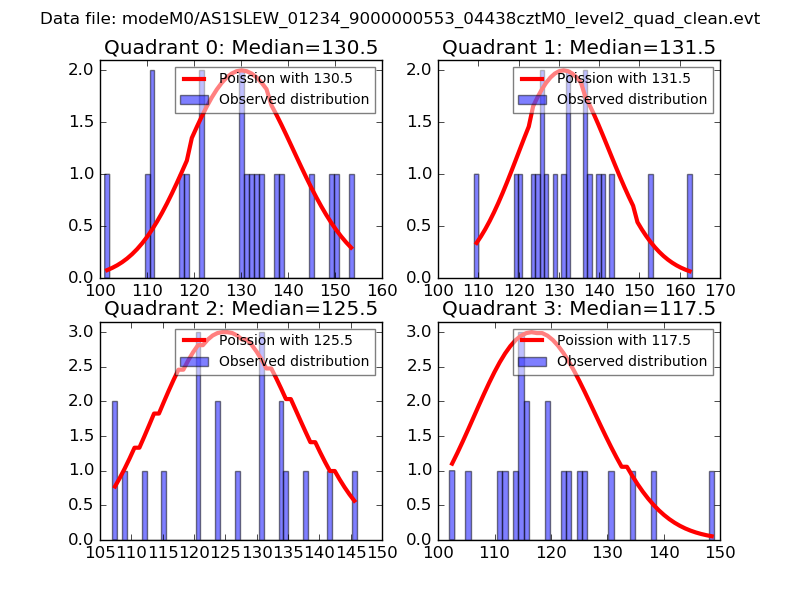
| Comparison with Poisson distribution Blue bars denote a histogram of data divided into 1 sec bins. Red curve is a Poisson curve with rate = median count rate of data. |
 |
 |
| Quadrant-wise count rates Data is divided into 100 sec bins |
 |
|
| Module-wise count rates for Quadrant A Data is divided into 100 sec bins |
 |
 |
| Module-wise count rates for Quadrant B Data is divided into 100 sec bins |
 |
 |
| Module-wise count rates for Quadrant C Data is divided into 100 sec bins |
 |
 |
| Module-wise count rates for Quadrant D Data is divided into 100 sec bins |
 |
 |
| Parameter | Plot |
|---|---|
| CZT HV Monitor | 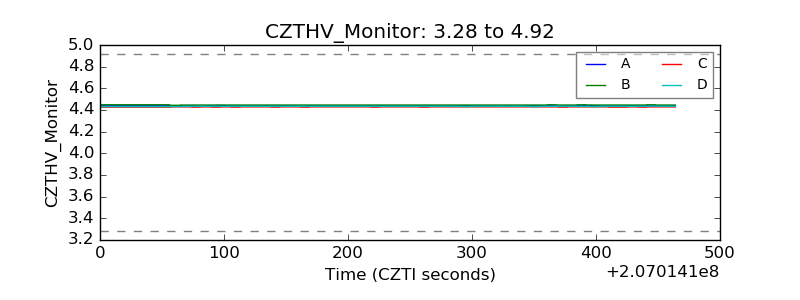 |
| D_VDD | 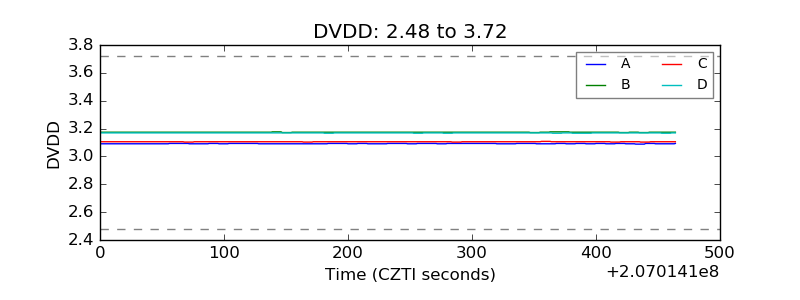 |
| Temperature 1 | 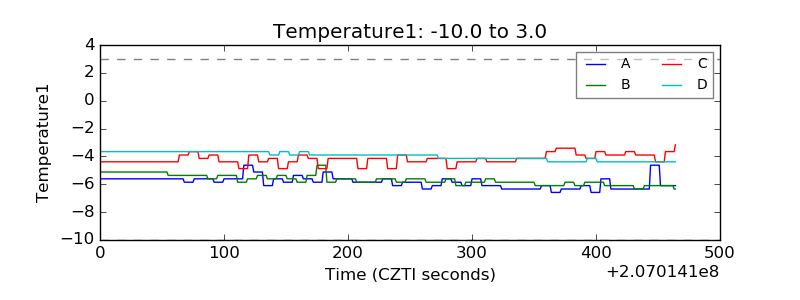 |
| Veto HV Monitor | 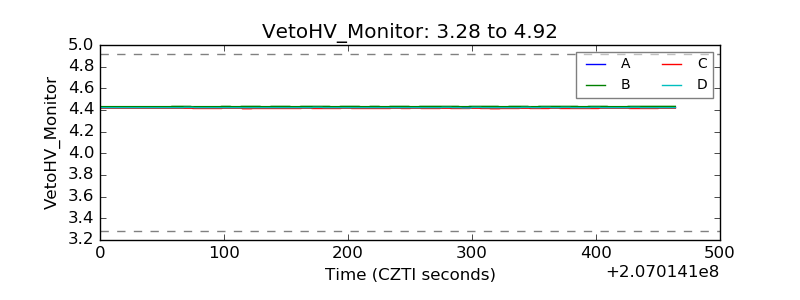 |
| Veto LLD | 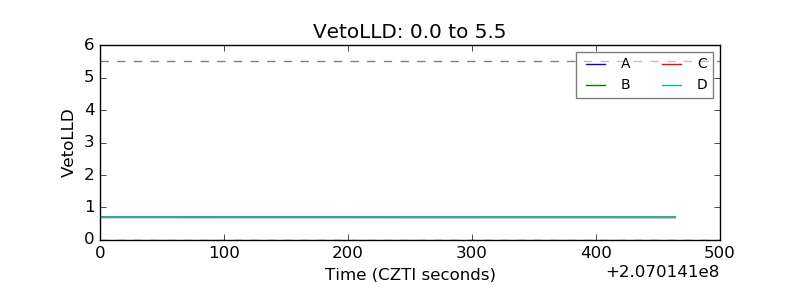 |
| Alpha Counter | 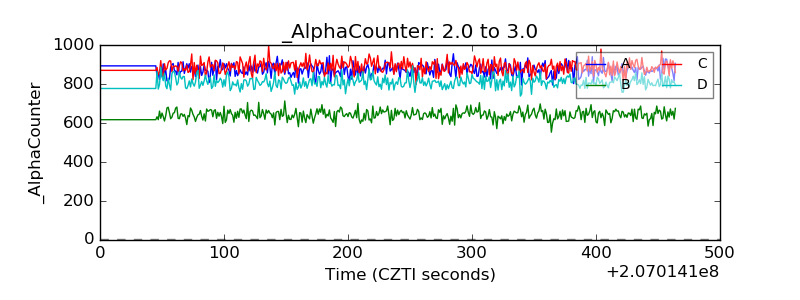 |
| _CPM_Rate | 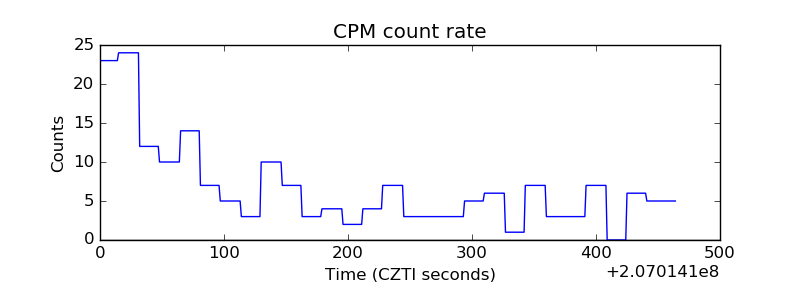 |
| CZT Counter | 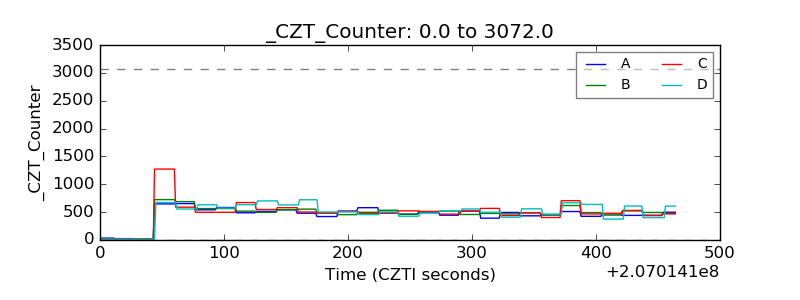 |
| +2.5 Volts monitor |  |
| +5 Volts monitor |  |
| _ROLL_ROT | 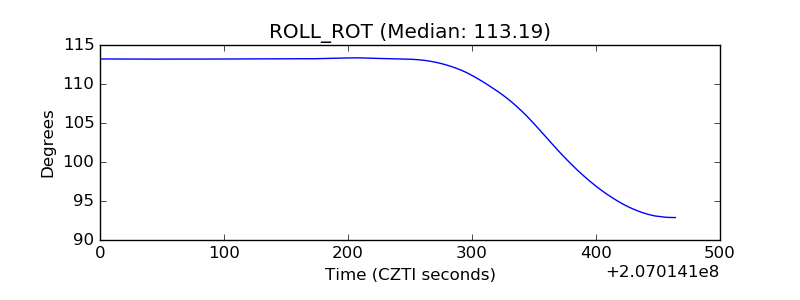 |
| _Roll_DEC | 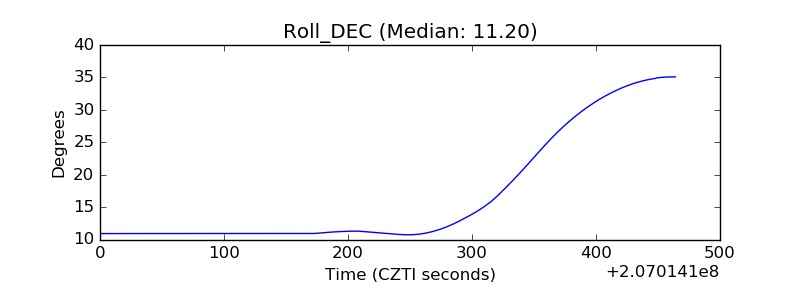 |
| _Roll_RA | 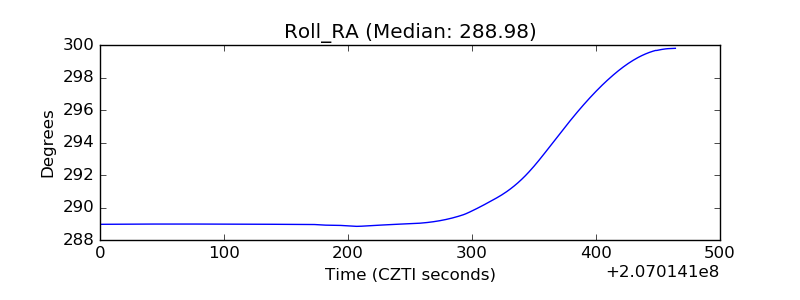 |
| Veto Counter | 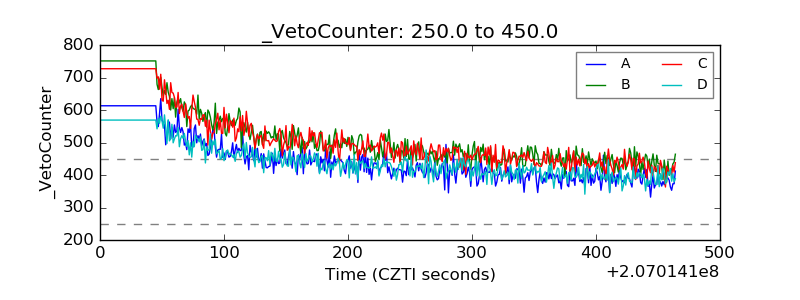 |