| Param | Original file | Final file |
|---|---|---|
| Filename | modeM0/AS1G05_213T01_9000000556cztM0_level2.fits | modeM0/AS1G05_213T01_9000000556cztM0_level2_quad_clean.evt |
| Size (bytes) | 32,376,960 | 21,594,240 |
| Size | 30.9 MB | 20.6 MB |
| Events in quadrant A | 194,496 | 105,210 |
| Events in quadrant B | 188,500 | 104,480 |
| Events in quadrant C | 188,818 | 101,479 |
| Events in quadrant D | 163,190 | 95,907 |
| Mode M0 | |||
|---|---|---|---|
| Quadrant | BADHDUFLAG | Total packets | Discarded packets |
| A | 0 | 7157 | 0 |
| B | 0 | 7060 | 0 |
| C | 0 | 7031 | 0 |
| D | 0 | 7186 | 0 |
| Mode SS | |||
|---|---|---|---|
| Quadrant | BADHDUFLAG | Total packets | Discarded packets |
| A | 0 | 72 | 0 |
| B | 0 | 72 | 0 |
| C | 0 | 72 | 0 |
| D | 0 | 72 | 0 |
| Mode M9 | |||
|---|---|---|---|
| Quadrant | BADHDUFLAG | Total packets | Discarded packets |
| A | 0 | 1 | 0 |
| B | 0 | 1 | 0 |
| C | 0 | 1 | 0 |
| D | 0 | 1 | 0 |
| Quadrant | Total seconds | Saturated seconds | Saturation percentage |
|---|---|---|---|
| A | 3466 | 37 | 1.067513% |
| B | 3466 | 43 | 1.240623% |
| C | 3466 | 32 | 0.923254% |
| D | 3466 | 30 | 0.865551% |
Noise dominated data is calculated using 1-second bins in cleaned event files. If a bin has >2000 counts, and if more than 50% of those come from <1% of pixels, then it is considered to be noise-dominated and hence unusable.
| Quadrant | # 1 sec bins | Bins with >0 counts | Bins with >2000 counts | High rate bins dominated by noise | Noise dominated (total time) | Noise dominated (detector-on time) | Marked lightcurve |
|---|---|---|---|---|---|---|---|
| A | 3466 | 3466 | 0 | 0 | 0.00% | 0.00% |  |
| B | 3466 | 3466 | 0 | 0 | 0.00% | 0.00% |  |
| C | 3466 | 3466 | 0 | 0 | 0.00% | 0.00% |  |
| D | 3466 | 3466 | 0 | 0 | 0.00% | 0.00% |  |
Top three noisy pixels from each quadrant. If the there are fewer than three noisy pixels in the level2.evt file, extra rows are filled as -1
| Pixel properties | Quadrant properties | ||||||
|---|---|---|---|---|---|---|---|
| Quadrant | DetID | PixID | Counts | Sigma | Mean | Median | Sigma |
| A | 14 | 188 | 195 | 10.21 | 50 | 48 | 14.4 |
| A | 14 | 204 | 171 | 8.55 | 50 | 48 | 14.4 |
| A | 0 | 29 | 155 | 7.43 | 50 | 48 | 14.4 |
| B | 2 | 9 | 176 | 10.49 | 49 | 48 | 12.2 |
| B | 5 | 128 | 140 | 7.54 | 49 | 48 | 12.2 |
| B | 14 | 254 | 132 | 6.89 | 49 | 48 | 12.2 |
| C | 12 | 250 | 143 | 6.53 | 49 | 46 | 14.9 |
| C | 1 | 81 | 139 | 6.26 | 49 | 46 | 14.9 |
| C | 2 | 127 | 138 | 6.19 | 49 | 46 | 14.9 |
| D | 11 | 82 | 135 | 6.62 | 46 | 42 | 14.0 |
| D | 3 | 14 | 134 | 6.55 | 46 | 42 | 14.0 |
| D | 6 | 114 | 131 | 6.34 | 46 | 42 | 14.0 |
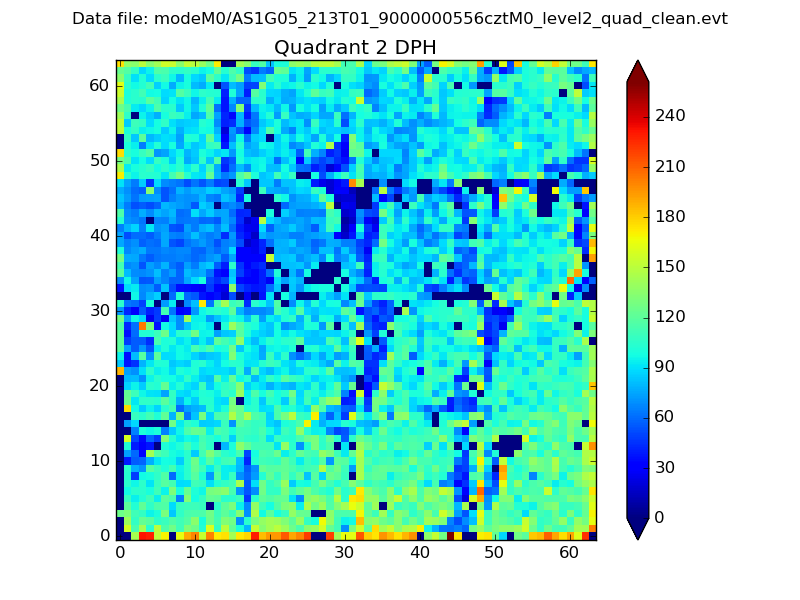
Histogram calculated using DETX and DETY for each event in the final _common_clean file
| Quadrant A | 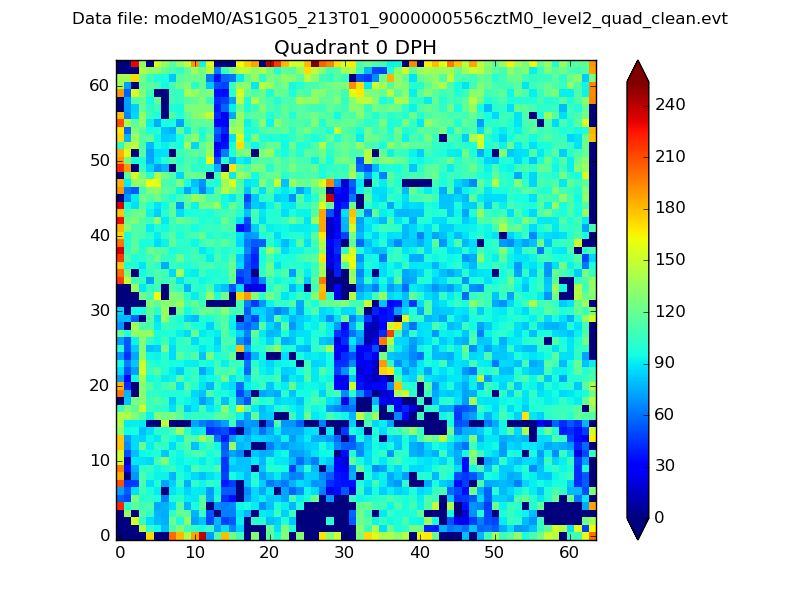 |
 |
Quadrant B |
|---|---|---|---|
| Quadrant D |  |
 |
Quadrant C |
| Plot type | Count rate plots | Images |
|---|---|---|
| Comparison with Poisson distribution Blue bars denote a histogram of data divided into 1 sec bins. Red curve is a Poisson curve with rate = median count rate of data. |
 |
 |
| Quadrant-wise count rates Data is divided into 100 sec bins |
 |
|
| Module-wise count rates for Quadrant A Data is divided into 100 sec bins |
 |
 |
| Module-wise count rates for Quadrant B Data is divided into 100 sec bins |
 |
 |
| Module-wise count rates for Quadrant C Data is divided into 100 sec bins |
 |
 |
| Module-wise count rates for Quadrant D Data is divided into 100 sec bins |
 |
 |
| Parameter | Plot |
|---|---|
| CZT HV Monitor |  |
| D_VDD | 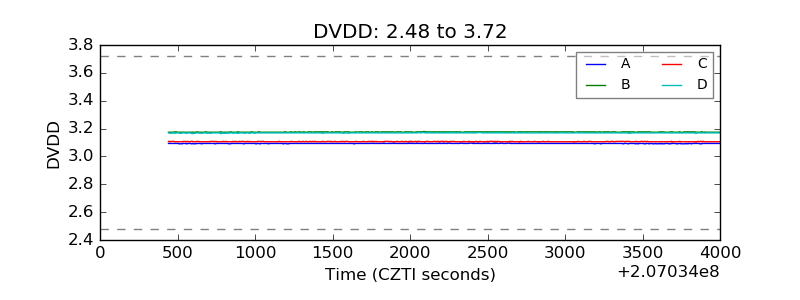 |
| Temperature 1 |  |
| Veto HV Monitor |  |
| Veto LLD |  |
| Alpha Counter |  |
| _CPM_Rate |  |
| CZT Counter |  |
| +2.5 Volts monitor |  |
| +5 Volts monitor |  |
| _ROLL_ROT |  |
| _Roll_DEC |  |
| _Roll_RA |  |
| Veto Counter |  |