| Param | Original file | Final file |
|---|---|---|
| Filename | modeM0/AS1G05_213T01_9000000556_04443cztM0_level2.evt | modeM0/AS1G05_213T01_9000000556_04443cztM0_level2_quad_clean.evt |
| Size (bytes) | 210,830,400 | 57,525,120 |
| Size | 201.1 MB | 54.9 MB |
| Events in quadrant A | 1,580,081 | 375,730 |
| Events in quadrant B | 1,543,953 | 376,967 |
| Events in quadrant C | 1,494,417 | 375,594 |
| Events in quadrant D | 1,528,556 | 367,710 |
| Mode M0 | |||
|---|---|---|---|
| Quadrant | BADHDUFLAG | Total packets | Discarded packets |
| A | 0 | 7157 | 0 |
| B | 0 | 7060 | 0 |
| C | 0 | 7031 | 0 |
| D | 0 | 7186 | 0 |
| Mode SS | |||
|---|---|---|---|
| Quadrant | BADHDUFLAG | Total packets | Discarded packets |
| A | 0 | 72 | 0 |
| B | 0 | 72 | 0 |
| C | 0 | 72 | 0 |
| D | 0 | 72 | 0 |
| Mode M9 | |||
|---|---|---|---|
| Quadrant | BADHDUFLAG | Total packets | Discarded packets |
| A | 0 | 1 | 0 |
| B | 0 | 1 | 0 |
| C | 0 | 1 | 0 |
| D | 0 | 1 | 0 |
| Quadrant | Total seconds | Saturated seconds | Saturation percentage |
|---|---|---|---|
| A | 3466 | 37 | 1.067513% |
| B | 3466 | 43 | 1.240623% |
| C | 3466 | 32 | 0.923254% |
| D | 3466 | 30 | 0.865551% |
Noise dominated data is calculated using 1-second bins in cleaned event files. If a bin has >2000 counts, and if more than 50% of those come from <1% of pixels, then it is considered to be noise-dominated and hence unusable.
| Quadrant | # 1 sec bins | Bins with >0 counts | Bins with >2000 counts | High rate bins dominated by noise | Noise dominated (total time) | Noise dominated (detector-on time) | Marked lightcurve |
|---|---|---|---|---|---|---|---|
| A | 3466 | 3466 | 1 | 1 | 0.03% | 0.03% | 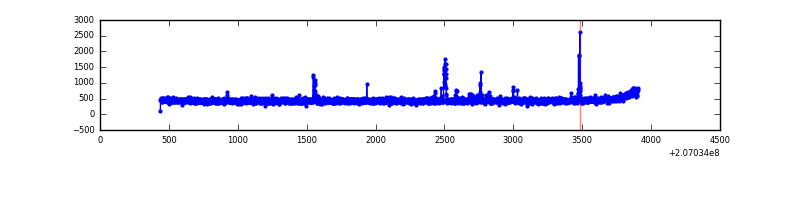 |
| B | 3466 | 3466 | 0 | 0 | 0.00% | 0.00% | 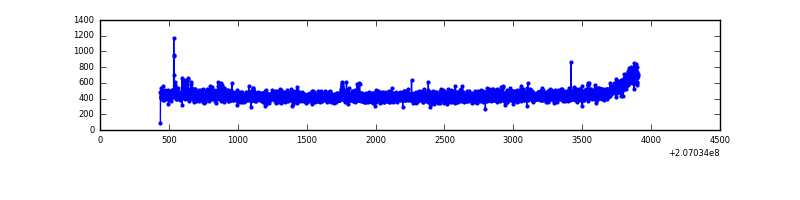 |
| C | 3466 | 3466 | 0 | 0 | 0.00% | 0.00% | 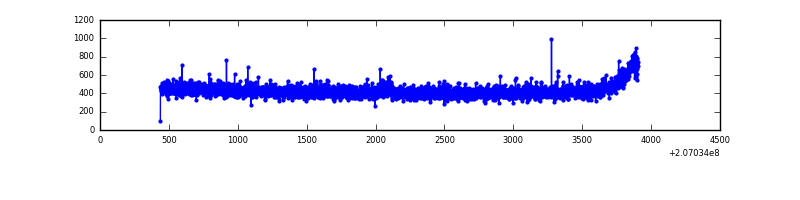 |
| D | 3466 | 3466 | 4 | 4 | 0.12% | 0.12% | 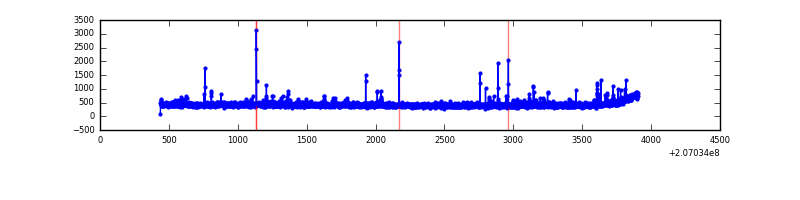 |
Top three noisy pixels from each quadrant. If the there are fewer than three noisy pixels in the level2.evt file, extra rows are filled as -1
| Pixel properties | Quadrant properties | ||||||
|---|---|---|---|---|---|---|---|
| Quadrant | DetID | PixID | Counts | Sigma | Mean | Median | Sigma |
| A | 0 | 118 | 29239 | 355.22 | 396 | 388 | 81.2 |
| A | 0 | 50 | 17906 | 215.69 | 396 | 388 | 81.2 |
| A | 0 | 226 | 6471 | 74.9 | 396 | 388 | 81.2 |
| B | 4 | 48 | 12817 | 164.11 | 395 | 386 | 75.7 |
| B | 12 | 111 | 6538 | 81.22 | 395 | 386 | 75.7 |
| B | 11 | 111 | 5337 | 65.36 | 395 | 386 | 75.7 |
| C | 9 | 16 | 15965 | 177.43 | 378 | 379 | 87.8 |
| C | 13 | 61 | 3176 | 31.84 | 378 | 379 | 87.8 |
| C | 9 | 54 | 1566 | 13.51 | 378 | 379 | 87.8 |
| D | 8 | 112 | 25096 | 269.11 | 381 | 369 | 91.9 |
| D | 4 | 95 | 22557 | 241.48 | 381 | 369 | 91.9 |
| D | 2 | 206 | 10660 | 112.0 | 381 | 369 | 91.9 |
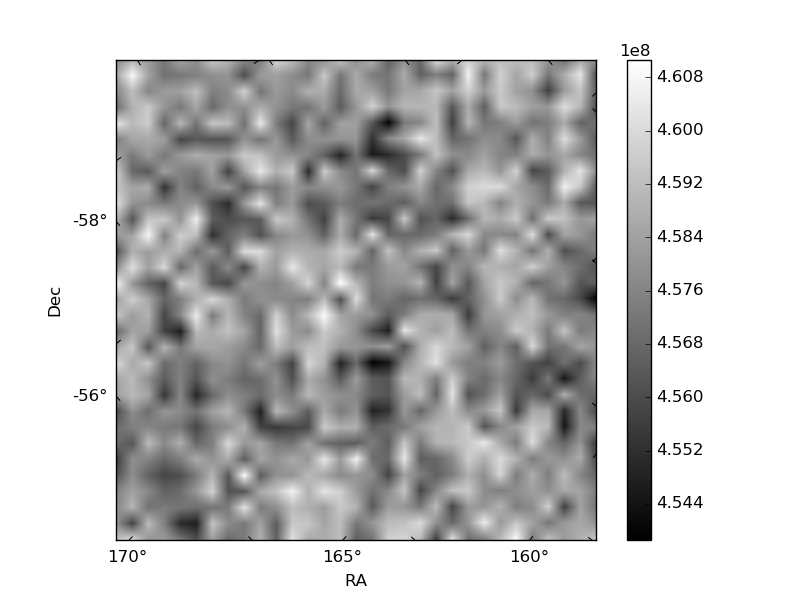
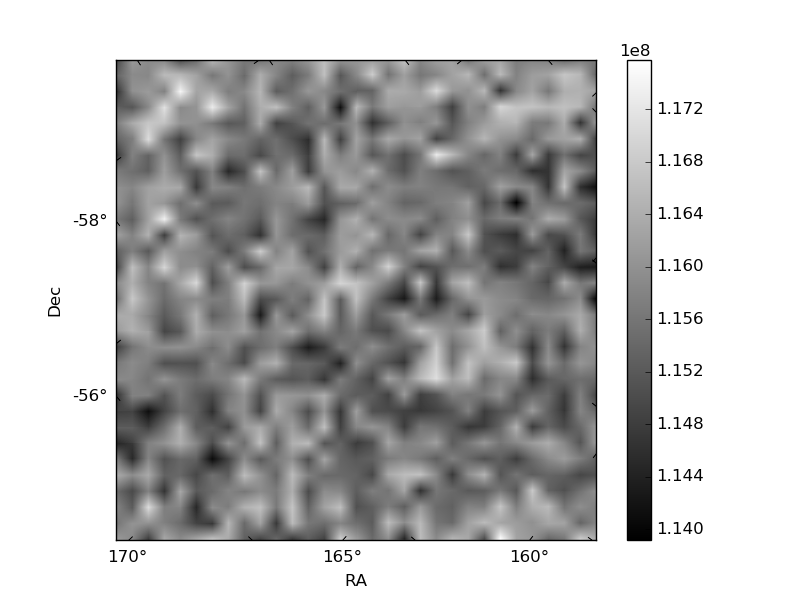
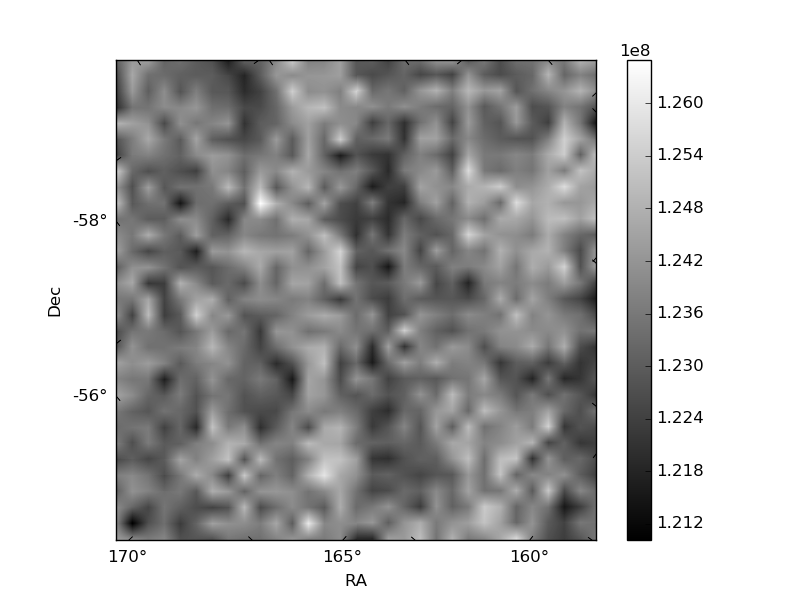
Histogram calculated using DETX and DETY for each event in the final _common_clean file
| Quadrant A | 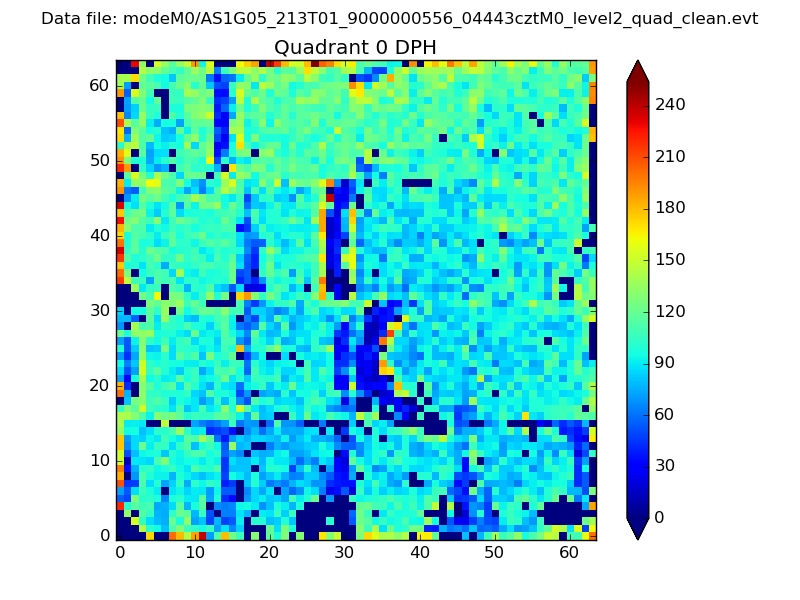 |
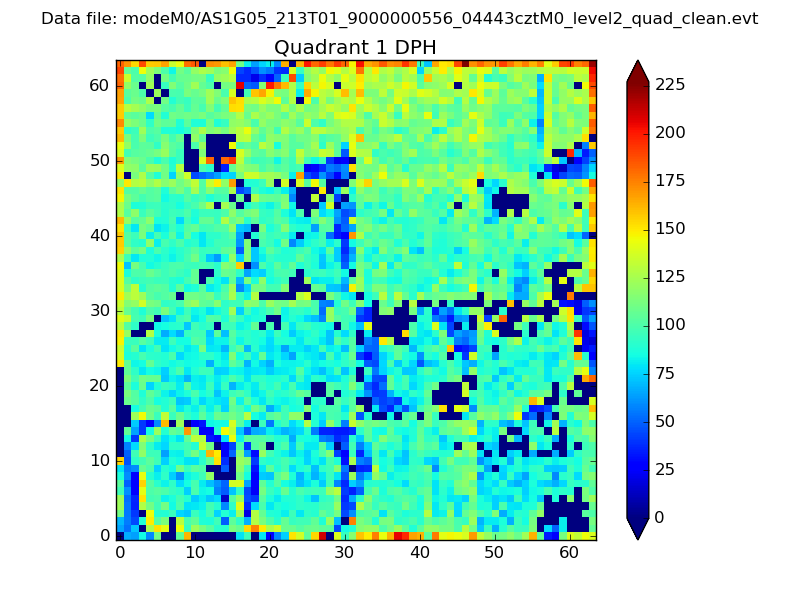 |
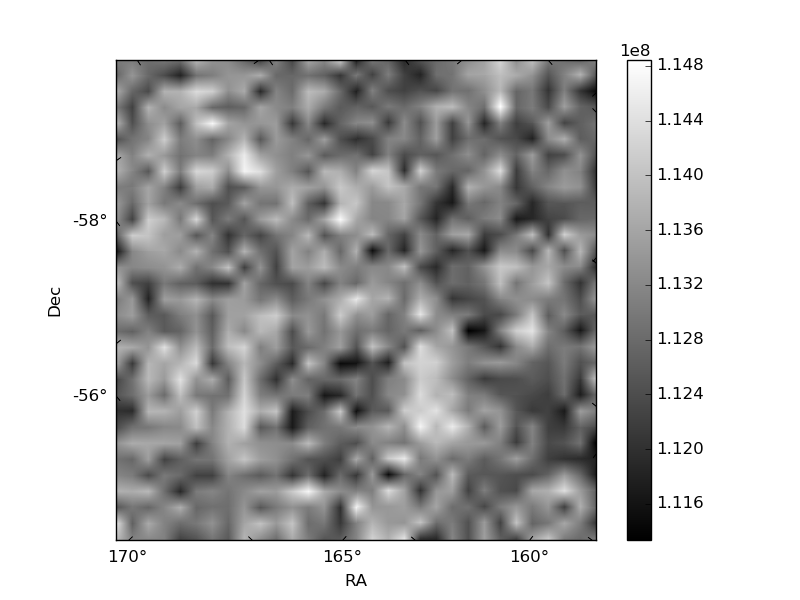
Quadrant B |
|---|---|---|---|
| Quadrant D | 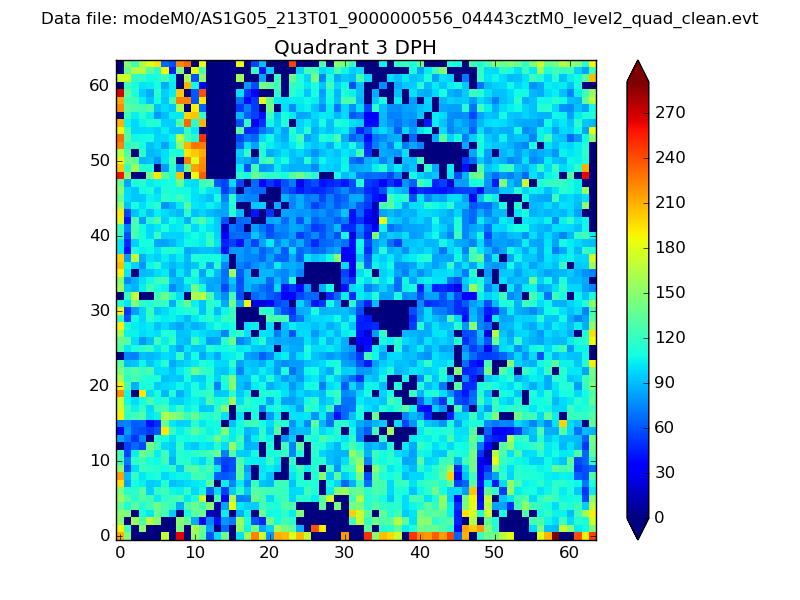 |
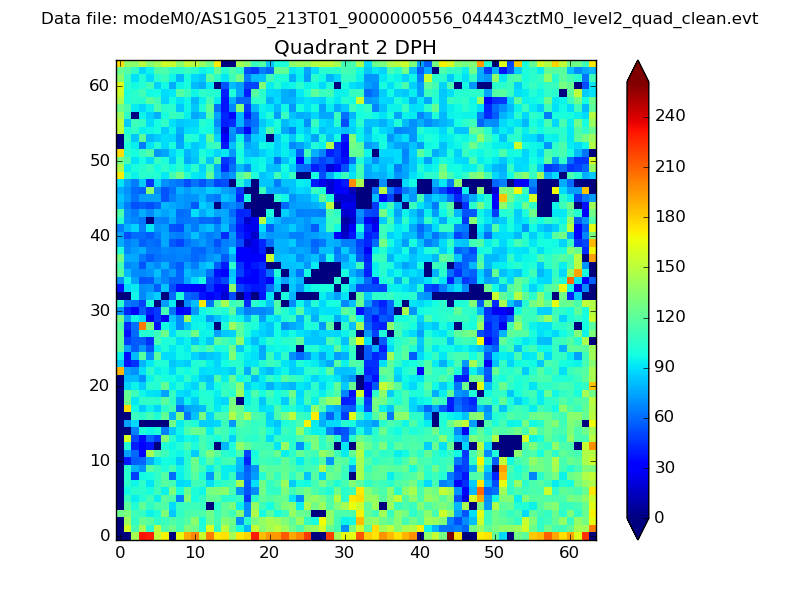 |
Quadrant C |
| Plot type | Count rate plots | Images |
|---|---|---|
| Comparison with Poisson distribution Blue bars denote a histogram of data divided into 1 sec bins. Red curve is a Poisson curve with rate = median count rate of data. |
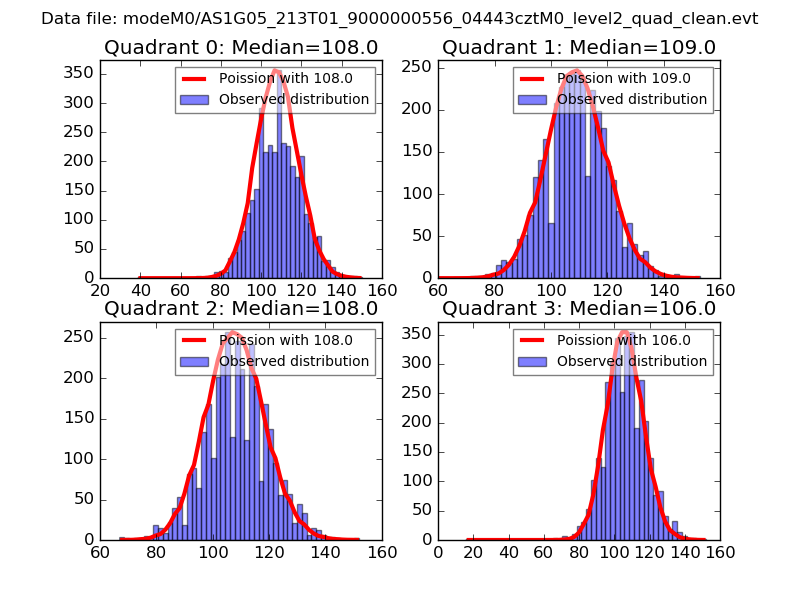 |
 |
| Quadrant-wise count rates Data is divided into 100 sec bins |
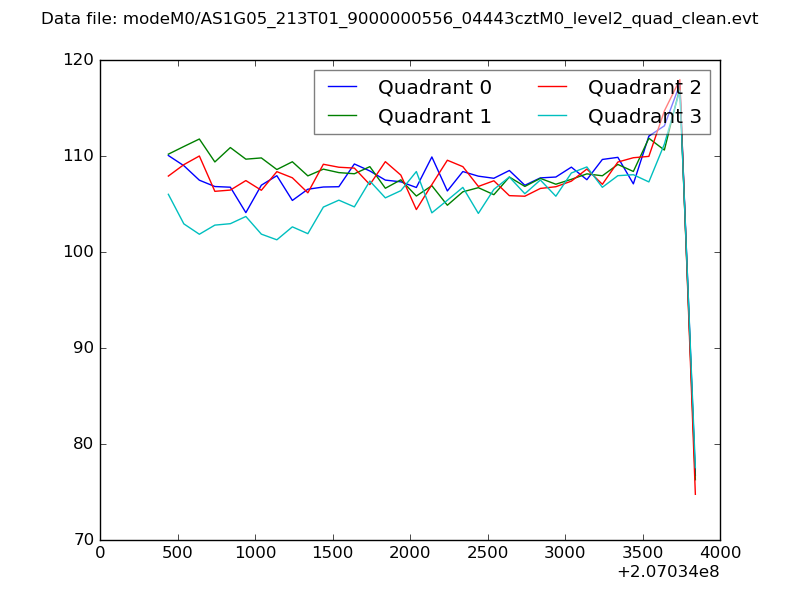 |
|
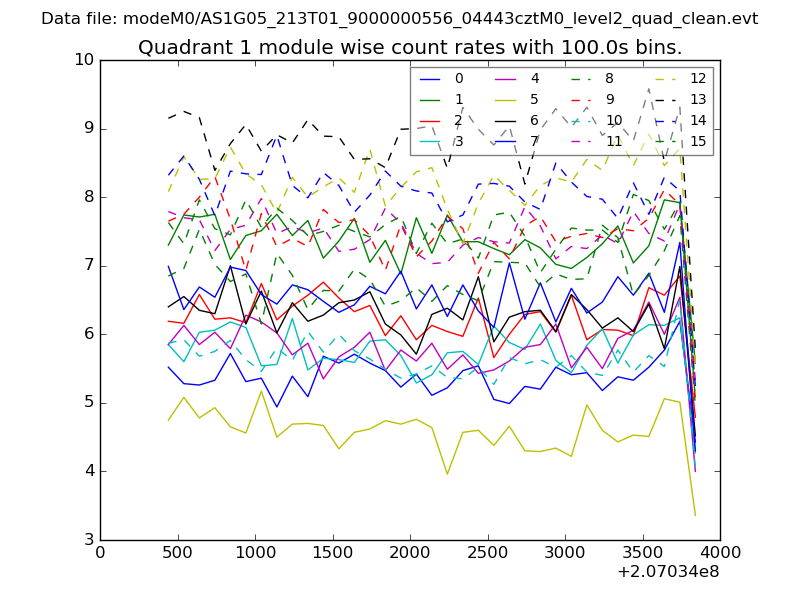
| Module-wise count rates for Quadrant A Data is divided into 100 sec bins |
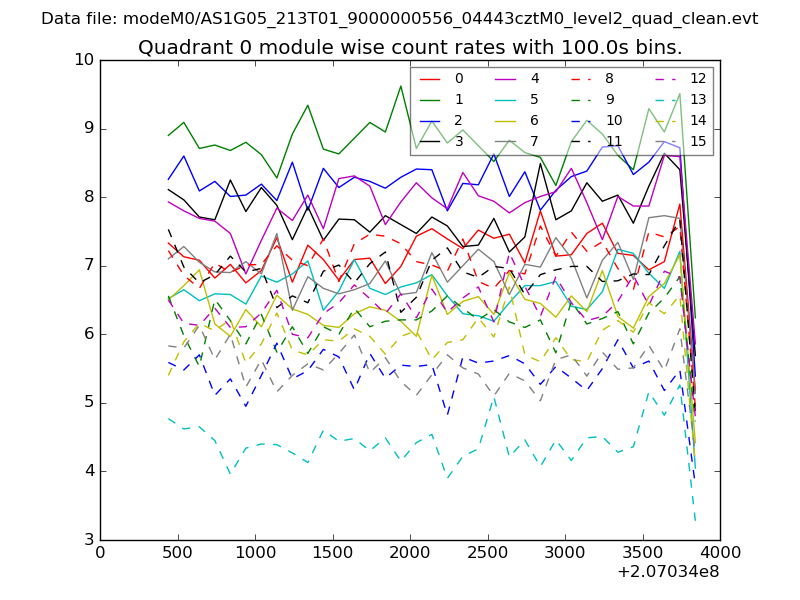 |
 |
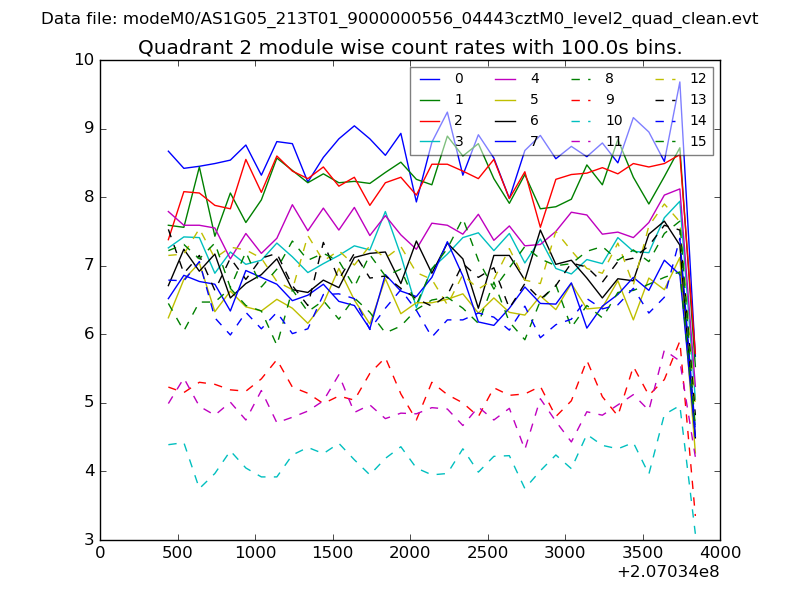
| Module-wise count rates for Quadrant B Data is divided into 100 sec bins |
 |
 |
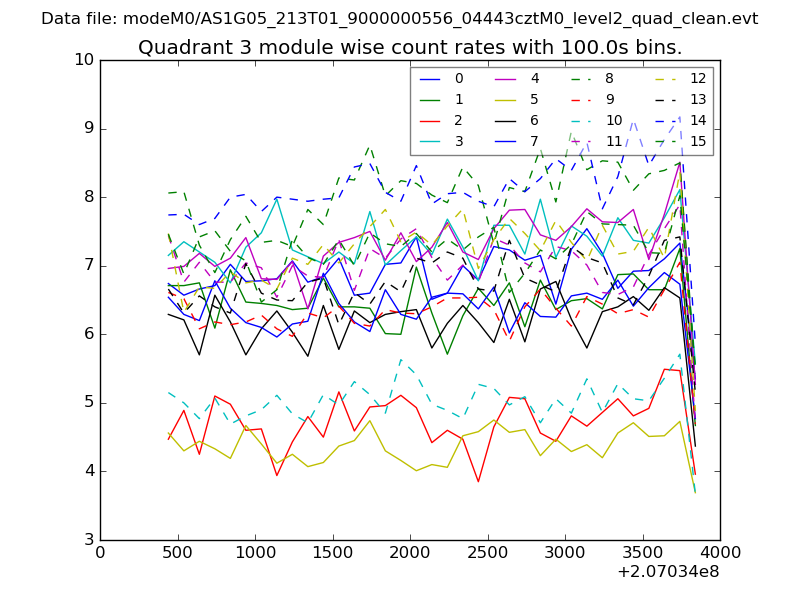
| Module-wise count rates for Quadrant C Data is divided into 100 sec bins |
 |
 |
| Module-wise count rates for Quadrant D Data is divided into 100 sec bins |
 |
 |
| Parameter | Plot |
|---|---|
| CZT HV Monitor | 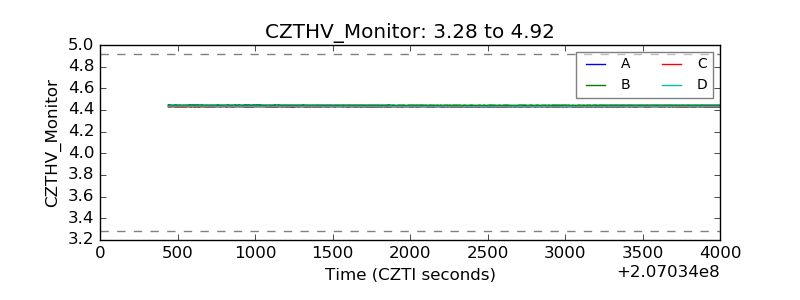 |
| D_VDD | 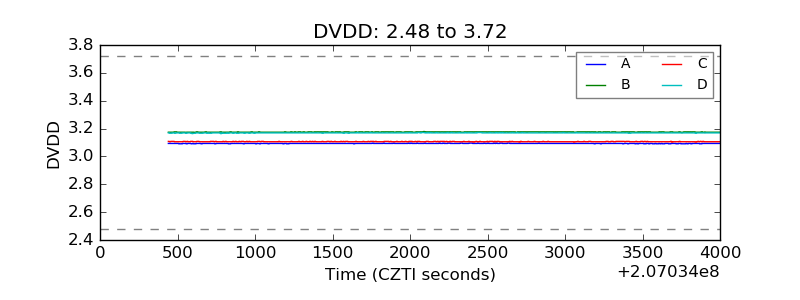 |
| Temperature 1 | 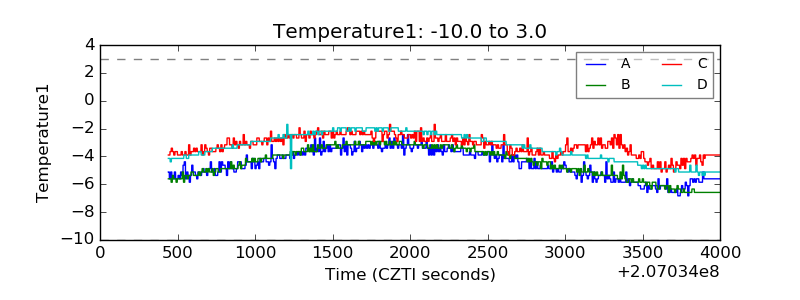 |
| Veto HV Monitor | 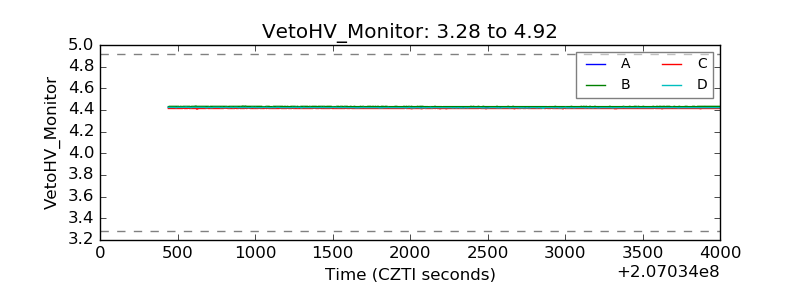 |
| Veto LLD | 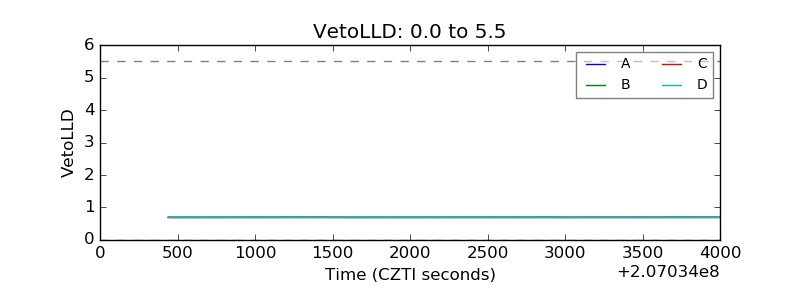 |
| Alpha Counter |  |
| _CPM_Rate | 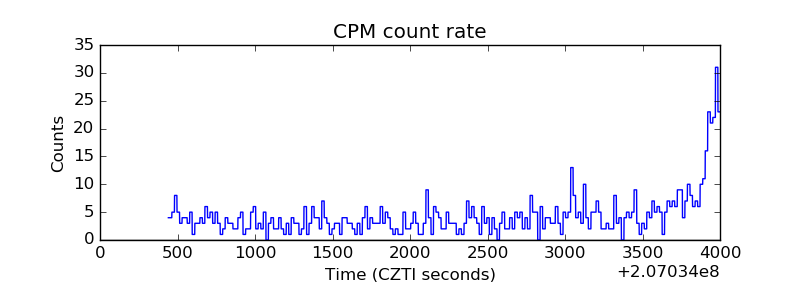 |
| CZT Counter | 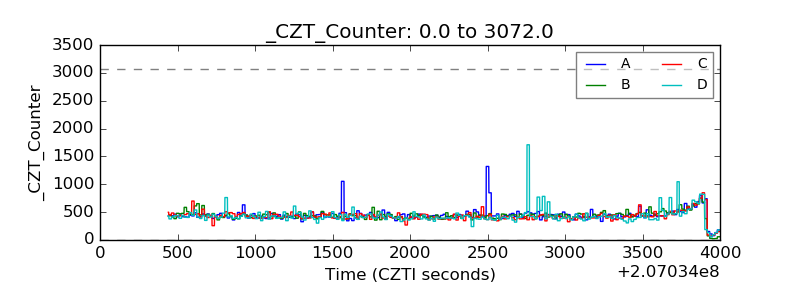 |
| +2.5 Volts monitor |  |
| +5 Volts monitor |  |
| _ROLL_ROT | 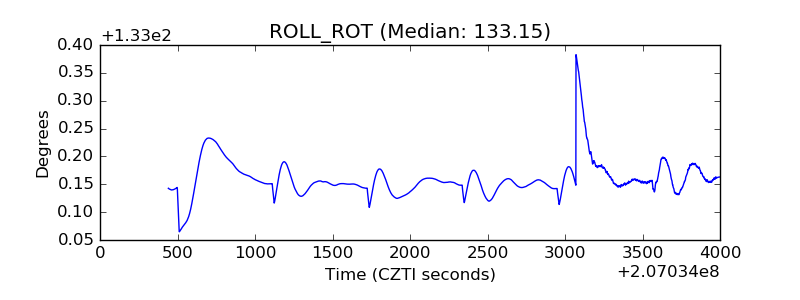 |
| _Roll_DEC | 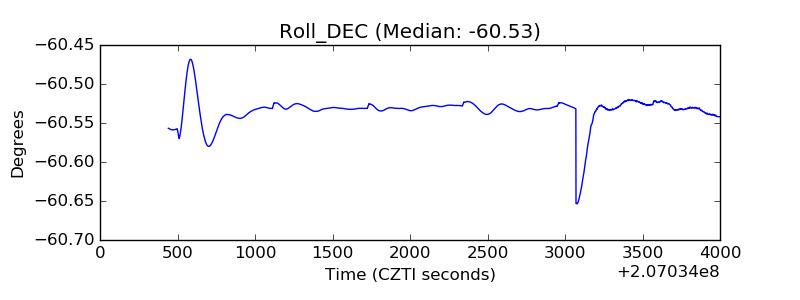 |
| _Roll_RA | 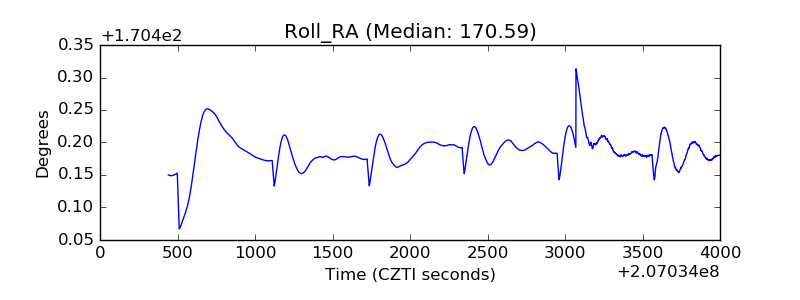 |
| Veto Counter | 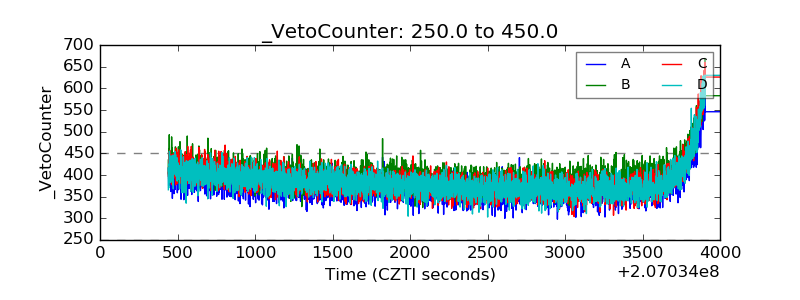 |