| Param | Original file | Final file |
|---|---|---|
| Filename | modeM0/AS1G05_213T02_9000000558cztM0_level2.fits | modeM0/AS1G05_213T02_9000000558cztM0_level2_quad_clean.evt |
| Size (bytes) | 79,894,080 | 74,249,280 |
| Size | 76.2 MB | 70.8 MB |
| Events in quadrant A | 487,114 | 435,779 |
| Events in quadrant B | 475,058 | 439,510 |
| Events in quadrant C | 483,058 | 425,413 |
| Events in quadrant D | 415,588 | 387,944 |
| Mode M0 | |||
|---|---|---|---|
| Quadrant | BADHDUFLAG | Total packets | Discarded packets |
| A | 0 | 16876 | 0 |
| B | 0 | 16552 | 0 |
| C | 0 | 16807 | 0 |
| D | 0 | 18951 | 0 |
| Mode SS | |||
|---|---|---|---|
| Quadrant | BADHDUFLAG | Total packets | Discarded packets |
| A | 0 | 162 | 0 |
| B | 0 | 162 | 0 |
| C | 0 | 162 | 0 |
| D | 0 | 162 | 0 |
| Mode M9 | |||
|---|---|---|---|
| Quadrant | BADHDUFLAG | Total packets | Discarded packets |
| A | 0 | 15 | 0 |
| B | 0 | 15 | 0 |
| C | 0 | 15 | 0 |
| D | 0 | 15 | 0 |
| Quadrant | Total seconds | Saturated seconds | Saturation percentage |
|---|---|---|---|
| A | 8048 | 63 | 0.782803% |
| B | 8048 | 66 | 0.820080% |
| C | 8048 | 78 | 0.969185% |
| D | 8048 | 118 | 1.466203% |
Noise dominated data is calculated using 1-second bins in cleaned event files. If a bin has >2000 counts, and if more than 50% of those come from <1% of pixels, then it is considered to be noise-dominated and hence unusable.
| Quadrant | # 1 sec bins | Bins with >0 counts | Bins with >2000 counts | High rate bins dominated by noise | Noise dominated (total time) | Noise dominated (detector-on time) | Marked lightcurve |
|---|---|---|---|---|---|---|---|
| A | 9317 | 8047 | 0 | 0 | 0.00% | 0.00% |  |
| B | 9317 | 8047 | 0 | 0 | 0.00% | 0.00% |  |
| C | 9317 | 8047 | 0 | 0 | 0.00% | 0.00% |  |
| D | 9317 | 8047 | 0 | 0 | 0.00% | 0.00% |  |
Top three noisy pixels from each quadrant. If the there are fewer than three noisy pixels in the level2.evt file, extra rows are filled as -1
| Pixel properties | Quadrant properties | ||||||
|---|---|---|---|---|---|---|---|
| Quadrant | DetID | PixID | Counts | Sigma | Mean | Median | Sigma |
| A | 0 | 29 | 417 | 8.68 | 127 | 119 | 34.3 |
| A | 7 | 110 | 400 | 8.19 | 127 | 119 | 34.3 |
| A | 0 | 30 | 365 | 7.17 | 127 | 119 | 34.3 |
| B | 2 | 9 | 411 | 10.58 | 125 | 120 | 27.5 |
| B | 12 | 226 | 346 | 8.22 | 125 | 120 | 27.5 |
| B | 3 | 17 | 320 | 7.27 | 125 | 120 | 27.5 |
| C | 9 | 233 | 362 | 6.9 | 127 | 118 | 35.4 |
| C | 1 | 80 | 341 | 6.3 | 127 | 118 | 35.4 |
| C | 12 | 241 | 329 | 5.96 | 127 | 118 | 35.4 |
| D | 11 | 82 | 338 | 7.08 | 118 | 107 | 32.6 |
| D | 6 | 83 | 316 | 6.41 | 118 | 107 | 32.6 |
| D | 1 | 19 | 314 | 6.35 | 118 | 107 | 32.6 |
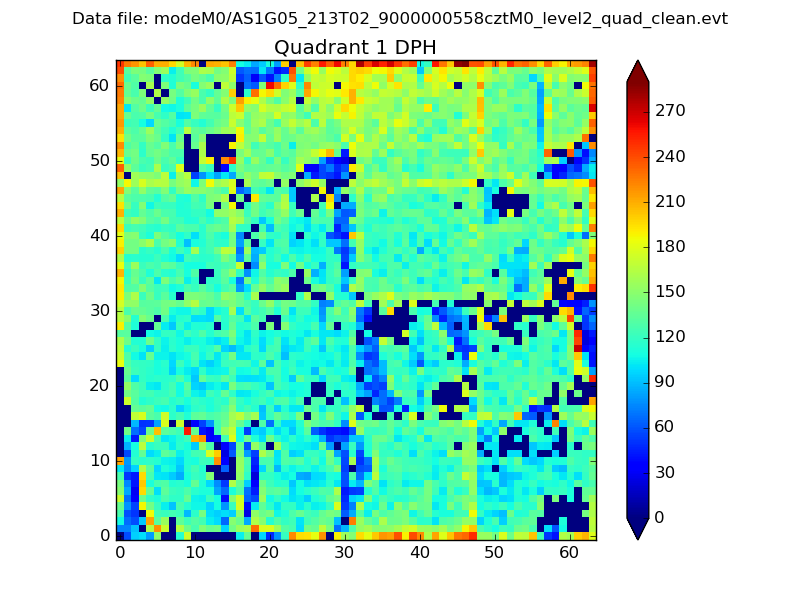
Histogram calculated using DETX and DETY for each event in the final _common_clean file
| Quadrant A |  |
 |
Quadrant B |
|---|---|---|---|
| Quadrant D |  |
 |
Quadrant C |
| Plot type | Count rate plots | Images |
|---|---|---|
| Comparison with Poisson distribution Blue bars denote a histogram of data divided into 1 sec bins. Red curve is a Poisson curve with rate = median count rate of data. |
 |
 |
| Quadrant-wise count rates Data is divided into 100 sec bins |
 |
|
| Module-wise count rates for Quadrant A Data is divided into 100 sec bins |
 |
 |
| Module-wise count rates for Quadrant B Data is divided into 100 sec bins |
 |
 |
| Module-wise count rates for Quadrant C Data is divided into 100 sec bins |
 |
 |
| Module-wise count rates for Quadrant D Data is divided into 100 sec bins |
 |
 |
| Parameter | Plot |
|---|---|
| CZT HV Monitor |  |
| D_VDD |  |
| Temperature 1 |  |
| Veto HV Monitor |  |
| Veto LLD |  |
| Alpha Counter | 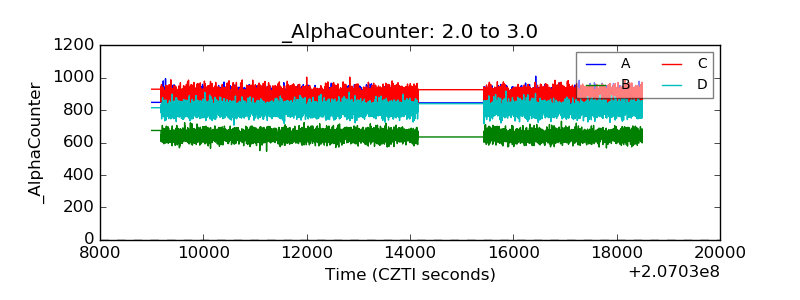 |
| _CPM_Rate |  |
| CZT Counter |  |
| +2.5 Volts monitor |  |
| +5 Volts monitor |  |
| _ROLL_ROT |  |
| _Roll_DEC | 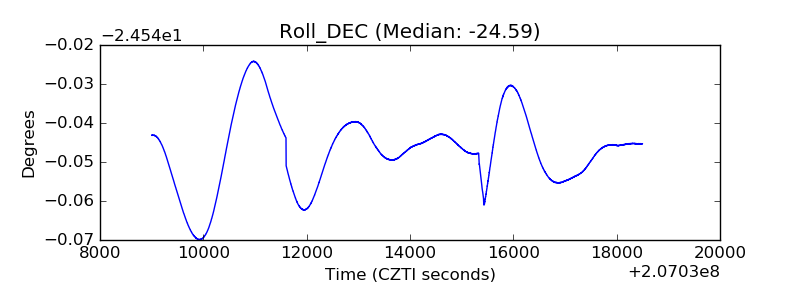 |
| _Roll_RA | 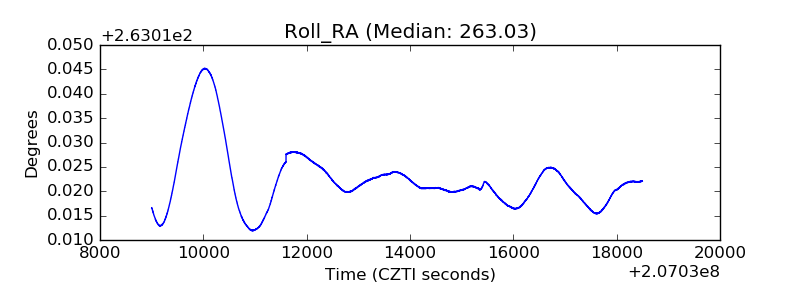 |
| Veto Counter |  |