| Param | Original file | Final file |
|---|---|---|
| Filename | modeM0/AS1G05_213T02_9000000558_04445cztM0_level2.evt | modeM0/AS1G05_213T02_9000000558_04445cztM0_level2_quad_clean.evt |
| Size (bytes) | 181,569,600 | 26,985,600 |
| Size | 173.2 MB | 25.7 MB |
| Events in quadrant A | 1,386,419 | 153,621 |
| Events in quadrant B | 1,311,794 | 155,681 |
| Events in quadrant C | 1,298,537 | 155,830 |
| Events in quadrant D | 1,306,470 | 148,324 |
| Mode M0 | |||
|---|---|---|---|
| Quadrant | BADHDUFLAG | Total packets | Discarded packets |
| A | 0 | 5938 | 0 |
| B | 0 | 5701 | 0 |
| C | 0 | 5739 | 0 |
| D | 0 | 5807 | 0 |
| Mode SS | |||
|---|---|---|---|
| Quadrant | BADHDUFLAG | Total packets | Discarded packets |
| A | 0 | 56 | 0 |
| B | 0 | 56 | 0 |
| C | 0 | 56 | 0 |
| D | 0 | 56 | 0 |
| Quadrant | Total seconds | Saturated seconds | Saturation percentage |
|---|---|---|---|
| A | 2845 | 10 | 0.351494% |
| B | 2845 | 1 | 0.035149% |
| C | 2845 | 2 | 0.070299% |
| D | 2845 | 1 | 0.035149% |
Noise dominated data is calculated using 1-second bins in cleaned event files. If a bin has >2000 counts, and if more than 50% of those come from <1% of pixels, then it is considered to be noise-dominated and hence unusable.
| Quadrant | # 1 sec bins | Bins with >0 counts | Bins with >2000 counts | High rate bins dominated by noise | Noise dominated (total time) | Noise dominated (detector-on time) | Marked lightcurve |
|---|---|---|---|---|---|---|---|
| A | 2845 | 2845 | 5 | 5 | 0.18% | 0.18% | 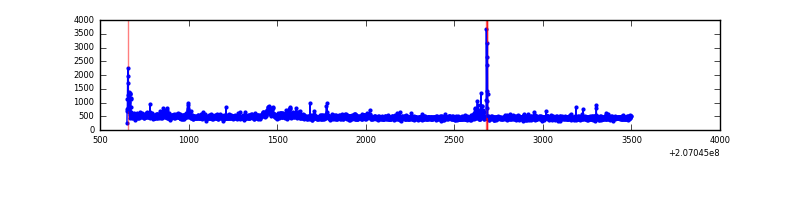 |
| B | 2845 | 2845 | 0 | 0 | 0.00% | 0.00% | 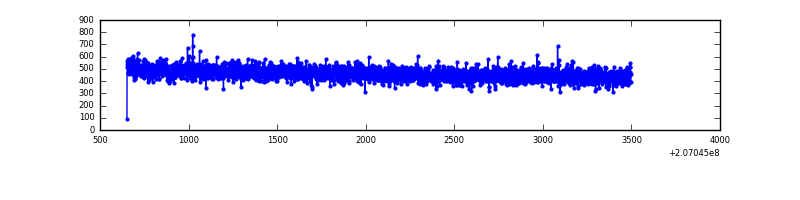 |
| C | 2845 | 2845 | 2 | 2 | 0.07% | 0.07% | 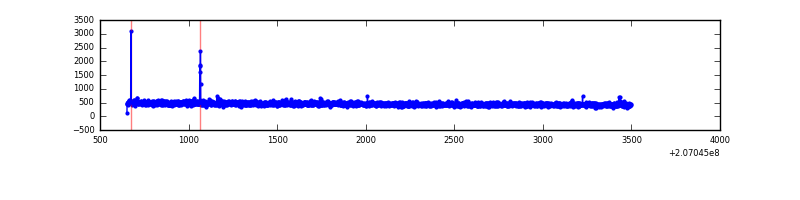 |
| D | 2845 | 2845 | 4 | 4 | 0.14% | 0.14% | 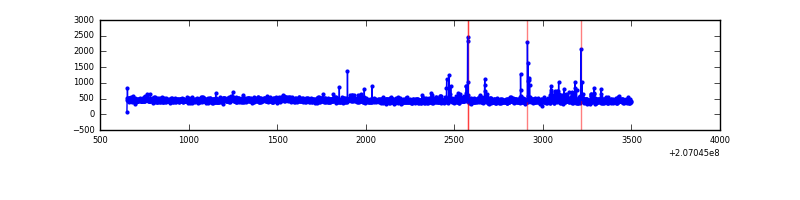 |
Top three noisy pixels from each quadrant. If the there are fewer than three noisy pixels in the level2.evt file, extra rows are filled as -1
| Pixel properties | Quadrant properties | ||||||
|---|---|---|---|---|---|---|---|
| Quadrant | DetID | PixID | Counts | Sigma | Mean | Median | Sigma |
| A | 0 | 50 | 79034 | 1129.24 | 336 | 330 | 69.7 |
| A | 0 | 13 | 9112 | 126.0 | 336 | 330 | 69.7 |
| A | 0 | 226 | 3497 | 45.44 | 336 | 330 | 69.7 |
| B | 12 | 111 | 5731 | 82.22 | 338 | 330 | 65.7 |
| B | 11 | 111 | 4736 | 67.07 | 338 | 330 | 65.7 |
| B | 8 | 61 | 3342 | 45.85 | 338 | 330 | 65.7 |
| C | 9 | 247 | 9514 | 119.93 | 327 | 329 | 76.6 |
| C | 0 | 239 | 3106 | 36.26 | 327 | 329 | 76.6 |
| C | 9 | 16 | 2952 | 34.25 | 327 | 329 | 76.6 |
| D | 9 | 35 | 22860 | 284.17 | 326 | 317 | 79.3 |
| D | 4 | 95 | 21084 | 261.78 | 326 | 317 | 79.3 |
| D | 7 | 223 | 11249 | 137.8 | 326 | 317 | 79.3 |
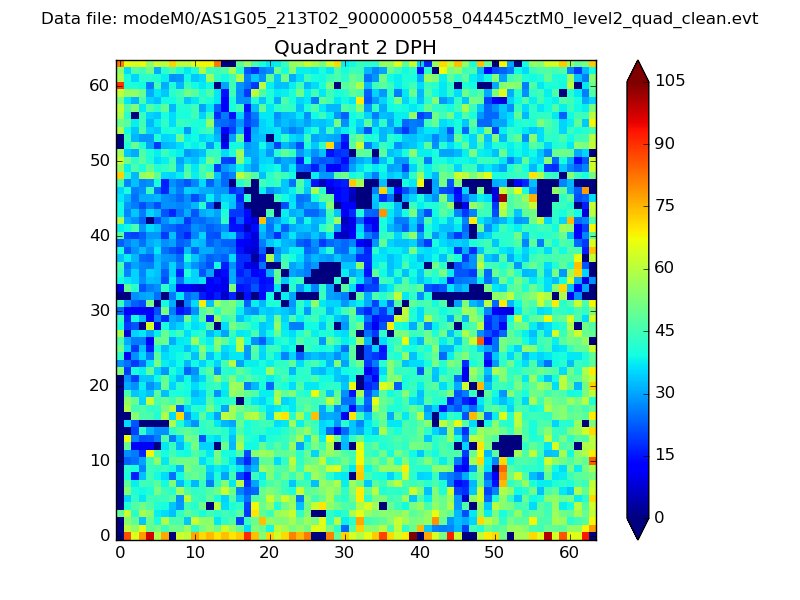
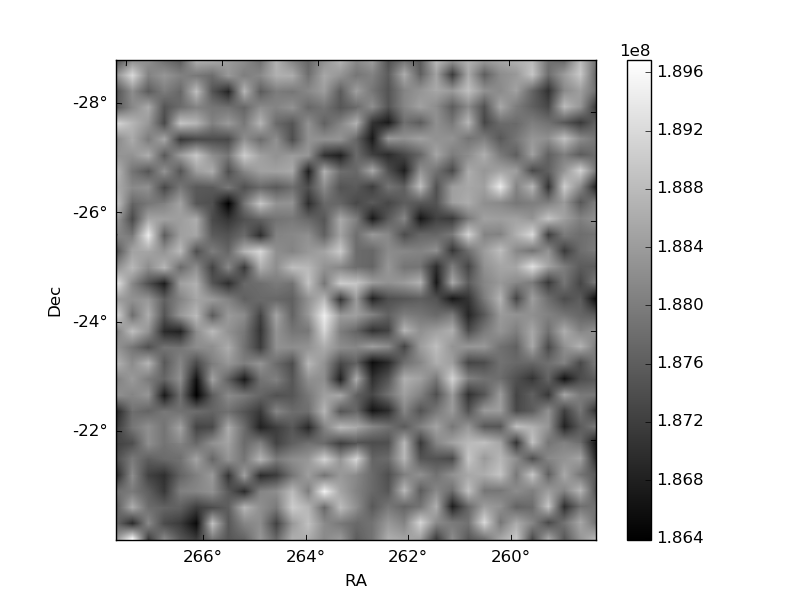
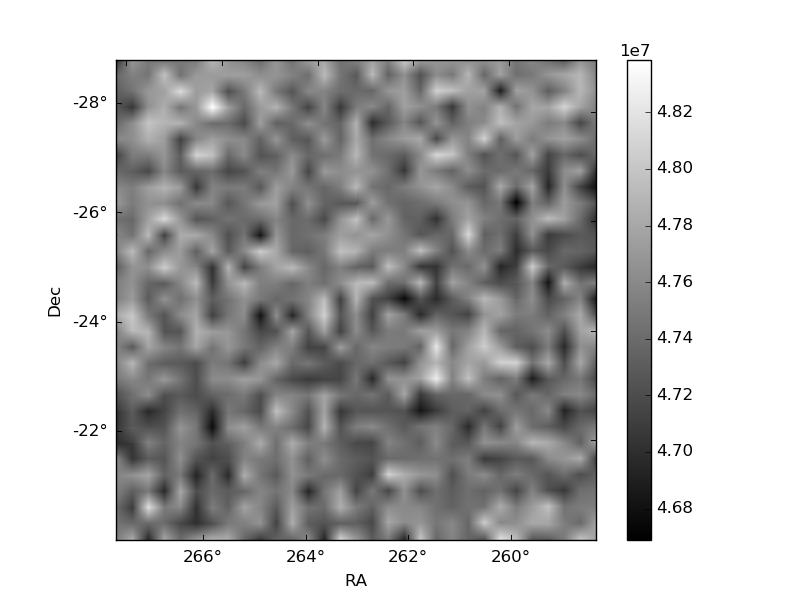
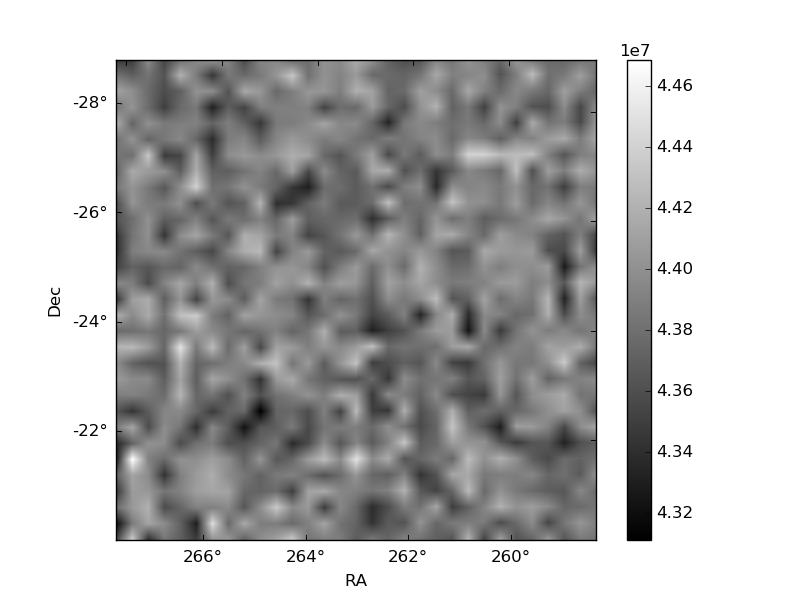
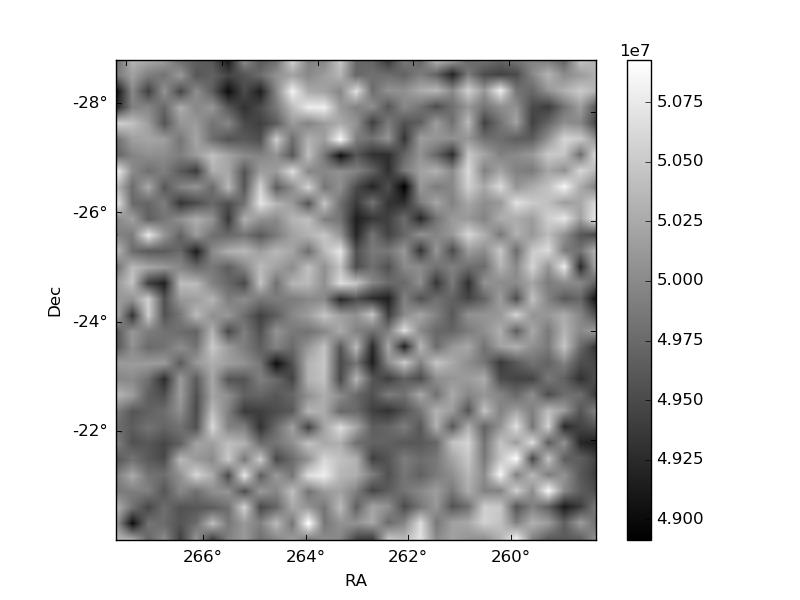
Histogram calculated using DETX and DETY for each event in the final _common_clean file
| Quadrant A | 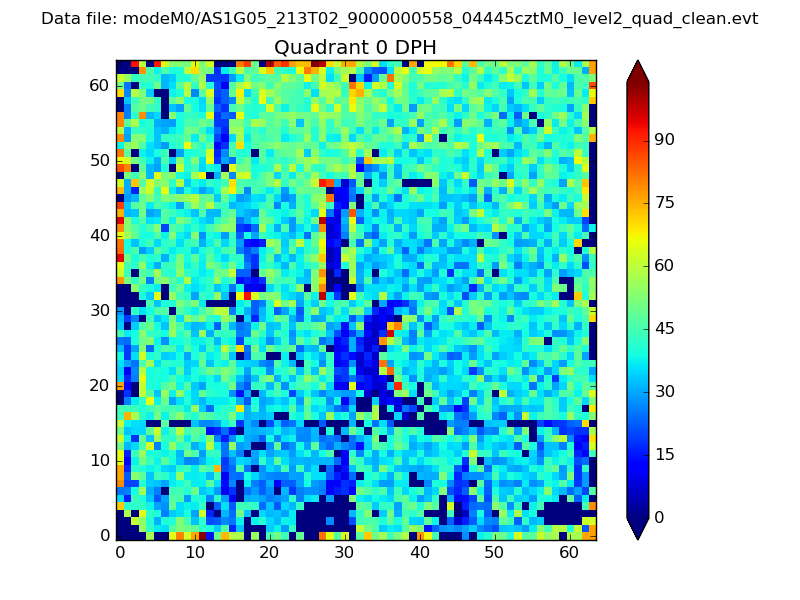 |
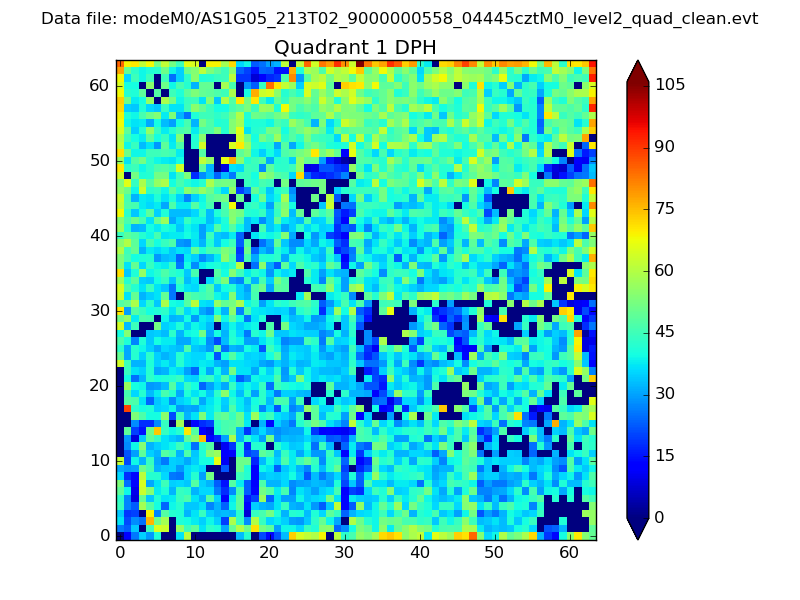 |
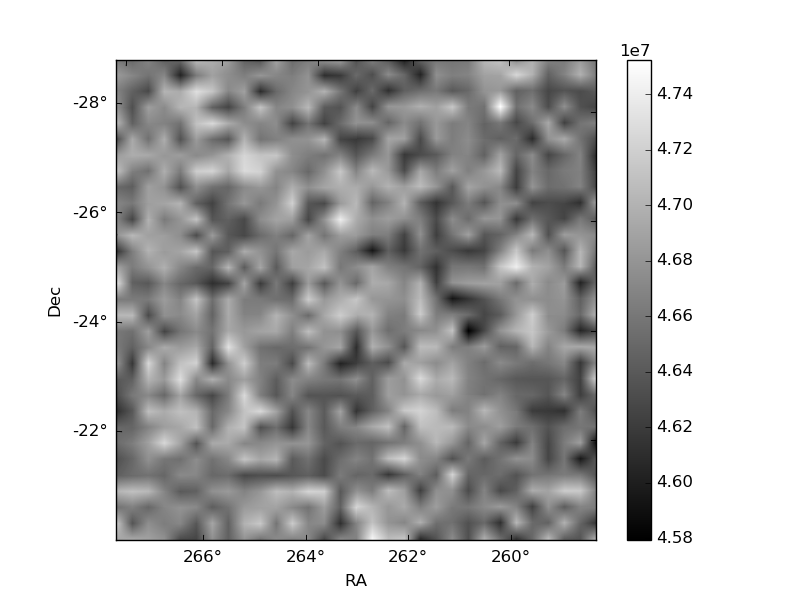
Quadrant B |
|---|---|---|---|
| Quadrant D | 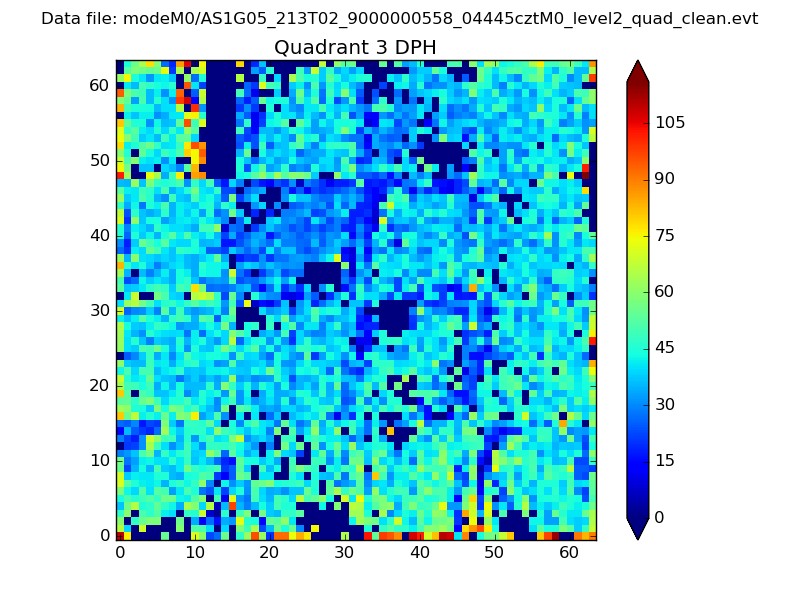 |
 |
Quadrant C |
| Plot type | Count rate plots | Images |
|---|---|---|
| Comparison with Poisson distribution Blue bars denote a histogram of data divided into 1 sec bins. Red curve is a Poisson curve with rate = median count rate of data. |
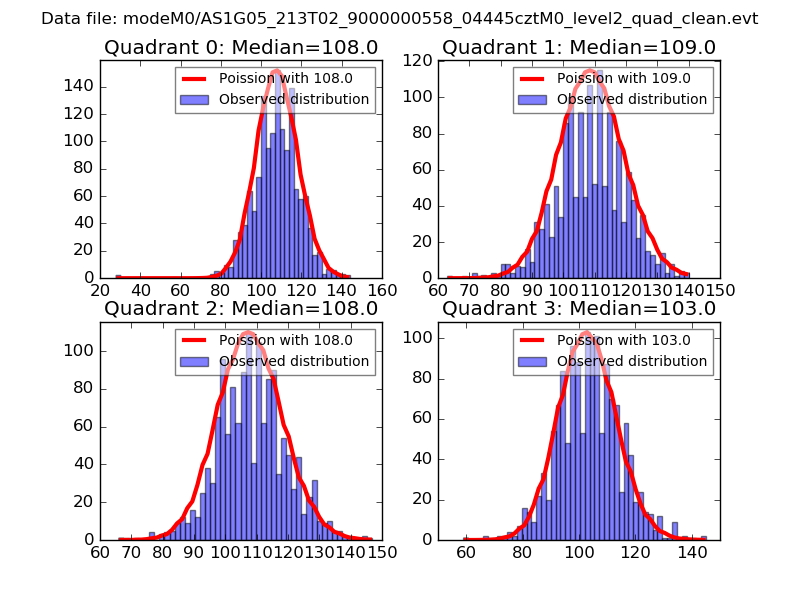 |
 |
| Quadrant-wise count rates Data is divided into 100 sec bins |
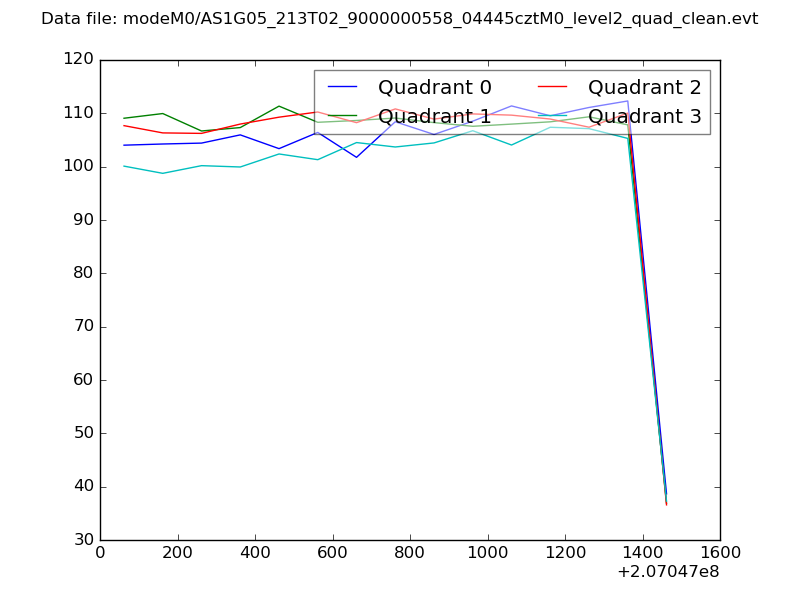 |
|
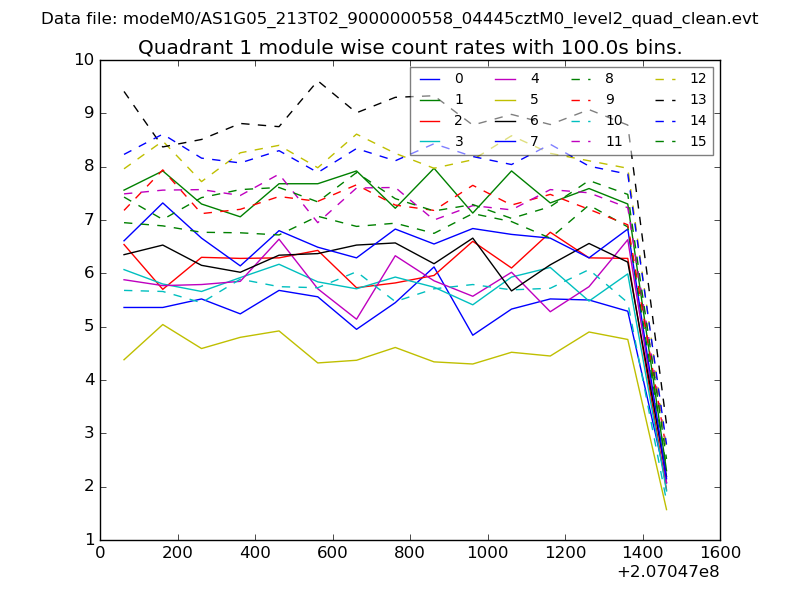
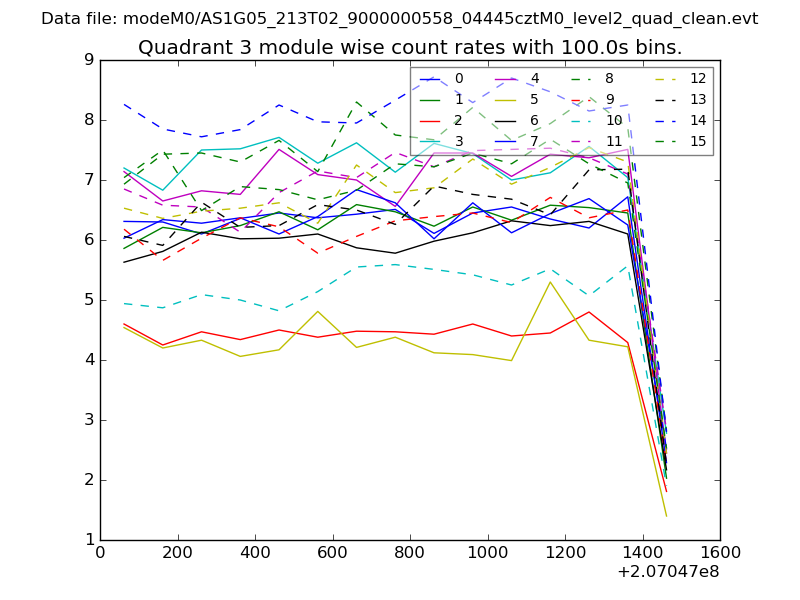
| Module-wise count rates for Quadrant A Data is divided into 100 sec bins |
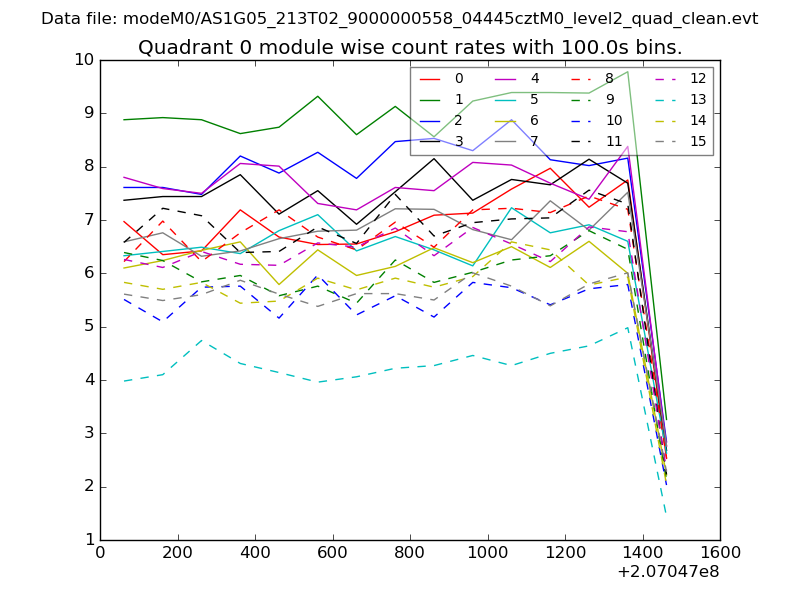 |
 |
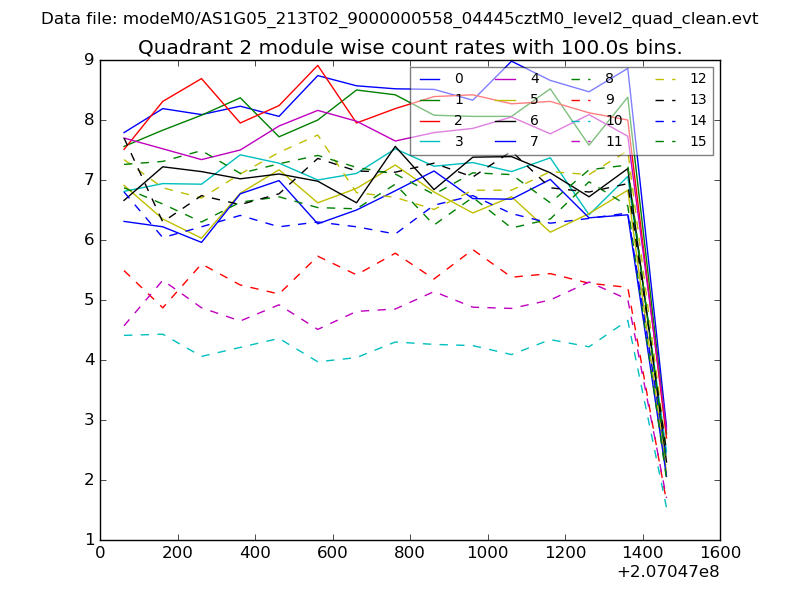
| Module-wise count rates for Quadrant B Data is divided into 100 sec bins |
 |
 |
| Module-wise count rates for Quadrant C Data is divided into 100 sec bins |
 |
 |
| Module-wise count rates for Quadrant D Data is divided into 100 sec bins |
 |
 |
| Parameter | Plot |
|---|---|
| CZT HV Monitor | 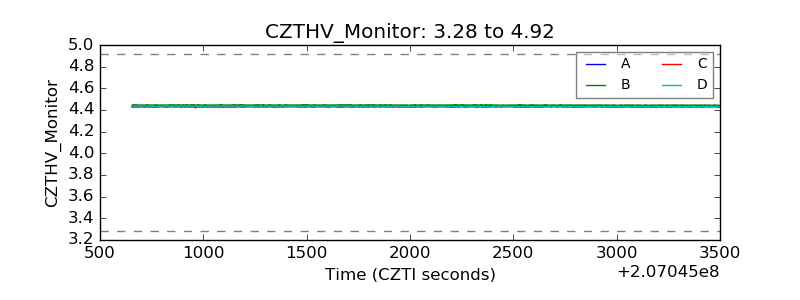 |
| D_VDD | 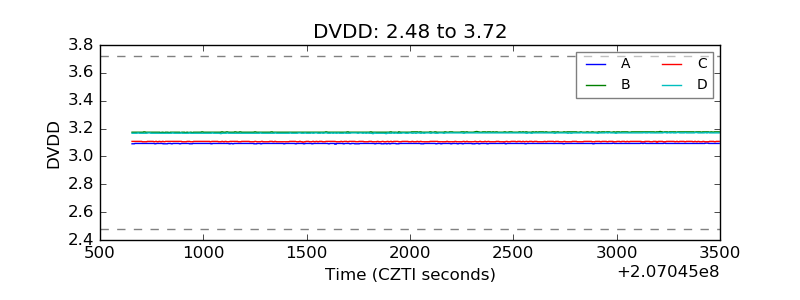 |
| Temperature 1 | 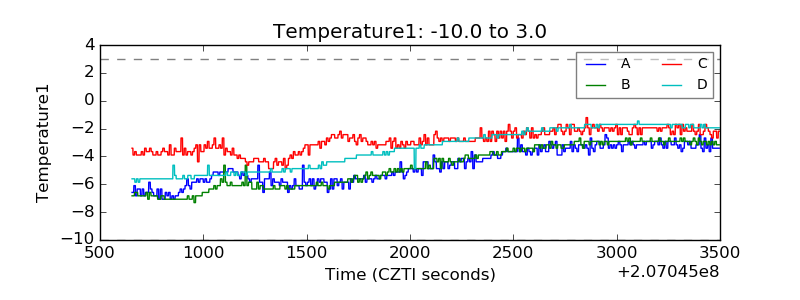 |
| Veto HV Monitor | 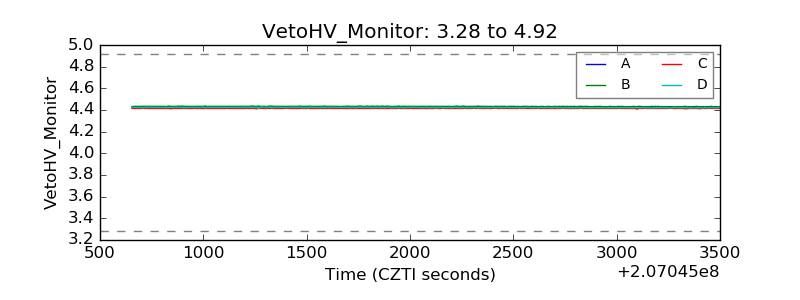 |
| Veto LLD | 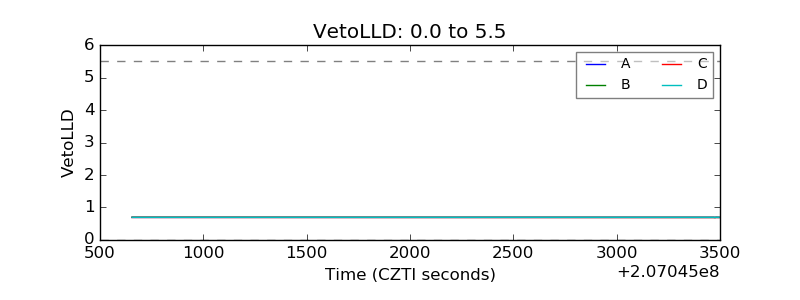 |
| Alpha Counter | 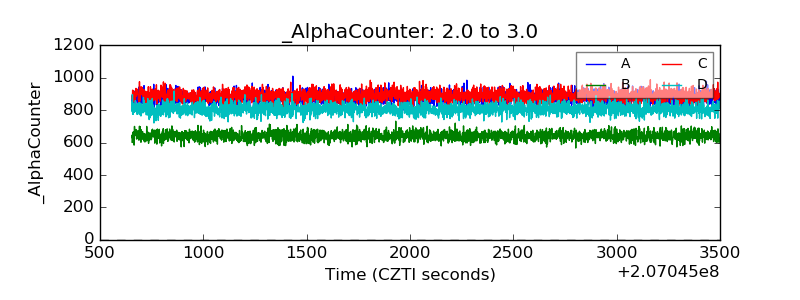 |
| _CPM_Rate | 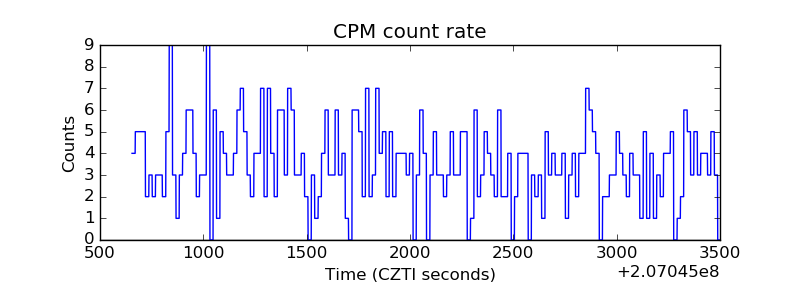 |
| CZT Counter | 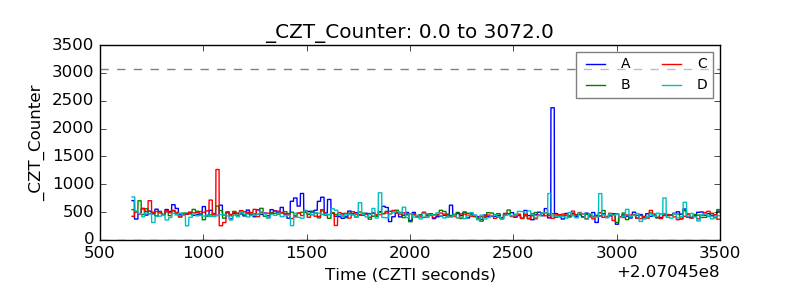 |
| +2.5 Volts monitor |  |
| +5 Volts monitor |  |
| _ROLL_ROT | 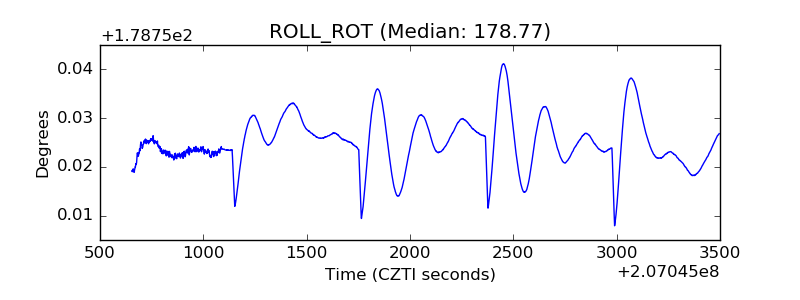 |
| _Roll_DEC | 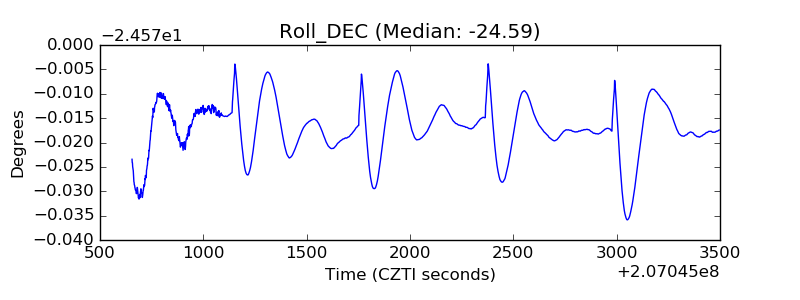 |
| _Roll_RA | 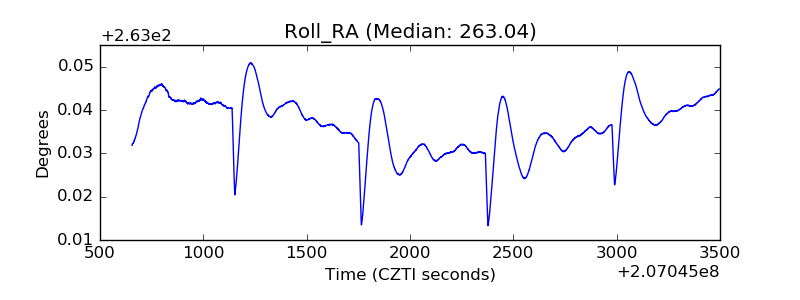 |
| Veto Counter | 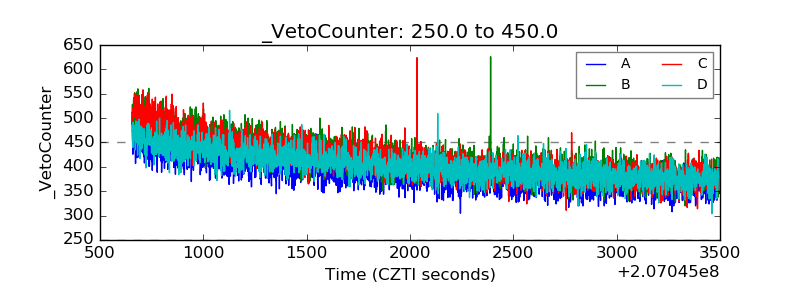 |