| Param | Original file | Final file |
|---|---|---|
| Filename | modeM0/AS1G05_245T01_9000000554cztM0_level2.fits | modeM0/AS1G05_245T01_9000000554cztM0_level2_quad_clean.evt |
| Size (bytes) | 141,963,840 | 107,544,960 |
| Size | 135.4 MB | 102.6 MB |
| Events in quadrant A | 856,412 | 579,690 |
| Events in quadrant B | 835,414 | 583,763 |
| Events in quadrant C | 837,284 | 547,555 |
| Events in quadrant D | 724,300 | 498,676 |
| Mode SS | |||
|---|---|---|---|
| Quadrant | BADHDUFLAG | Total packets | Discarded packets |
| A | 0 | 308 | 0 |
| B | 0 | 308 | 0 |
| C | 0 | 308 | 0 |
| D | 0 | 308 | 0 |
| Mode M0 | |||
|---|---|---|---|
| Quadrant | BADHDUFLAG | Total packets | Discarded packets |
| A | 0 | 31299 | 0 |
| B | 0 | 31245 | 0 |
| C | 0 | 30996 | 0 |
| D | 0 | 32620 | 0 |
| Mode M9 | |||
|---|---|---|---|
| Quadrant | BADHDUFLAG | Total packets | Discarded packets |
| A | 0 | 34 | 0 |
| B | 0 | 34 | 0 |
| C | 0 | 34 | 0 |
| D | 0 | 34 | 0 |
| Quadrant | Total seconds | Saturated seconds | Saturation percentage |
|---|---|---|---|
| A | 15166 | 86 | 0.567058% |
| B | 15166 | 93 | 0.613214% |
| C | 15166 | 45 | 0.296716% |
| D | 15166 | 152 | 1.002242% |
Noise dominated data is calculated using 1-second bins in cleaned event files. If a bin has >2000 counts, and if more than 50% of those come from <1% of pixels, then it is considered to be noise-dominated and hence unusable.
| Quadrant | # 1 sec bins | Bins with >0 counts | Bins with >2000 counts | High rate bins dominated by noise | Noise dominated (total time) | Noise dominated (detector-on time) | Marked lightcurve |
|---|---|---|---|---|---|---|---|
| A | 18588 | 15167 | 0 | 0 | 0.00% | 0.00% |  |
| B | 18588 | 15167 | 0 | 0 | 0.00% | 0.00% | 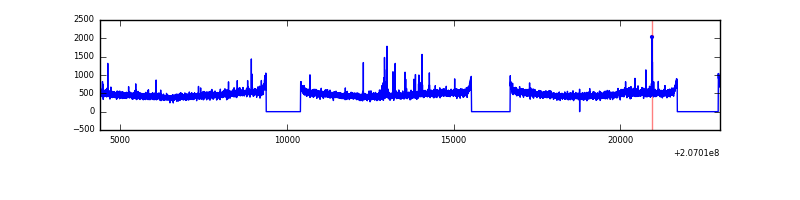 |
| C | 18588 | 15167 | 0 | 0 | 0.00% | 0.00% | 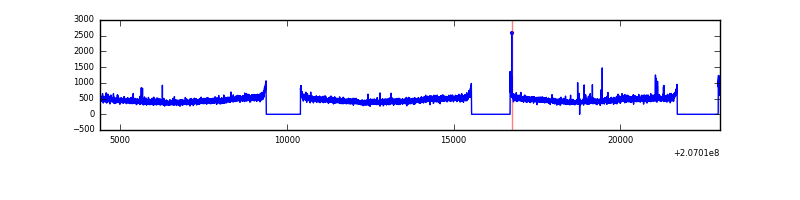 |
| D | 18588 | 15166 | 0 | 0 | 0.00% | 0.00% | 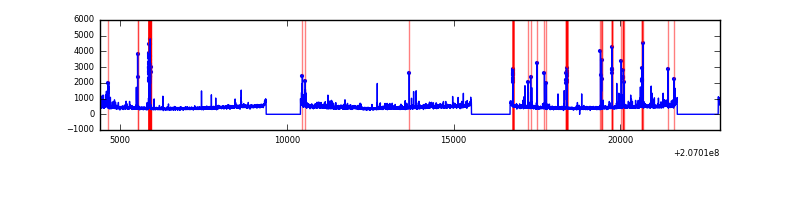 |
Top three noisy pixels from each quadrant. If the there are fewer than three noisy pixels in the level2.evt file, extra rows are filled as -1
| Pixel properties | Quadrant properties | ||||||
|---|---|---|---|---|---|---|---|
| Quadrant | DetID | PixID | Counts | Sigma | Mean | Median | Sigma |
| A | 14 | 188 | 822 | 10.27 | 222 | 208 | 59.8 |
| A | 7 | 110 | 764 | 9.3 | 222 | 208 | 59.8 |
| A | 0 | 29 | 750 | 9.07 | 222 | 208 | 59.8 |
| B | 2 | 9 | 782 | 12.1 | 219 | 209 | 47.4 |
| B | 12 | 226 | 637 | 9.03 | 219 | 209 | 47.4 |
| B | 5 | 128 | 592 | 8.08 | 219 | 209 | 47.4 |
| C | 1 | 81 | 644 | 7.24 | 220 | 205 | 60.7 |
| C | 1 | 80 | 639 | 7.15 | 220 | 205 | 60.7 |
| C | 9 | 188 | 573 | 6.07 | 220 | 205 | 60.7 |
| D | 11 | 82 | 577 | 6.82 | 205 | 187 | 57.2 |
| D | 3 | 14 | 545 | 6.26 | 205 | 187 | 57.2 |
| D | 10 | 113 | 531 | 6.01 | 205 | 187 | 57.2 |
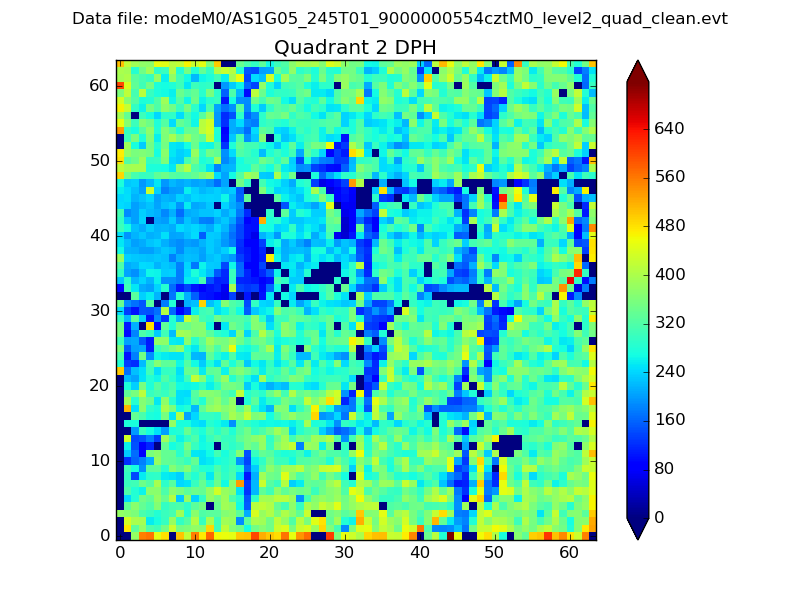
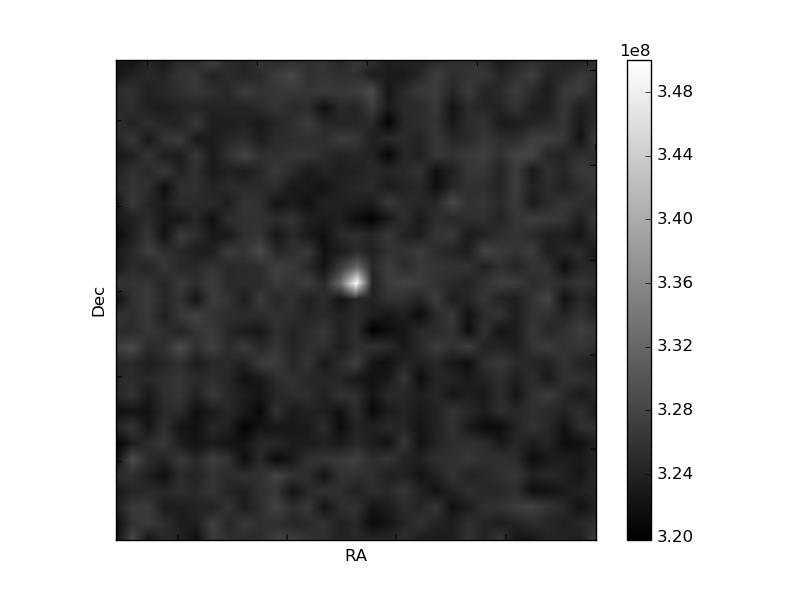
Histogram calculated using DETX and DETY for each event in the final _common_clean file
| Quadrant A | 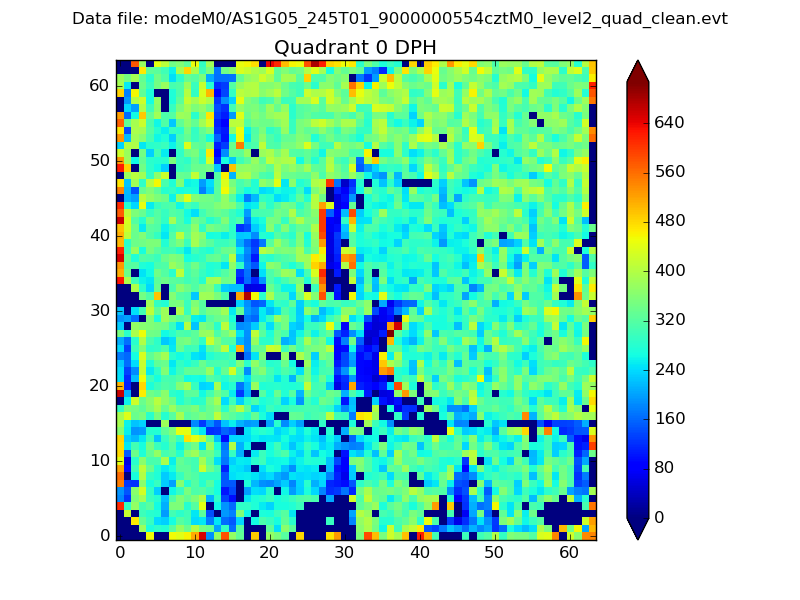 |
 |
Quadrant B |
|---|---|---|---|
| Quadrant D |  |
 |
Quadrant C |
| Plot type | Count rate plots | Images |
|---|---|---|
| Comparison with Poisson distribution Blue bars denote a histogram of data divided into 1 sec bins. Red curve is a Poisson curve with rate = median count rate of data. |
 |
 |
| Quadrant-wise count rates Data is divided into 100 sec bins |
 |
|
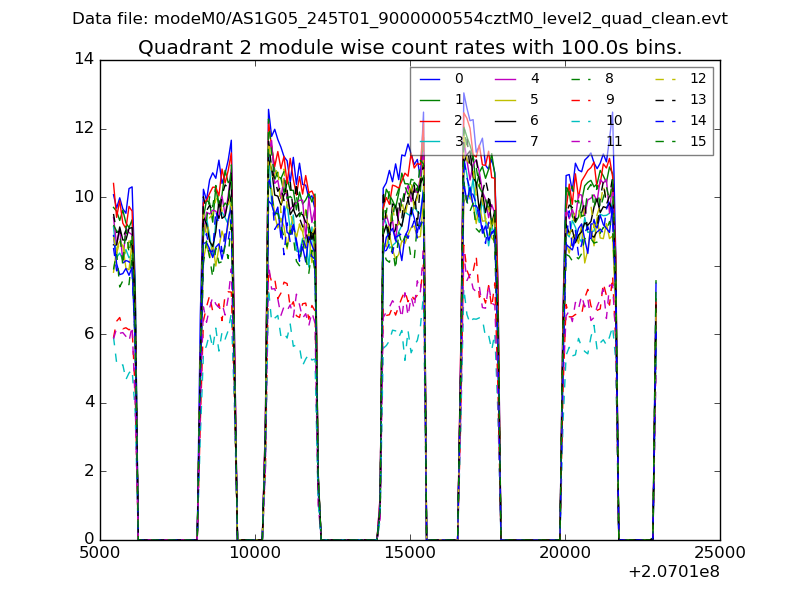
| Module-wise count rates for Quadrant A Data is divided into 100 sec bins |
 |
 |
| Module-wise count rates for Quadrant B Data is divided into 100 sec bins |
 |
 |
| Module-wise count rates for Quadrant C Data is divided into 100 sec bins |
 |
 |
| Module-wise count rates for Quadrant D Data is divided into 100 sec bins |
 |
 |
| Parameter | Plot |
|---|---|
| CZT HV Monitor |  |
| D_VDD |  |
| Temperature 1 | 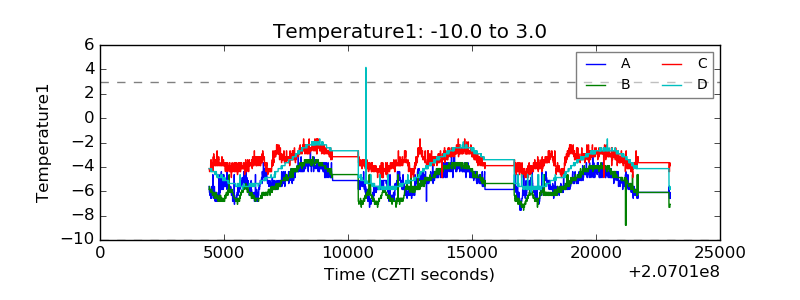 |
| Veto HV Monitor |  |
| Veto LLD |  |
| Alpha Counter |  |
| _CPM_Rate |  |
| CZT Counter |  |
| +2.5 Volts monitor | 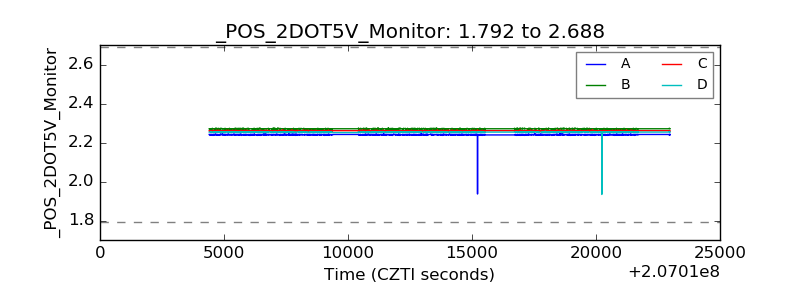 |
| +5 Volts monitor |  |
| _ROLL_ROT |  |
| _Roll_DEC |  |
| _Roll_RA | 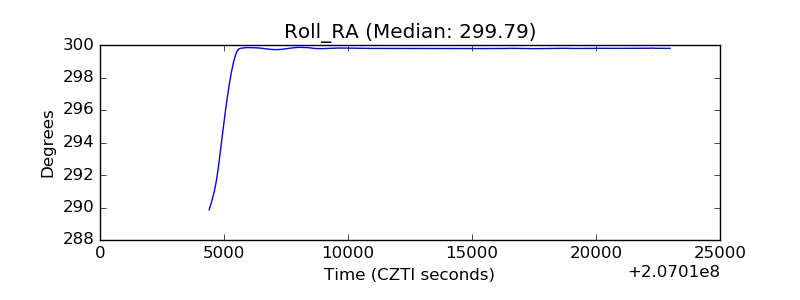 |
| Veto Counter |  |