| Param | Original file | Final file |
|---|---|---|
| Filename | modeM0/AS1G05_245T01_9000000554_04438cztM0_level2.evt | modeM0/AS1G05_245T01_9000000554_04438cztM0_level2_quad_clean.evt |
| Size (bytes) | 76,412,160 | 20,450,880 |
| Size | 72.9 MB | 19.5 MB |
| Events in quadrant A | 530,496 | 134,217 |
| Events in quadrant B | 560,828 | 134,652 |
| Events in quadrant C | 541,703 | 131,963 |
| Events in quadrant D | 594,638 | 125,690 |
| Mode SS | |||
|---|---|---|---|
| Quadrant | BADHDUFLAG | Total packets | Discarded packets |
| A | 0 | 24 | 0 |
| B | 0 | 24 | 0 |
| C | 0 | 24 | 0 |
| D | 0 | 24 | 0 |
| Mode M0 | |||
|---|---|---|---|
| Quadrant | BADHDUFLAG | Total packets | Discarded packets |
| A | 0 | 2453 | 1 |
| B | 0 | 2469 | 0 |
| C | 0 | 2458 | 0 |
| D | 0 | 2653 | 0 |
| Quadrant | Total seconds | Saturated seconds | Saturation percentage |
|---|---|---|---|
| A | 1224 | 0 | 0.000000% |
| B | 1224 | 0 | 0.000000% |
| C | 1224 | 0 | 0.000000% |
| D | 1224 | 2 | 0.163399% |
Noise dominated data is calculated using 1-second bins in cleaned event files. If a bin has >2000 counts, and if more than 50% of those come from <1% of pixels, then it is considered to be noise-dominated and hence unusable.
| Quadrant | # 1 sec bins | Bins with >0 counts | Bins with >2000 counts | High rate bins dominated by noise | Noise dominated (total time) | Noise dominated (detector-on time) | Marked lightcurve |
|---|---|---|---|---|---|---|---|
| A | 1224 | 1224 | 0 | 0 | 0.00% | 0.00% | 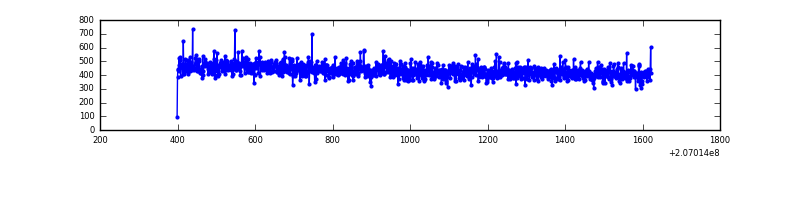 |
| B | 1224 | 1224 | 0 | 0 | 0.00% | 0.00% | 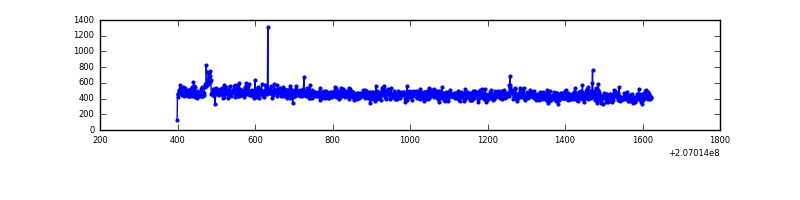 |
| C | 1224 | 1224 | 0 | 0 | 0.00% | 0.00% | 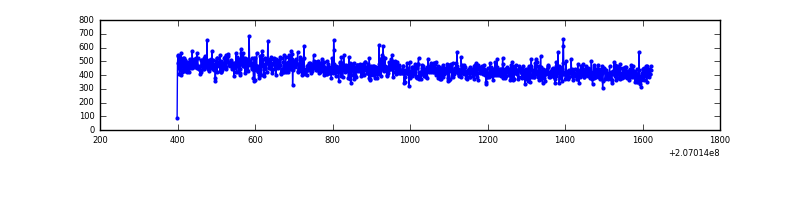 |
| D | 1224 | 1224 | 3 | 3 | 0.25% | 0.25% | 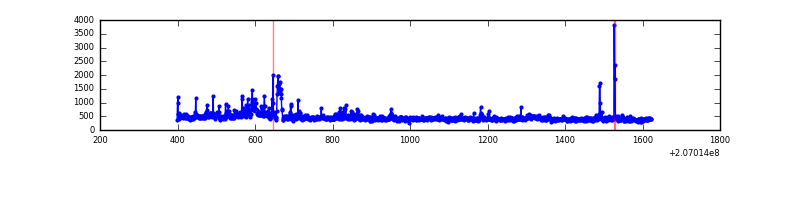 |
Top three noisy pixels from each quadrant. If the there are fewer than three noisy pixels in the level2.evt file, extra rows are filled as -1
| Pixel properties | Quadrant properties | ||||||
|---|---|---|---|---|---|---|---|
| Quadrant | DetID | PixID | Counts | Sigma | Mean | Median | Sigma |
| A | 12 | 194 | 1343 | 40.42 | 137 | 135 | 29.9 |
| A | 0 | 226 | 1294 | 38.78 | 137 | 135 | 29.9 |
| A | 13 | 254 | 603 | 15.66 | 137 | 135 | 29.9 |
| B | 14 | 167 | 3725 | 125.87 | 142 | 139 | 28.5 |
| B | 15 | 204 | 3114 | 104.43 | 142 | 139 | 28.5 |
| B | 12 | 111 | 2542 | 84.35 | 142 | 139 | 28.5 |
| C | 9 | 247 | 1624 | 43.66 | 137 | 139 | 34.0 |
| C | 9 | 16 | 1437 | 38.16 | 137 | 139 | 34.0 |
| C | 13 | 61 | 1109 | 28.52 | 137 | 139 | 34.0 |
| D | 2 | 63 | 65236 | 1863.54 | 133 | 129 | 34.9 |
| D | 2 | 14 | 14944 | 424.05 | 133 | 129 | 34.9 |
| D | 2 | 31 | 7088 | 199.19 | 133 | 129 | 34.9 |
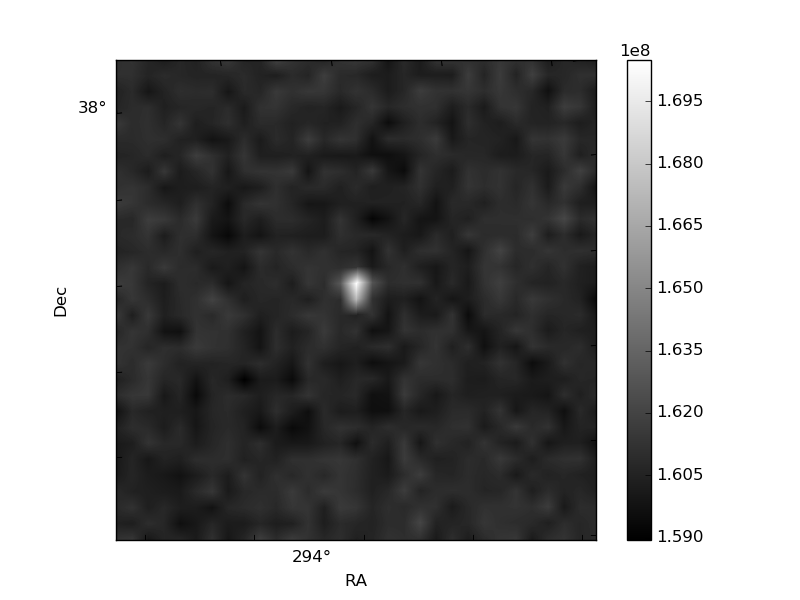
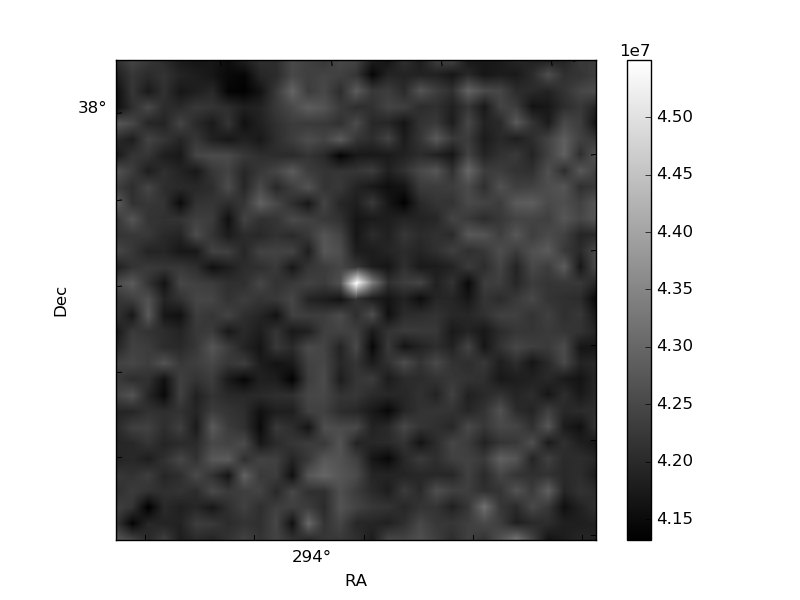
Histogram calculated using DETX and DETY for each event in the final _common_clean file
| Quadrant A | 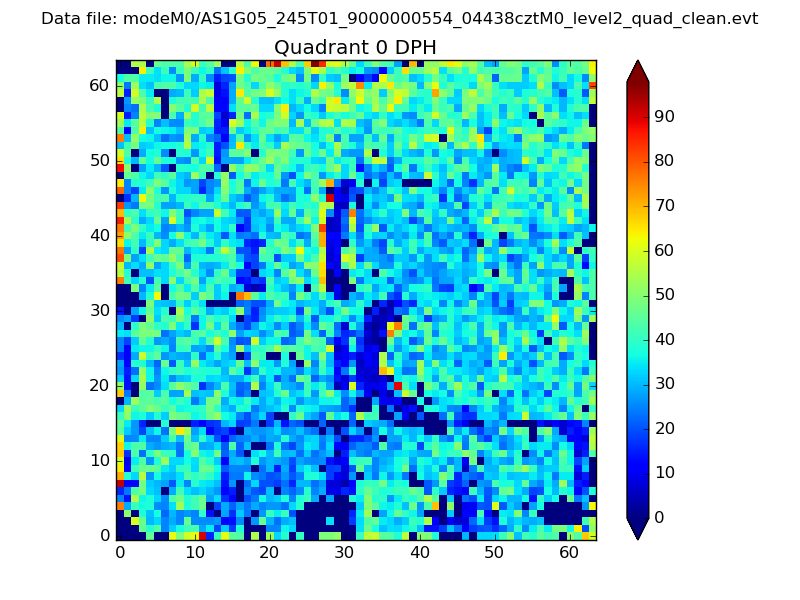 |
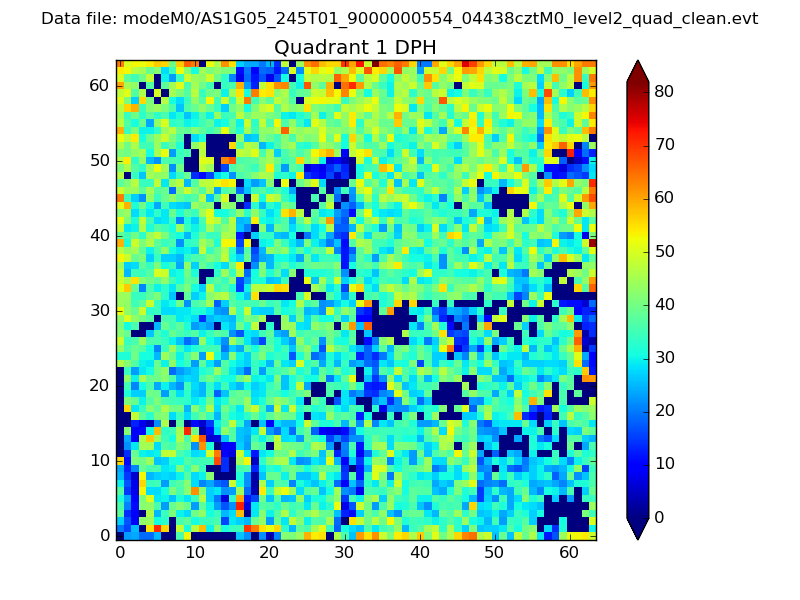 |
Quadrant B |
|---|---|---|---|
| Quadrant D | 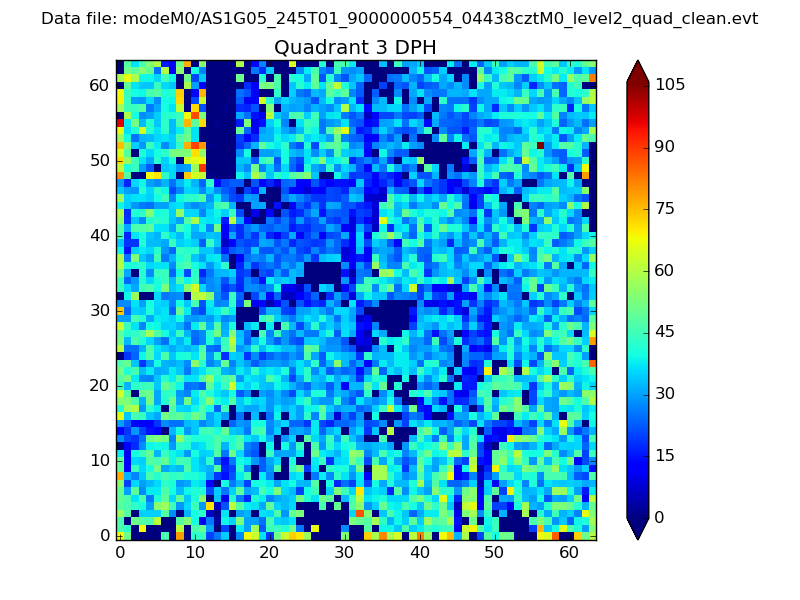 |
 |
Quadrant C |
| Plot type | Count rate plots | Images |
|---|---|---|
| Comparison with Poisson distribution Blue bars denote a histogram of data divided into 1 sec bins. Red curve is a Poisson curve with rate = median count rate of data. |
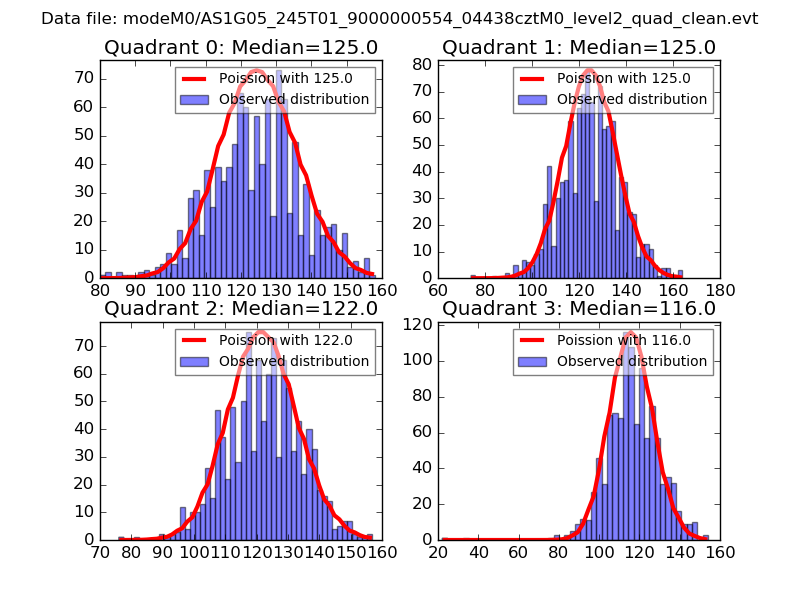 |
 |
| Quadrant-wise count rates Data is divided into 100 sec bins |
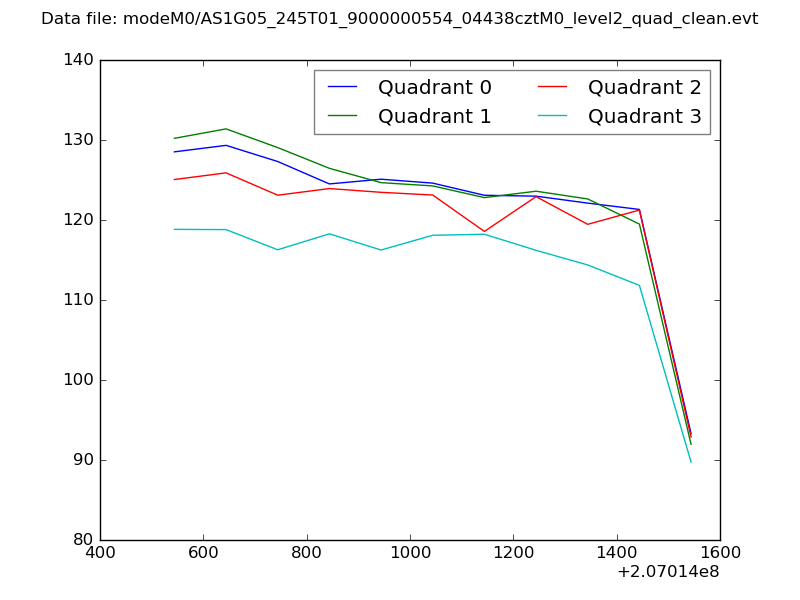 |
|
| Module-wise count rates for Quadrant A Data is divided into 100 sec bins |
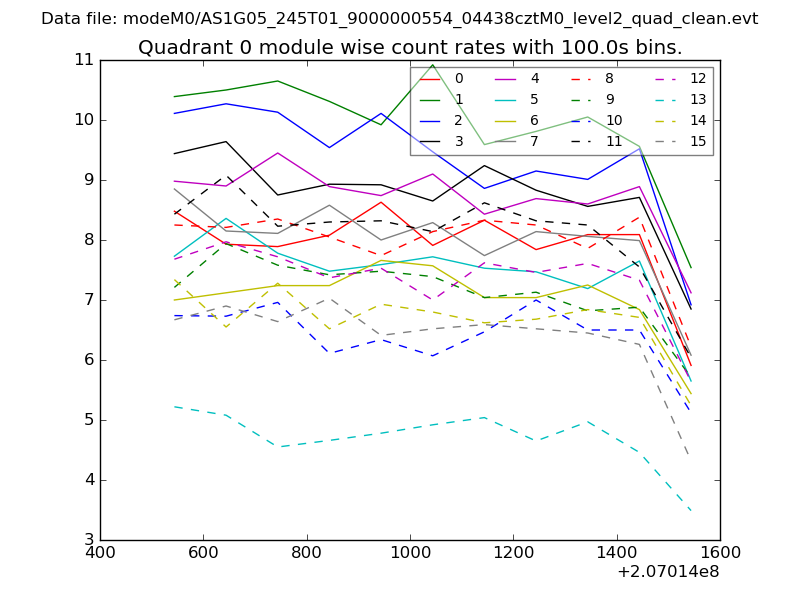 |
 |
| Module-wise count rates for Quadrant B Data is divided into 100 sec bins |
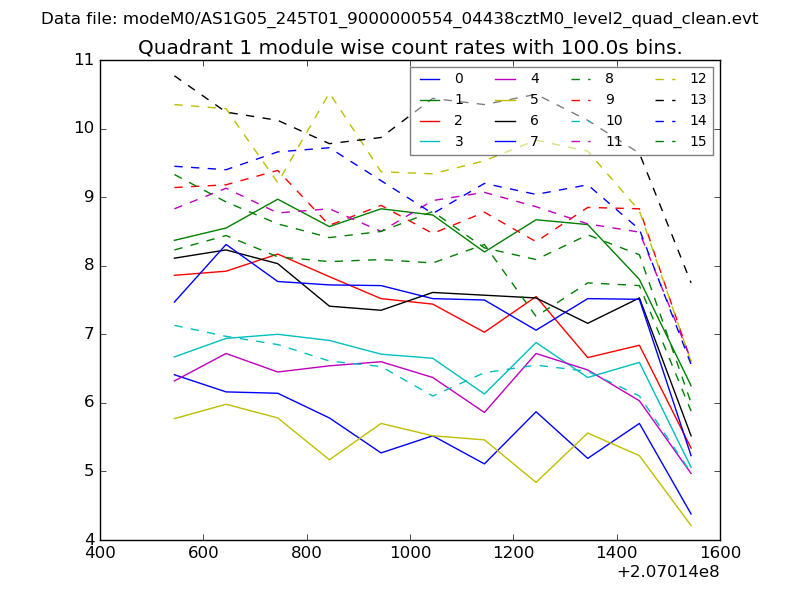 |
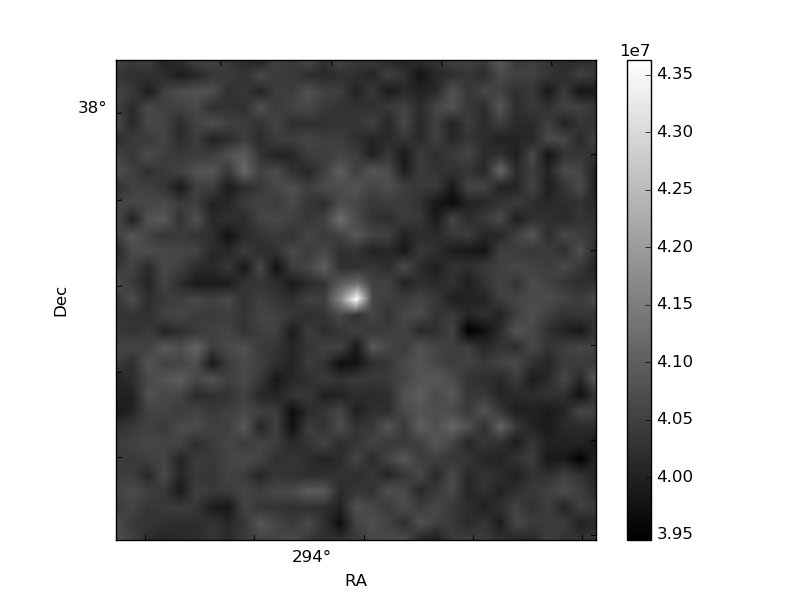 |
| Module-wise count rates for Quadrant C Data is divided into 100 sec bins |
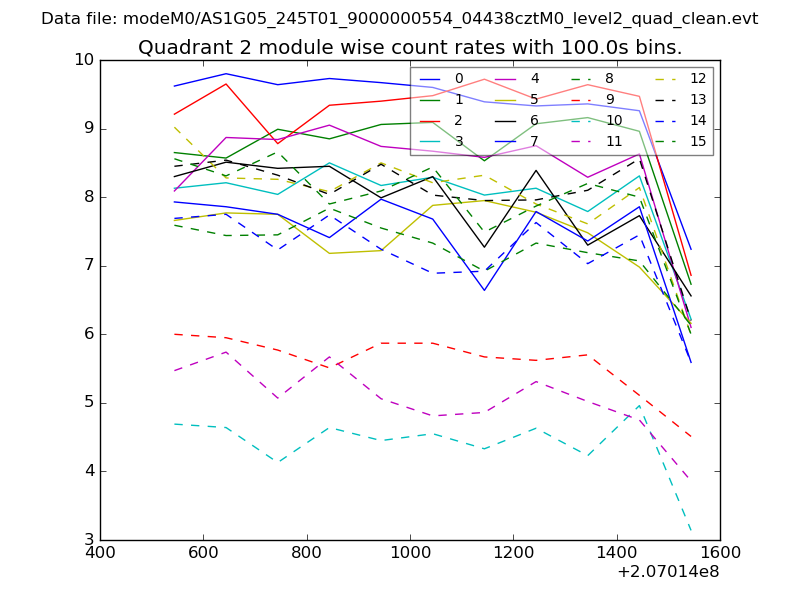 |
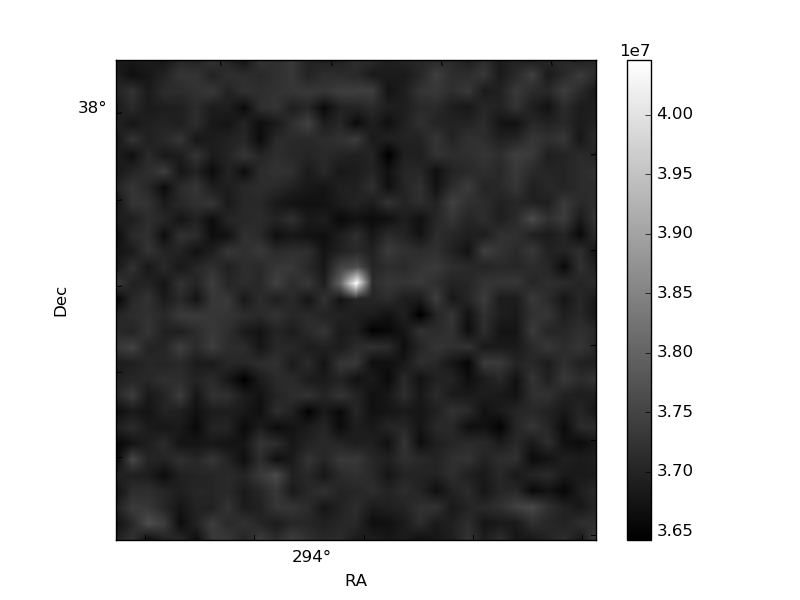 |
| Module-wise count rates for Quadrant D Data is divided into 100 sec bins |
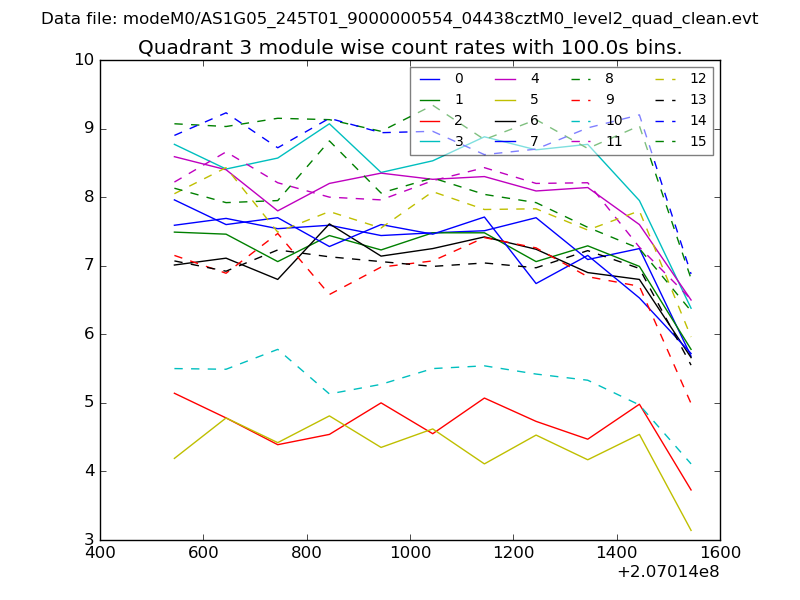 |
 |
| Parameter | Plot |
|---|---|
| CZT HV Monitor | 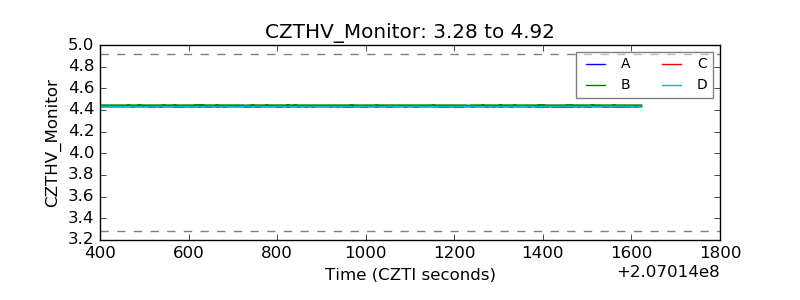 |
| D_VDD | 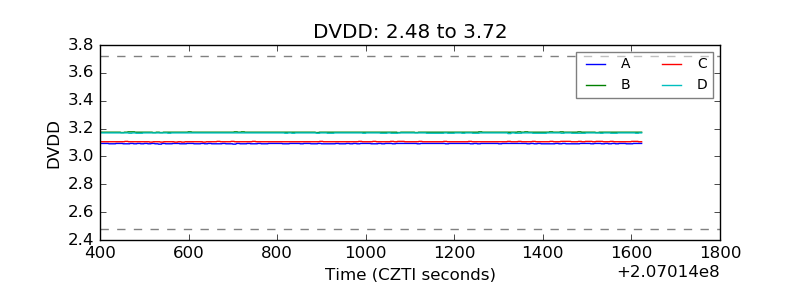 |
| Temperature 1 | 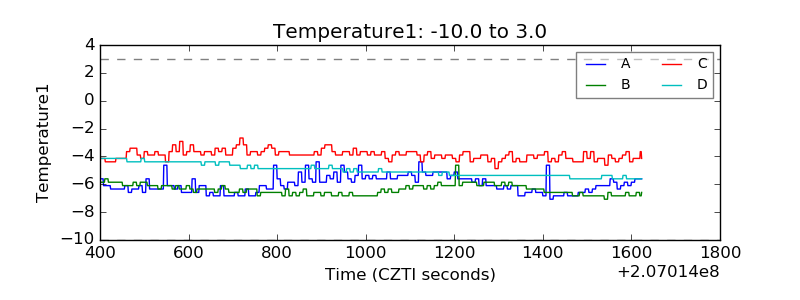 |
| Veto HV Monitor | 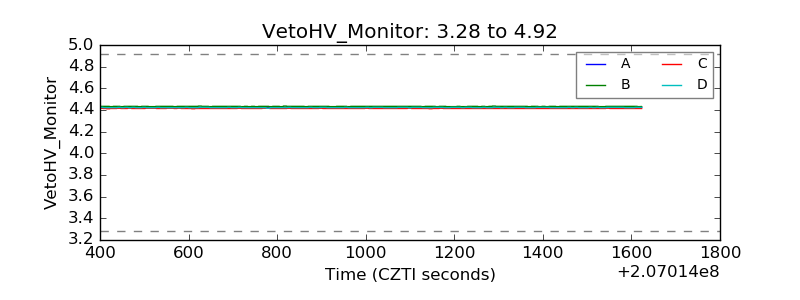 |
| Veto LLD | 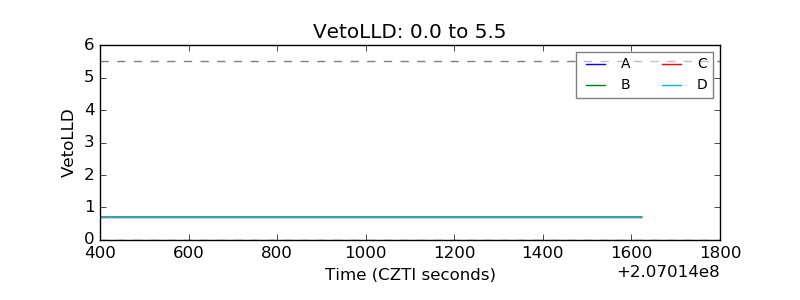 |
| Alpha Counter | 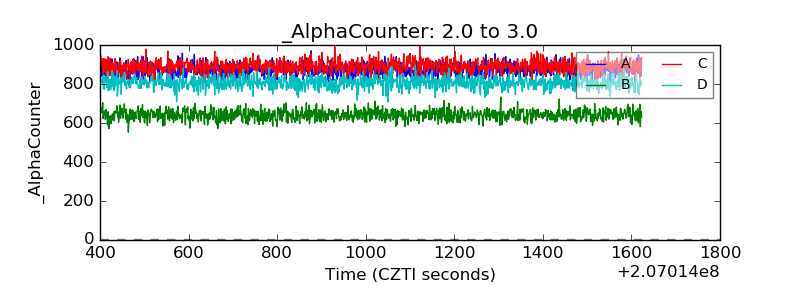 |
| _CPM_Rate | 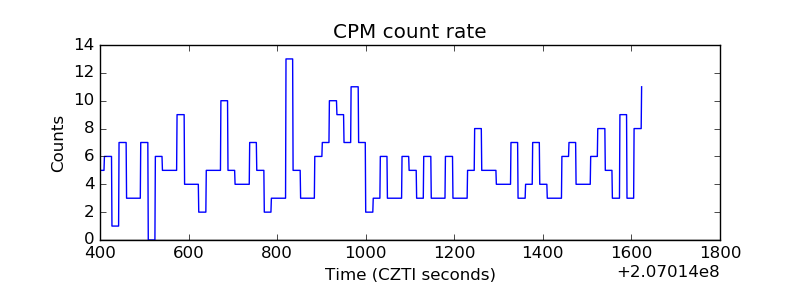 |
| CZT Counter | 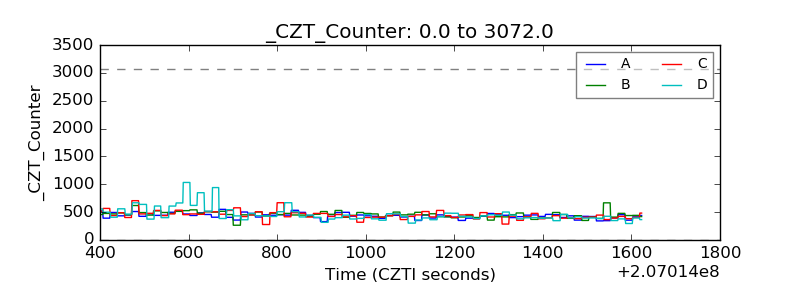 |
| +2.5 Volts monitor |  |
| +5 Volts monitor |  |
| _ROLL_ROT | 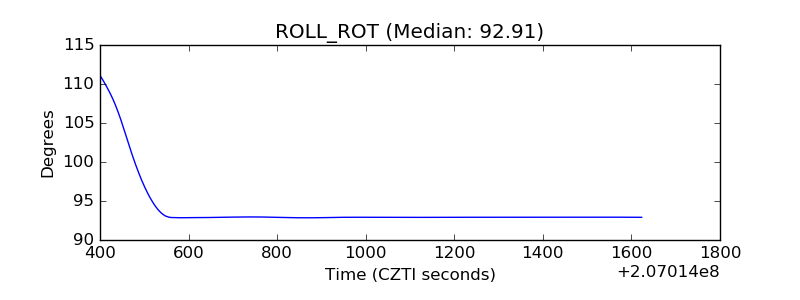 |
| _Roll_DEC | 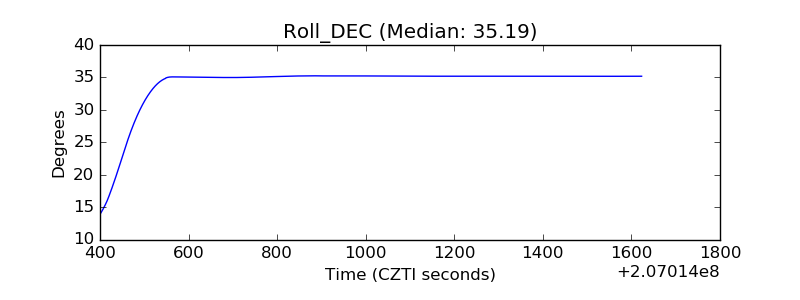 |
| _Roll_RA | 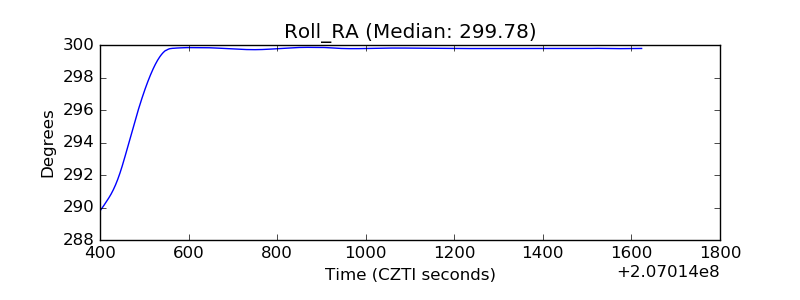 |
| Veto Counter | 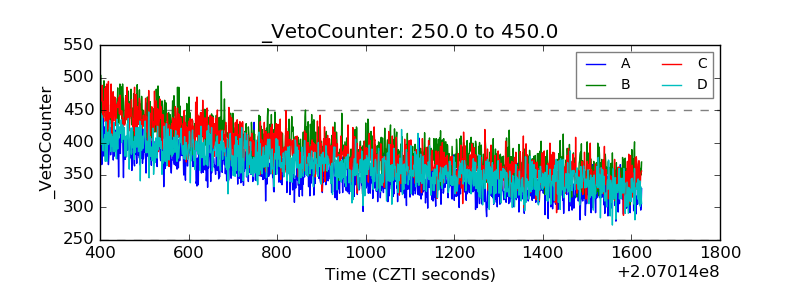 |