| Param | Original file | Final file |
|---|---|---|
| Filename | modeM0/AS1G05_245T01_9000000554_04440cztM0_level2.evt | modeM0/AS1G05_245T01_9000000554_04440cztM0_level2_quad_clean.evt |
| Size (bytes) | 76,109,760 | 4,268,160 |
| Size | 72.6 MB | 4.1 MB |
| Events in quadrant A | 567,426 | 8,252 |
| Events in quadrant B | 572,299 | 8,109 |
| Events in quadrant C | 543,953 | 7,516 |
| Events in quadrant D | 530,153 | 7,493 |
| Mode SS | |||
|---|---|---|---|
| Quadrant | BADHDUFLAG | Total packets | Discarded packets |
| A | 0 | 26 | 0 |
| B | 0 | 26 | 0 |
| C | 0 | 26 | 0 |
| D | 0 | 26 | 0 |
| Mode M0 | |||
|---|---|---|---|
| Quadrant | BADHDUFLAG | Total packets | Discarded packets |
| A | 0 | 2591 | 1 |
| B | 0 | 2592 | 0 |
| C | 0 | 2587 | 0 |
| D | 0 | 2593 | 0 |
| Quadrant | Total seconds | Saturated seconds | Saturation percentage |
|---|---|---|---|
| A | 1293 | 1 | 0.077340% |
| B | 1293 | 0 | 0.000000% |
| C | 1293 | 0 | 0.000000% |
| D | 1293 | 0 | 0.000000% |
Noise dominated data is calculated using 1-second bins in cleaned event files. If a bin has >2000 counts, and if more than 50% of those come from <1% of pixels, then it is considered to be noise-dominated and hence unusable.
| Quadrant | # 1 sec bins | Bins with >0 counts | Bins with >2000 counts | High rate bins dominated by noise | Noise dominated (total time) | Noise dominated (detector-on time) | Marked lightcurve |
|---|---|---|---|---|---|---|---|
| A | 1293 | 1293 | 0 | 0 | 0.00% | 0.00% | 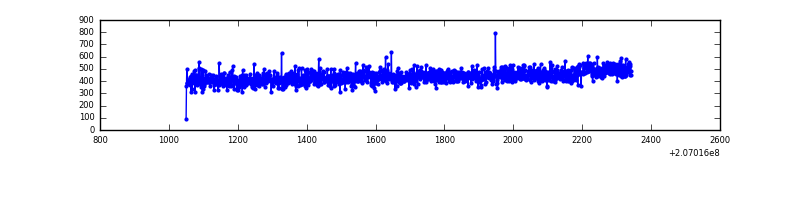 |
| B | 1293 | 1293 | 0 | 0 | 0.00% | 0.00% | 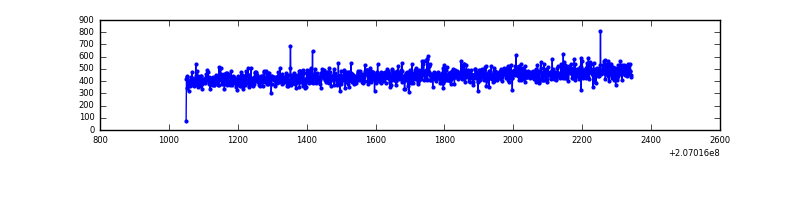 |
| C | 1293 | 1293 | 0 | 0 | 0.00% | 0.00% |  |
| D | 1293 | 1293 | 0 | 0 | 0.00% | 0.00% | 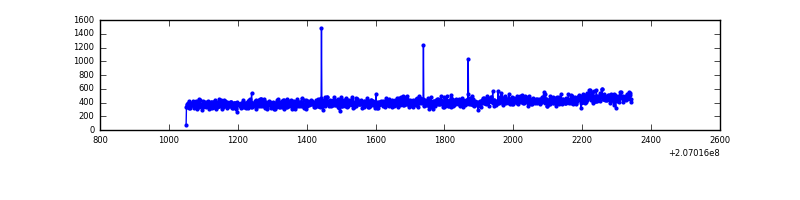 |
Top three noisy pixels from each quadrant. If the there are fewer than three noisy pixels in the level2.evt file, extra rows are filled as -1
| Pixel properties | Quadrant properties | ||||||
|---|---|---|---|---|---|---|---|
| Quadrant | DetID | PixID | Counts | Sigma | Mean | Median | Sigma |
| A | 12 | 194 | 1480 | 41.37 | 147 | 144 | 32.3 |
| A | 0 | 226 | 1465 | 40.91 | 147 | 144 | 32.3 |
| A | 13 | 14 | 563 | 12.97 | 147 | 144 | 32.3 |
| B | 12 | 111 | 2760 | 85.54 | 146 | 143 | 30.6 |
| B | 11 | 111 | 2169 | 66.22 | 146 | 143 | 30.6 |
| B | 4 | 48 | 2115 | 64.45 | 146 | 143 | 30.6 |
| C | 13 | 61 | 1095 | 27.91 | 138 | 139 | 34.3 |
| C | 9 | 247 | 773 | 18.51 | 138 | 139 | 34.3 |
| C | 9 | 16 | 672 | 15.56 | 138 | 139 | 34.3 |
| D | 2 | 206 | 4371 | 121.57 | 138 | 134 | 34.9 |
| D | 8 | 112 | 2217 | 59.77 | 138 | 134 | 34.9 |
| D | 13 | 239 | 1779 | 47.2 | 138 | 134 | 34.9 |
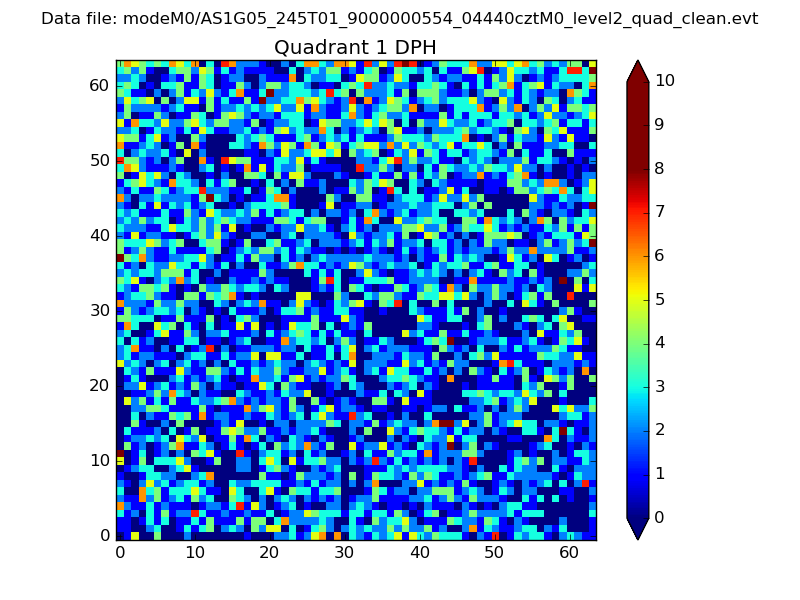
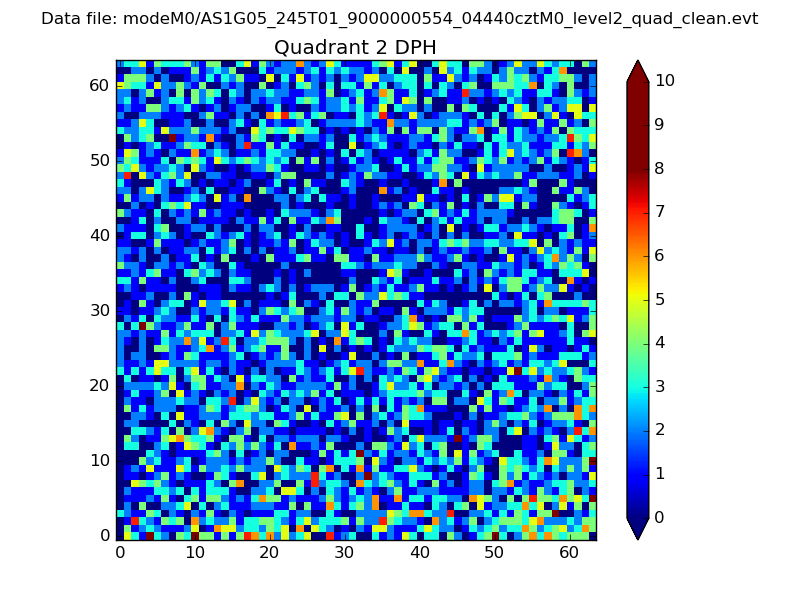
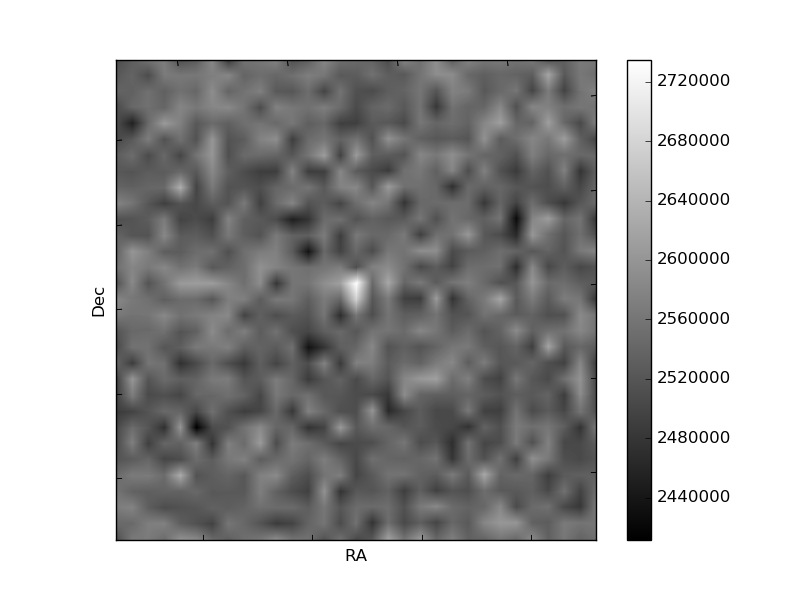
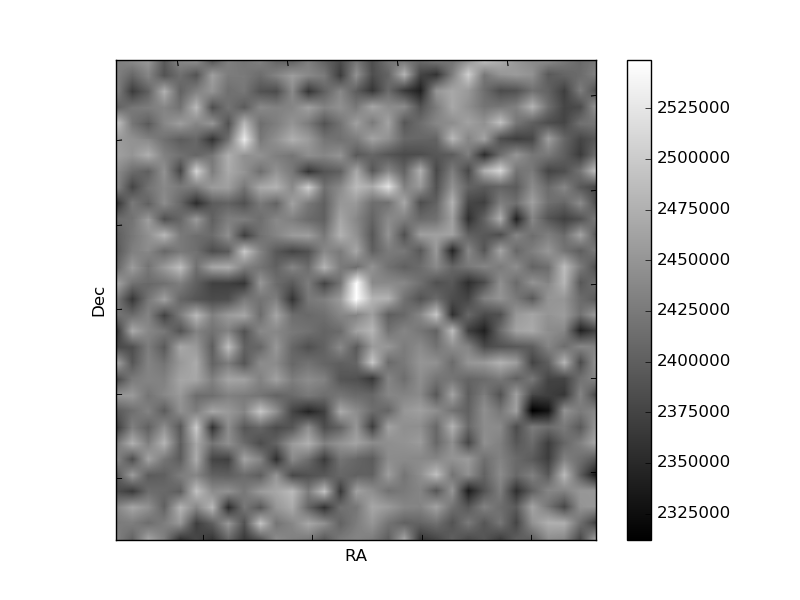
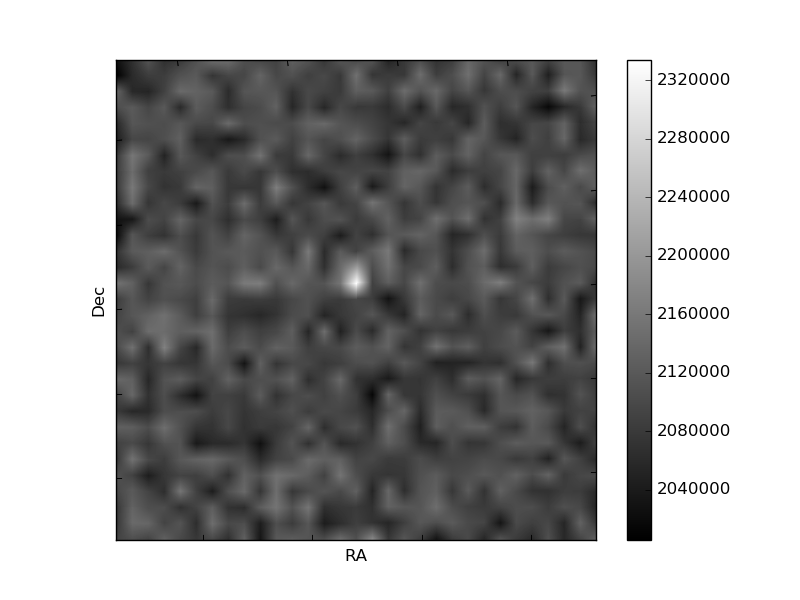
Histogram calculated using DETX and DETY for each event in the final _common_clean file
| Quadrant A | 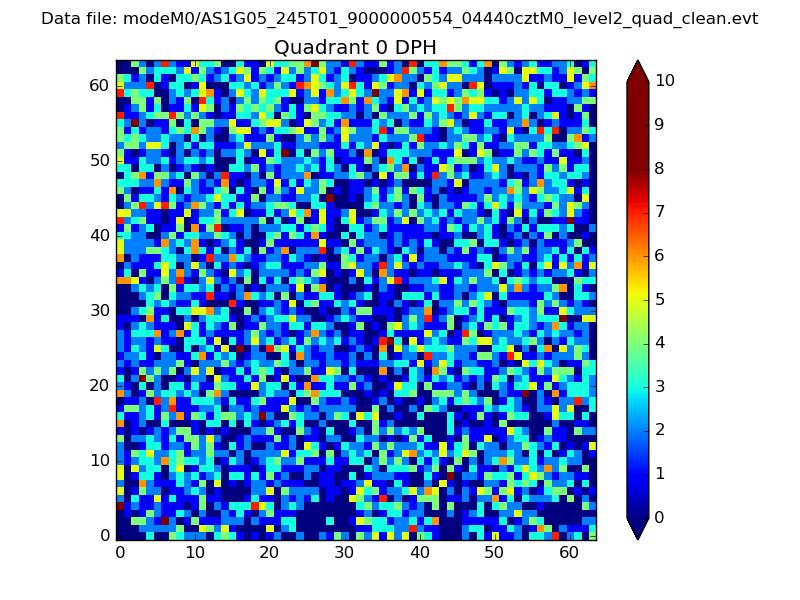 |
 |
Quadrant B |
|---|---|---|---|
| Quadrant D | 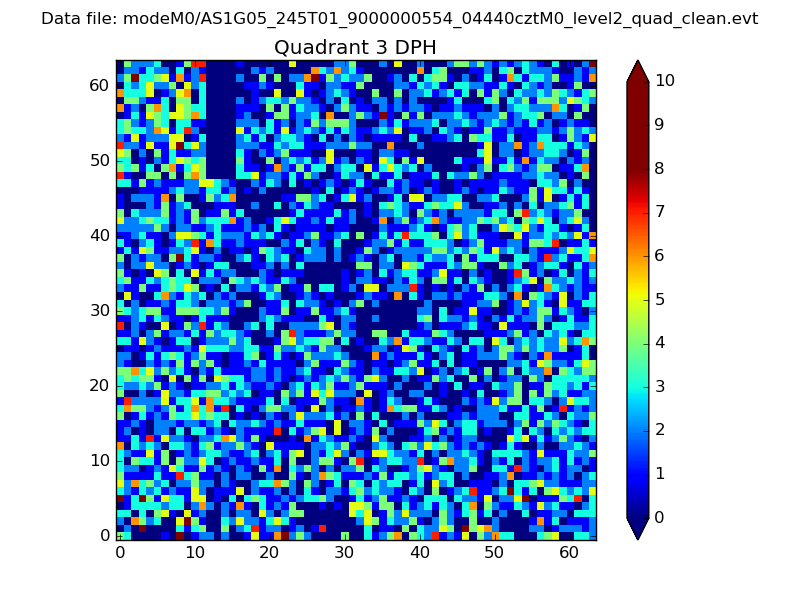 |
 |
Quadrant C |
| Plot type | Count rate plots | Images |
|---|---|---|
| Comparison with Poisson distribution Blue bars denote a histogram of data divided into 1 sec bins. Red curve is a Poisson curve with rate = median count rate of data. |
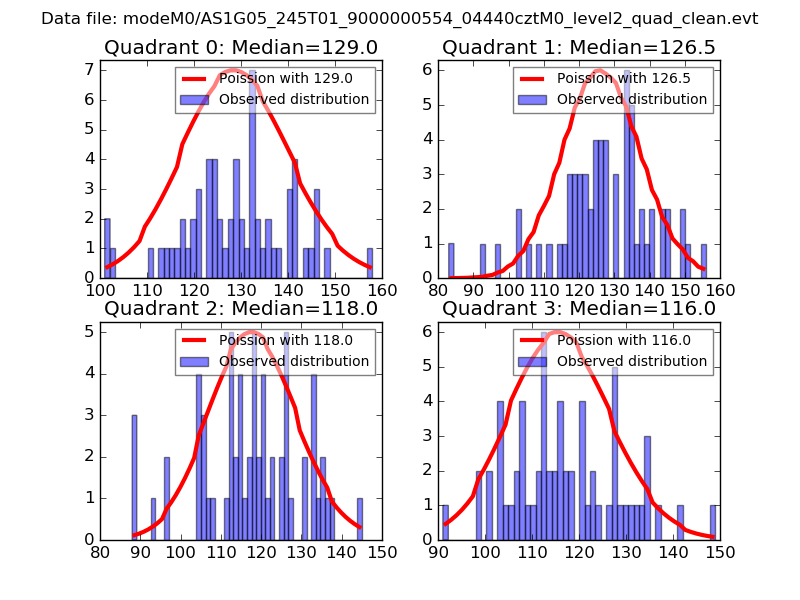 |
 |
| Quadrant-wise count rates Data is divided into 100 sec bins |
 |
|
| Module-wise count rates for Quadrant A Data is divided into 100 sec bins |
 |
 |
| Module-wise count rates for Quadrant B Data is divided into 100 sec bins |
 |
 |
| Module-wise count rates for Quadrant C Data is divided into 100 sec bins |
 |
 |
| Module-wise count rates for Quadrant D Data is divided into 100 sec bins |
 |
 |
| Parameter | Plot |
|---|---|
| CZT HV Monitor | 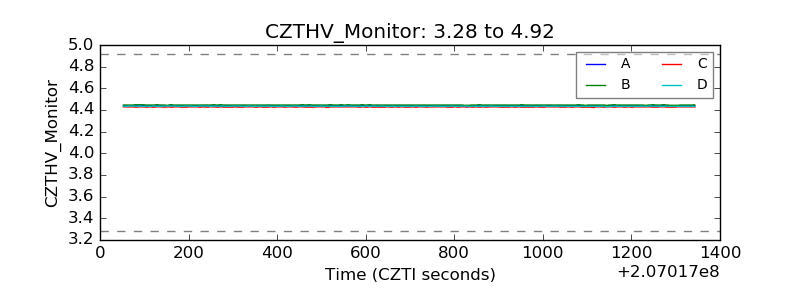 |
| D_VDD | 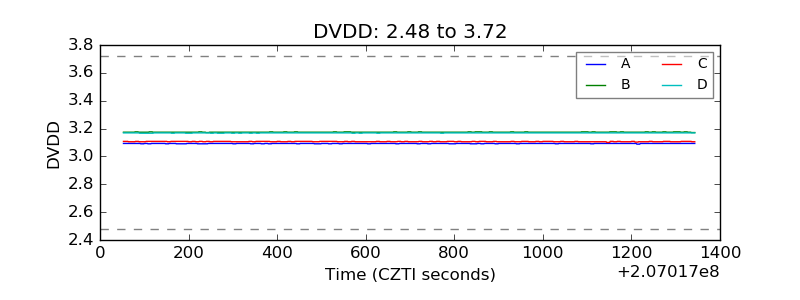 |
| Temperature 1 | 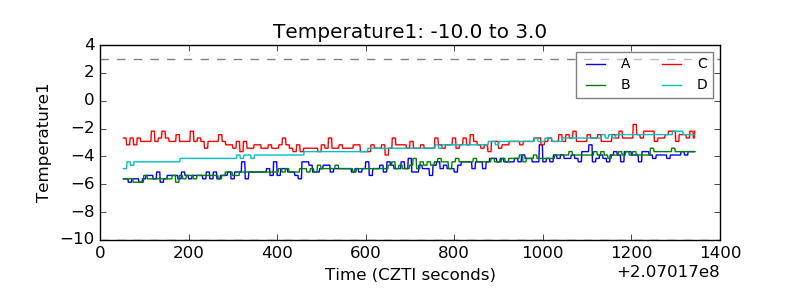 |
| Veto HV Monitor | 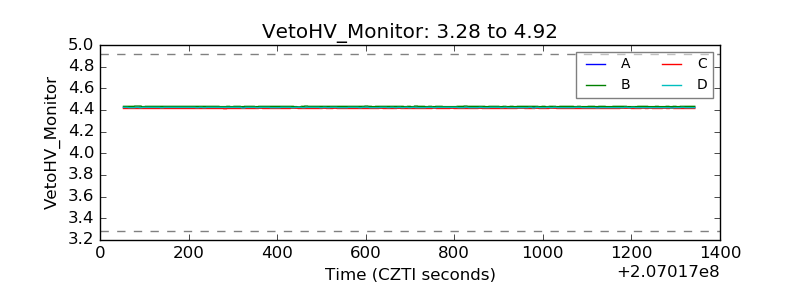 |
| Veto LLD | 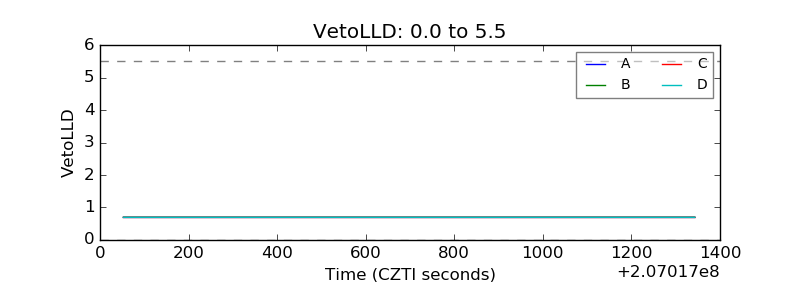 |
| Alpha Counter | 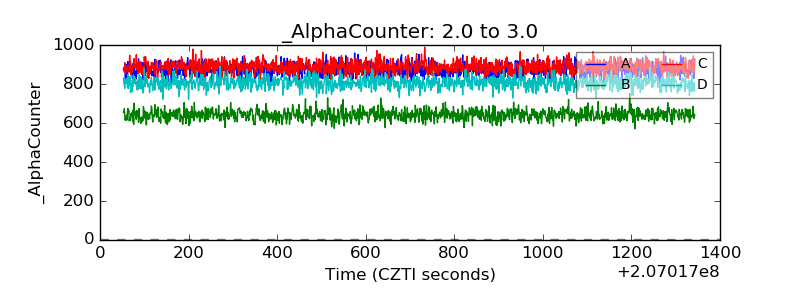 |
| _CPM_Rate | 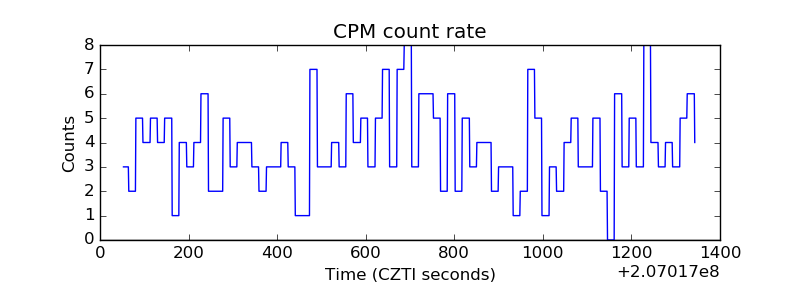 |
| CZT Counter | 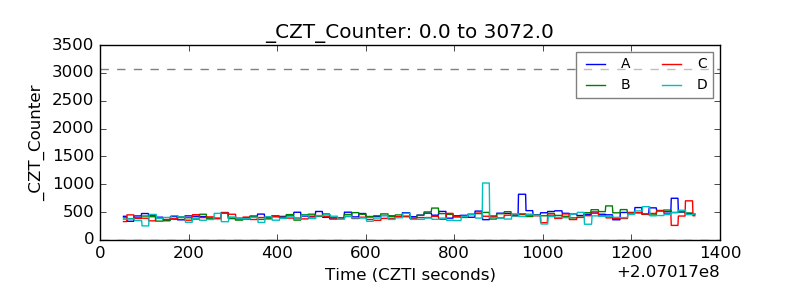 |
| +2.5 Volts monitor |  |
| +5 Volts monitor |  |
| _ROLL_ROT | 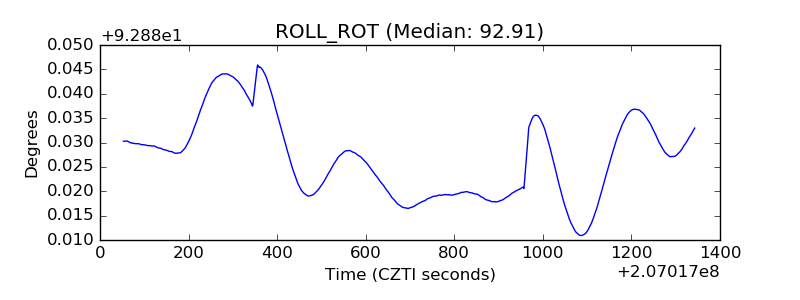 |
| _Roll_DEC | 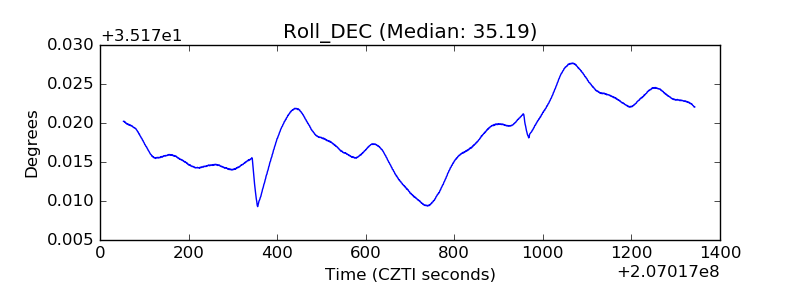 |
| _Roll_RA |  |
| Veto Counter | 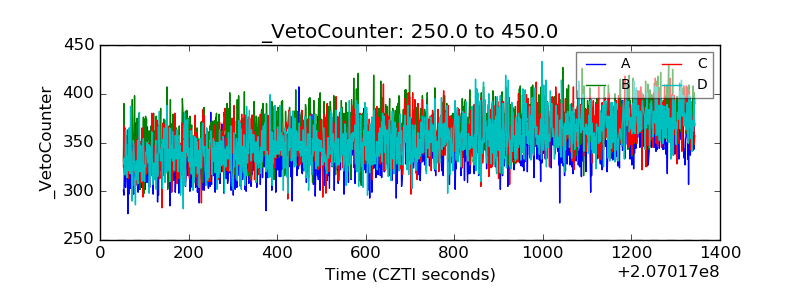 |