| Param | Original file | Final file |
|---|---|---|
| Filename | modeM0/AS1G05_245T01_9000000554_04441cztM0_level2.evt | modeM0/AS1G05_245T01_9000000554_04441cztM0_level2_quad_clean.evt |
| Size (bytes) | 395,688,960 | 83,044,800 |
| Size | 377.4 MB | 79.2 MB |
| Events in quadrant A | 2,886,182 | 530,544 |
| Events in quadrant B | 2,974,610 | 535,674 |
| Events in quadrant C | 2,810,193 | 520,750 |
| Events in quadrant D | 2,890,890 | 495,455 |
| Mode SS | |||
|---|---|---|---|
| Quadrant | BADHDUFLAG | Total packets | Discarded packets |
| A | 0 | 128 | 0 |
| B | 0 | 128 | 0 |
| C | 0 | 128 | 0 |
| D | 0 | 128 | 0 |
| Mode M0 | |||
|---|---|---|---|
| Quadrant | BADHDUFLAG | Total packets | Discarded packets |
| A | 0 | 12655 | 2 |
| B | 0 | 12799 | 1 |
| C | 0 | 12573 | 1 |
| D | 0 | 12919 | 1 |
| Mode M9 | |||
|---|---|---|---|
| Quadrant | BADHDUFLAG | Total packets | Discarded packets |
| A | 0 | 11 | 0 |
| B | 0 | 11 | 0 |
| C | 0 | 11 | 0 |
| D | 0 | 11 | 0 |
| Quadrant | Total seconds | Saturated seconds | Saturation percentage |
|---|---|---|---|
| A | 6186 | 19 | 0.307145% |
| B | 6186 | 27 | 0.436469% |
| C | 6186 | 11 | 0.177821% |
| D | 6186 | 25 | 0.404138% |
Noise dominated data is calculated using 1-second bins in cleaned event files. If a bin has >2000 counts, and if more than 50% of those come from <1% of pixels, then it is considered to be noise-dominated and hence unusable.
| Quadrant | # 1 sec bins | Bins with >0 counts | Bins with >2000 counts | High rate bins dominated by noise | Noise dominated (total time) | Noise dominated (detector-on time) | Marked lightcurve |
|---|---|---|---|---|---|---|---|
| A | 7346 | 6187 | 0 | 0 | 0.00% | 0.00% | 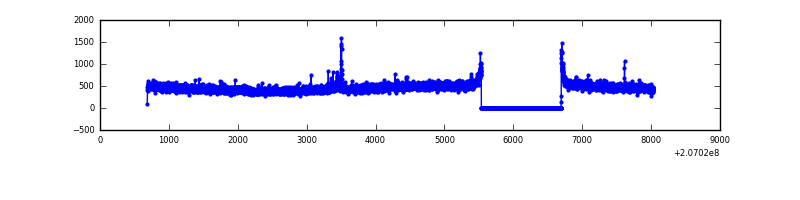 |
| B | 7346 | 6187 | 0 | 0 | 0.00% | 0.00% | 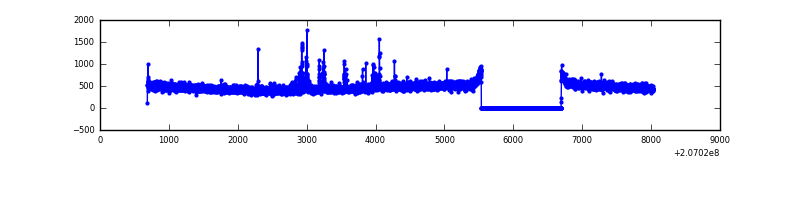 |
| C | 7346 | 6187 | 1 | 1 | 0.01% | 0.02% | 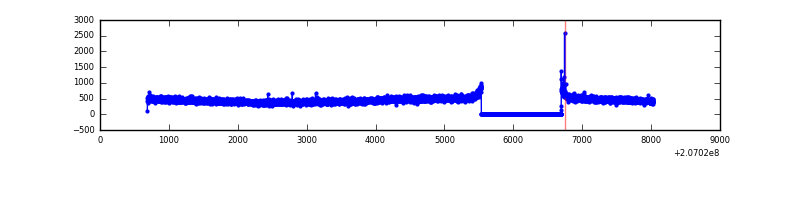 |
| D | 7346 | 6187 | 17 | 17 | 0.23% | 0.27% | 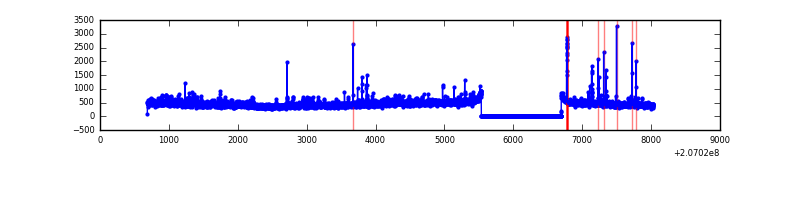 |
Top three noisy pixels from each quadrant. If the there are fewer than three noisy pixels in the level2.evt file, extra rows are filled as -1
| Pixel properties | Quadrant properties | ||||||
|---|---|---|---|---|---|---|---|
| Quadrant | DetID | PixID | Counts | Sigma | Mean | Median | Sigma |
| A | 0 | 13 | 36151 | 237.73 | 738 | 727 | 149.0 |
| A | 12 | 194 | 7393 | 44.73 | 738 | 727 | 149.0 |
| A | 0 | 226 | 7316 | 44.22 | 738 | 727 | 149.0 |
| B | 14 | 167 | 65644 | 455.67 | 748 | 733 | 142.5 |
| B | 12 | 111 | 12879 | 85.26 | 748 | 733 | 142.5 |
| B | 11 | 111 | 9843 | 63.95 | 748 | 733 | 142.5 |
| C | 9 | 16 | 11363 | 64.03 | 716 | 723 | 166.2 |
| C | 9 | 247 | 7237 | 39.2 | 716 | 723 | 166.2 |
| C | 13 | 61 | 5937 | 31.38 | 716 | 723 | 166.2 |
| D | 2 | 63 | 125926 | 668.6 | 699 | 687 | 187.3 |
| D | 13 | 239 | 39088 | 205.01 | 699 | 687 | 187.3 |
| D | 8 | 112 | 33912 | 177.38 | 699 | 687 | 187.3 |
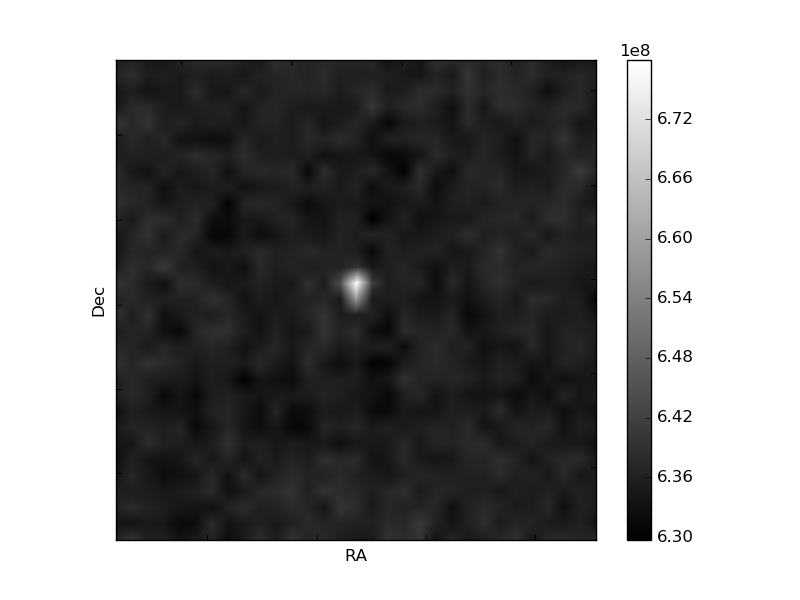
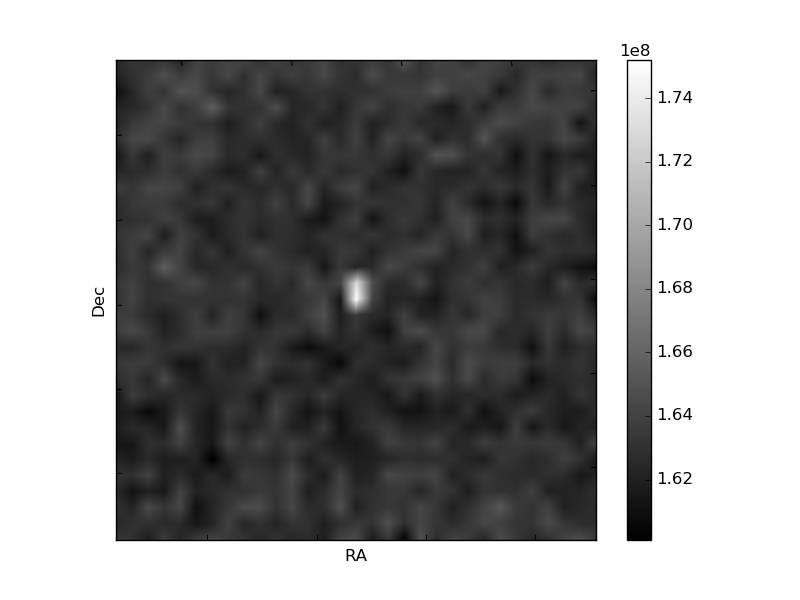
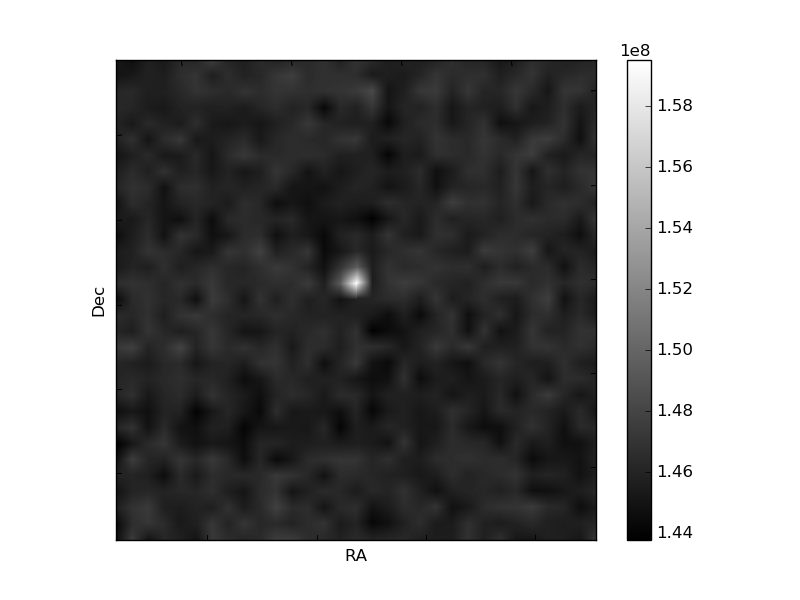
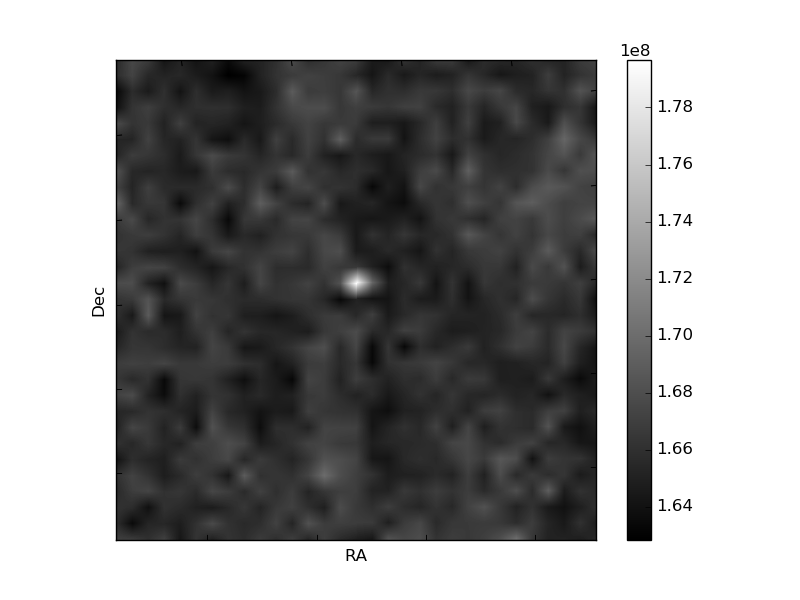
Histogram calculated using DETX and DETY for each event in the final _common_clean file
| Quadrant A | 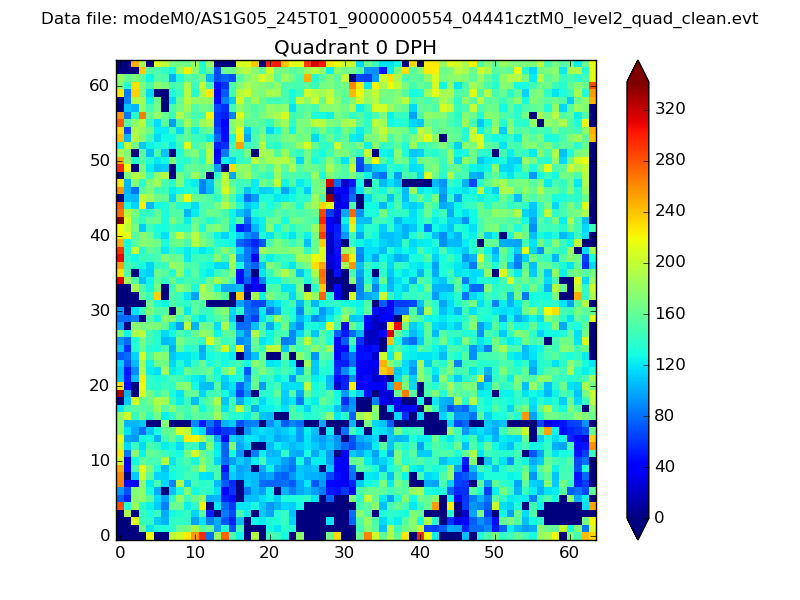 |
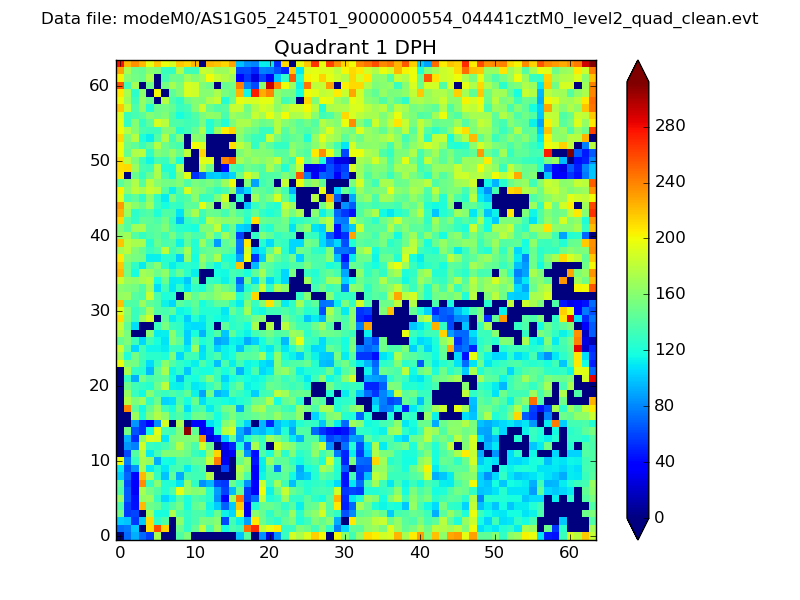 |
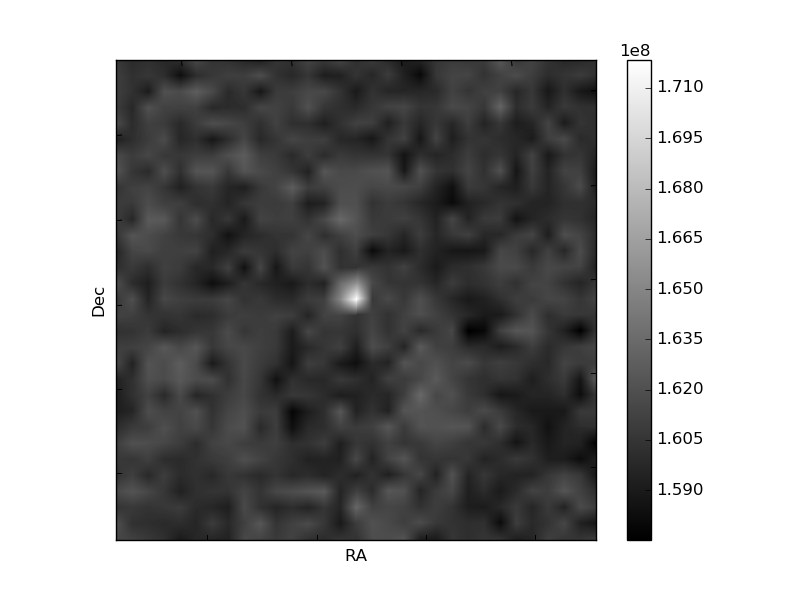
Quadrant B |
|---|---|---|---|
| Quadrant D | 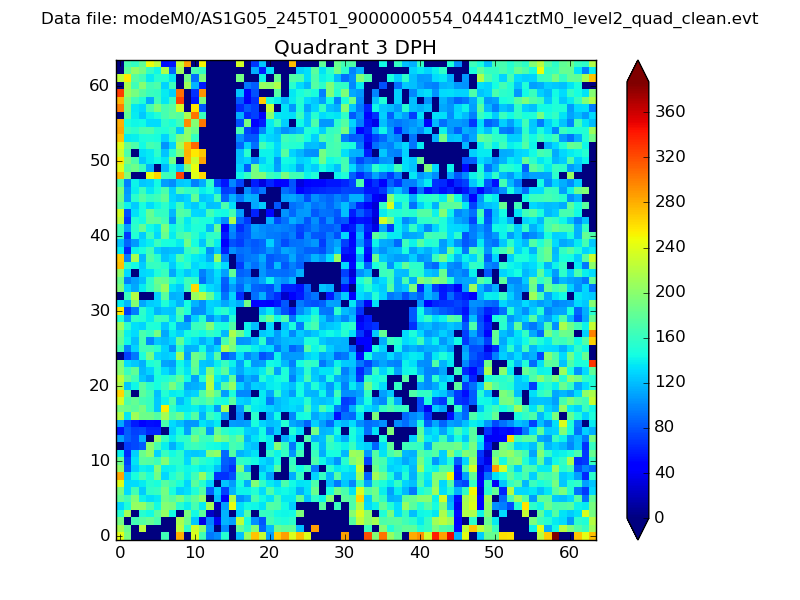 |
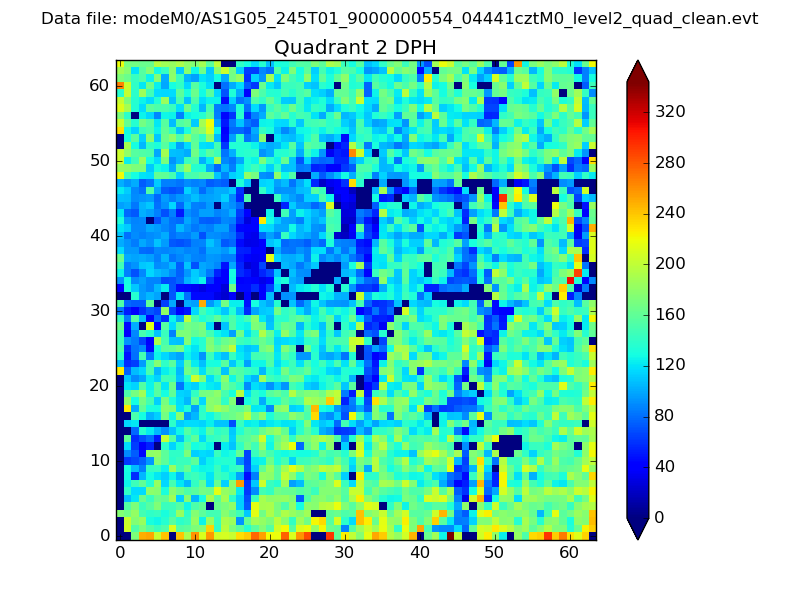 |
Quadrant C |
| Plot type | Count rate plots | Images |
|---|---|---|
| Comparison with Poisson distribution Blue bars denote a histogram of data divided into 1 sec bins. Red curve is a Poisson curve with rate = median count rate of data. |
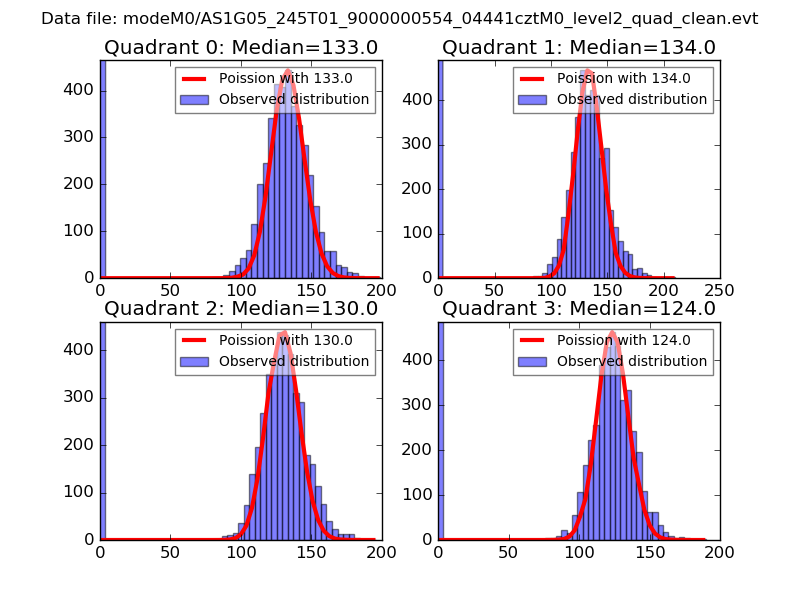 |
 |
| Quadrant-wise count rates Data is divided into 100 sec bins |
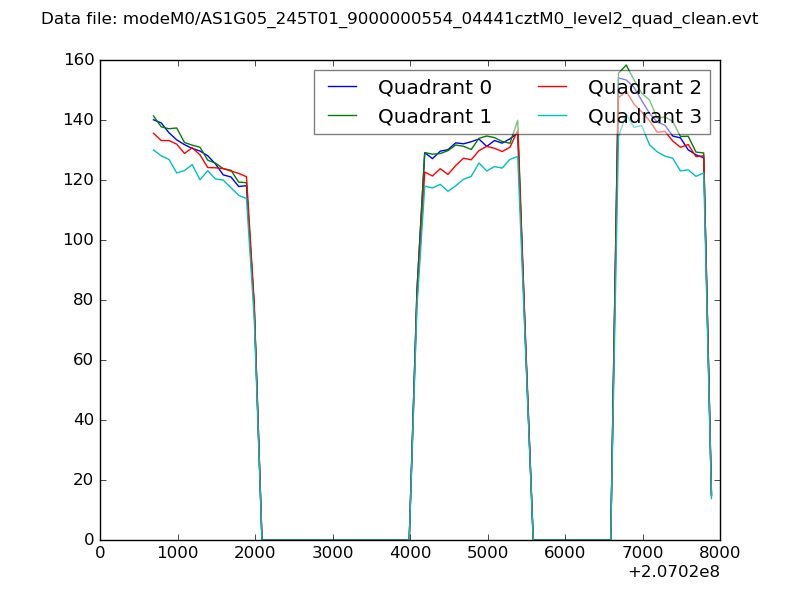 |
|
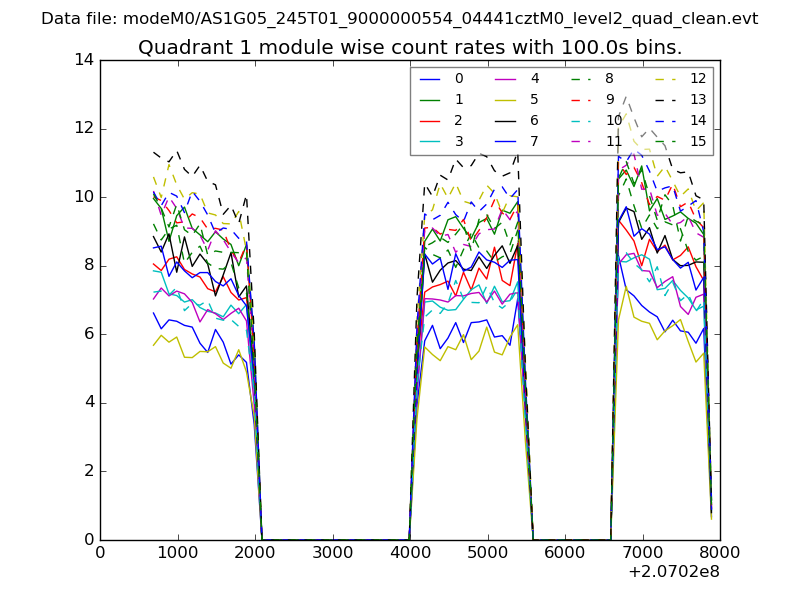
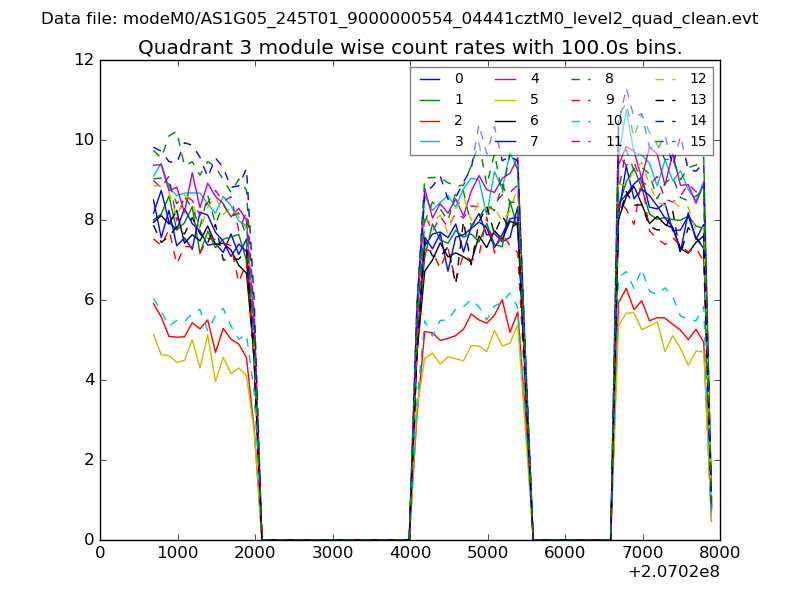
| Module-wise count rates for Quadrant A Data is divided into 100 sec bins |
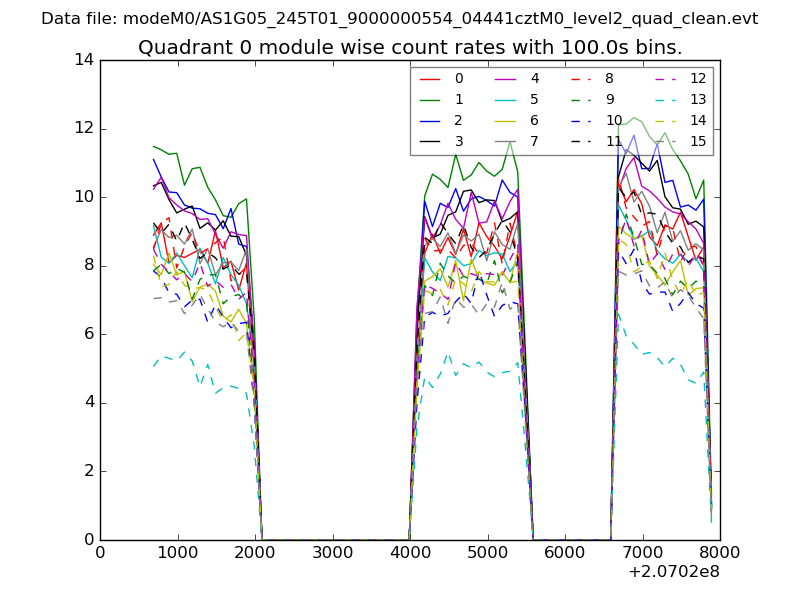 |
 |
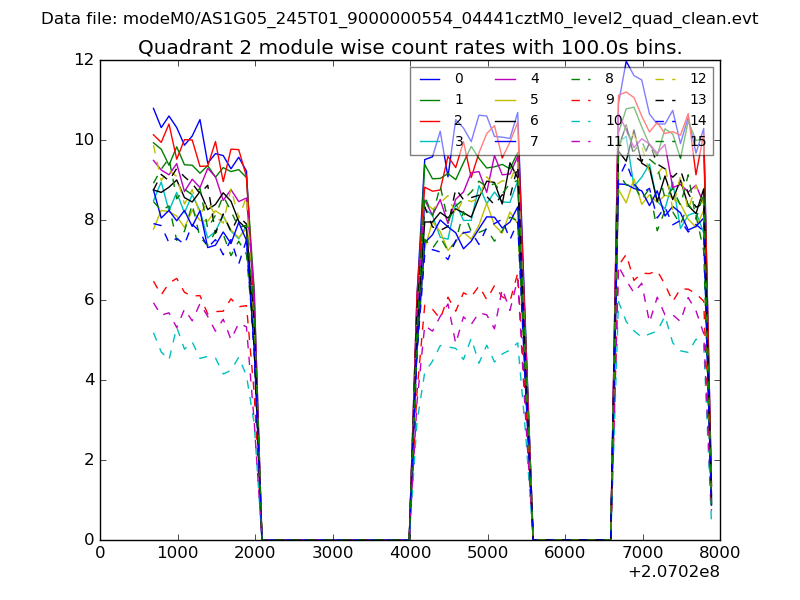
| Module-wise count rates for Quadrant B Data is divided into 100 sec bins |
 |
 |
| Module-wise count rates for Quadrant C Data is divided into 100 sec bins |
 |
 |
| Module-wise count rates for Quadrant D Data is divided into 100 sec bins |
 |
 |
| Parameter | Plot |
|---|---|
| CZT HV Monitor | 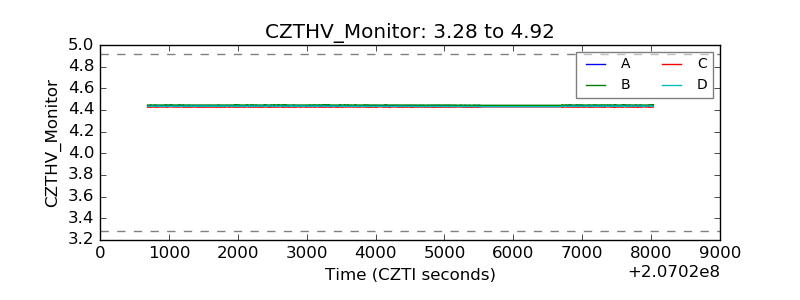 |
| D_VDD | 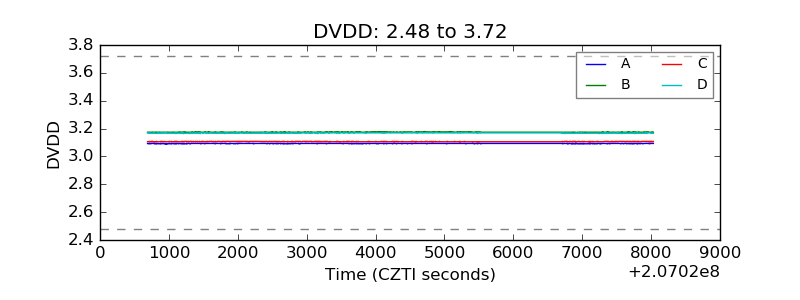 |
| Temperature 1 | 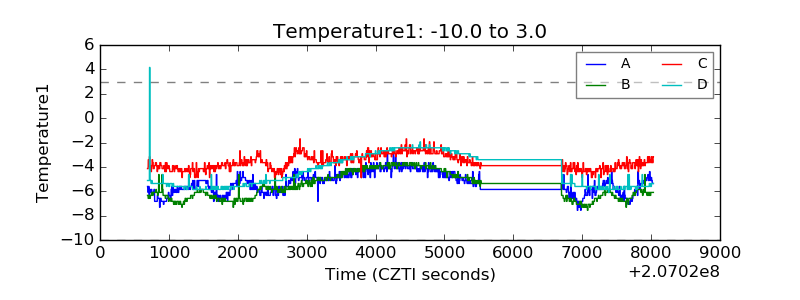 |
| Veto HV Monitor | 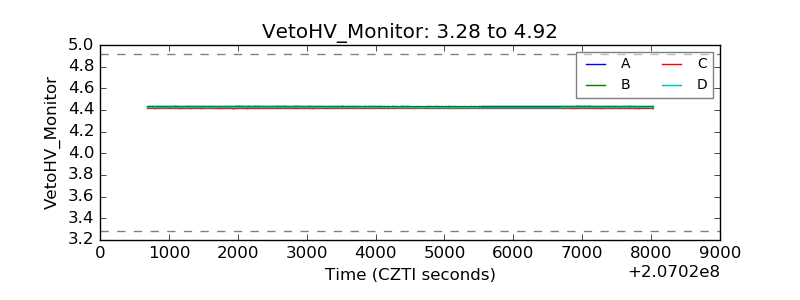 |
| Veto LLD | 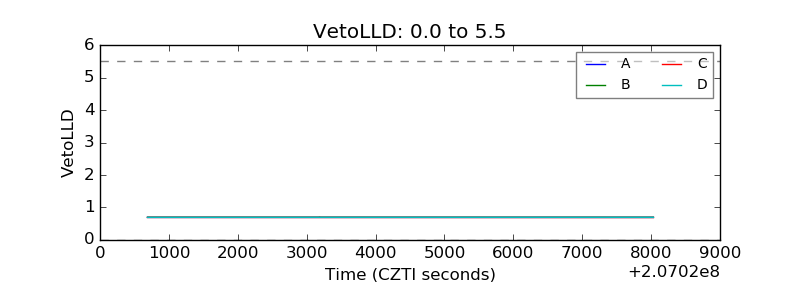 |
| Alpha Counter | 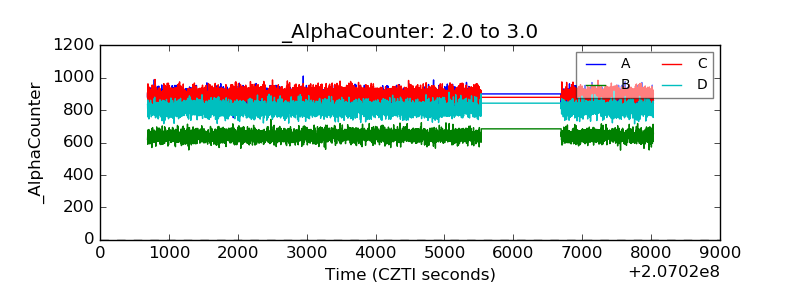 |
| _CPM_Rate | 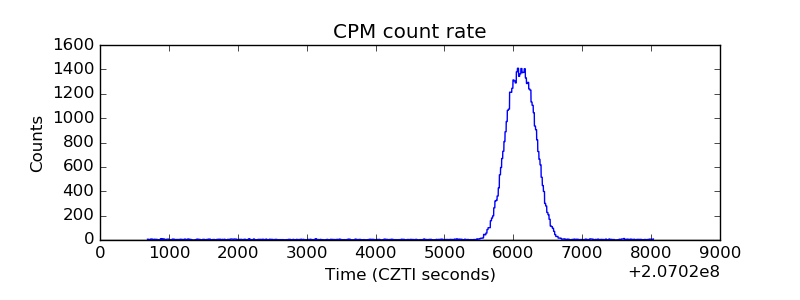 |
| CZT Counter | 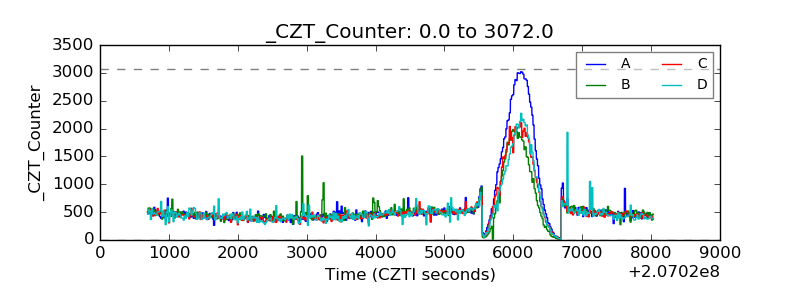 |
| +2.5 Volts monitor | 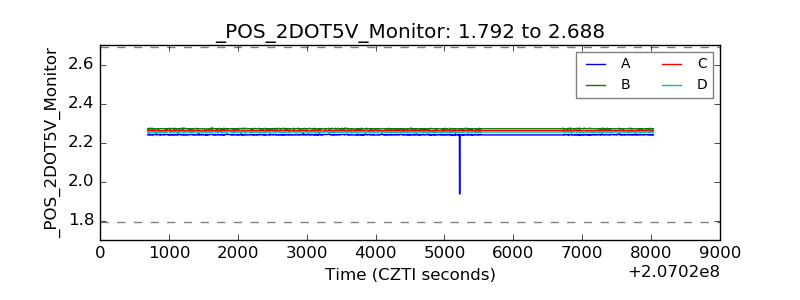 |
| +5 Volts monitor |  |
| _ROLL_ROT | 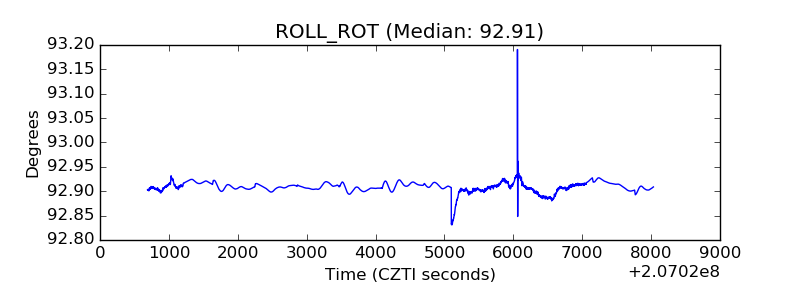 |
| _Roll_DEC | 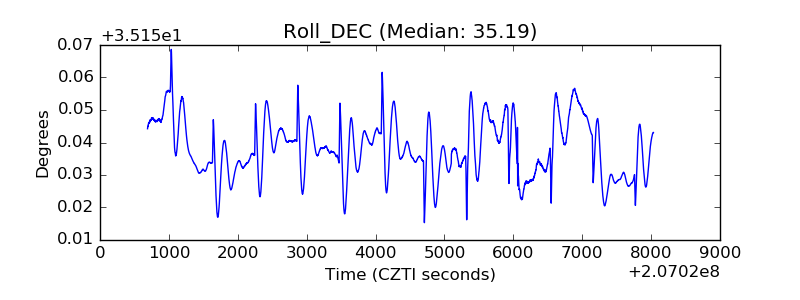 |
| _Roll_RA | 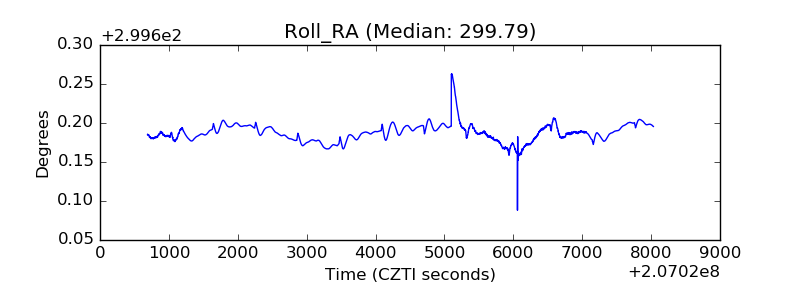 |
| Veto Counter |  |