| Param | Original file | Final file |
|---|---|---|
| Filename | modeM0/AS1G05_245T01_9000000554_04442cztM0_level2.evt | modeM0/AS1G05_245T01_9000000554_04442cztM0_level2_quad_clean.evt |
| Size (bytes) | 928,440,000 | 173,419,200 |
| Size | 885.4 MB | 165.4 MB |
| Events in quadrant A | 6,789,308 | 1,085,472 |
| Events in quadrant B | 6,860,944 | 1,093,884 |
| Events in quadrant C | 6,569,291 | 1,063,163 |
| Events in quadrant D | 6,916,638 | 1,009,265 |
| Mode SS | |||
|---|---|---|---|
| Quadrant | BADHDUFLAG | Total packets | Discarded packets |
| A | 0 | 296 | 0 |
| B | 0 | 296 | 0 |
| C | 0 | 296 | 0 |
| D | 0 | 296 | 0 |
| Mode M0 | |||
|---|---|---|---|
| Quadrant | BADHDUFLAG | Total packets | Discarded packets |
| A | 0 | 29947 | 2 |
| B | 0 | 29879 | 2 |
| C | 0 | 29640 | 2 |
| D | 0 | 31102 | 2 |
| Mode M9 | |||
|---|---|---|---|
| Quadrant | BADHDUFLAG | Total packets | Discarded packets |
| A | 0 | 34 | 0 |
| B | 0 | 34 | 0 |
| C | 0 | 34 | 0 |
| D | 0 | 34 | 0 |
| Quadrant | Total seconds | Saturated seconds | Saturation percentage |
|---|---|---|---|
| A | 14491 | 86 | 0.593472% |
| B | 14491 | 93 | 0.641778% |
| C | 14491 | 45 | 0.310538% |
| D | 14491 | 152 | 1.048927% |
Noise dominated data is calculated using 1-second bins in cleaned event files. If a bin has >2000 counts, and if more than 50% of those come from <1% of pixels, then it is considered to be noise-dominated and hence unusable.
| Quadrant | # 1 sec bins | Bins with >0 counts | Bins with >2000 counts | High rate bins dominated by noise | Noise dominated (total time) | Noise dominated (detector-on time) | Marked lightcurve |
|---|---|---|---|---|---|---|---|
| A | 17913 | 14495 | 13 | 13 | 0.07% | 0.09% | 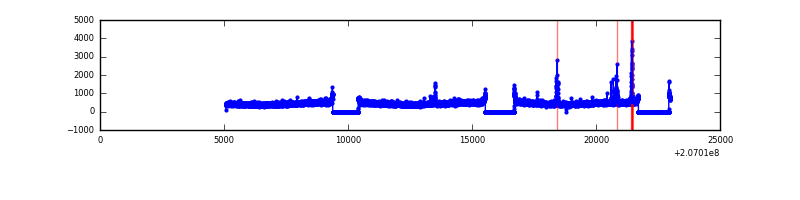 |
| B | 17913 | 14495 | 1 | 1 | 0.01% | 0.01% | 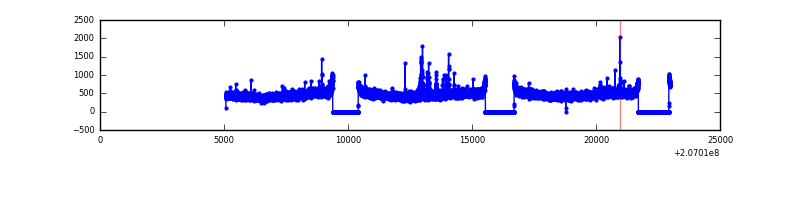 |
| C | 17913 | 14495 | 1 | 1 | 0.01% | 0.01% | 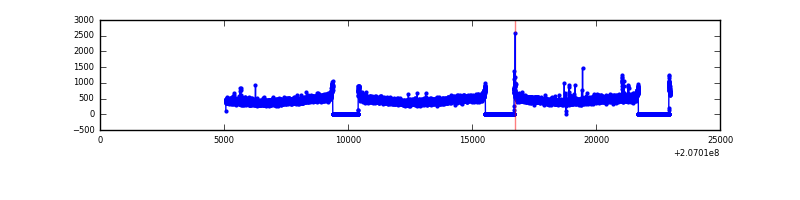 |
| D | 17913 | 14495 | 102 | 102 | 0.57% | 0.70% | 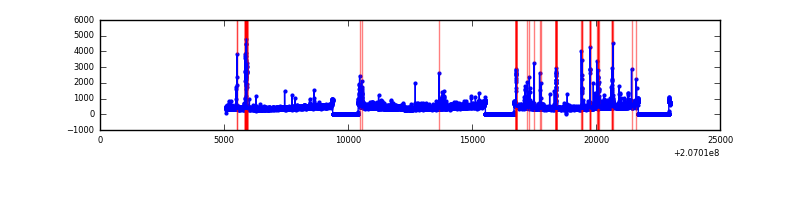 |
Top three noisy pixels from each quadrant. If the there are fewer than three noisy pixels in the level2.evt file, extra rows are filled as -1
| Pixel properties | Quadrant properties | ||||||
|---|---|---|---|---|---|---|---|
| Quadrant | DetID | PixID | Counts | Sigma | Mean | Median | Sigma |
| A | 0 | 13 | 68531 | 193.15 | 1723 | 1693 | 346.0 |
| A | 0 | 50 | 43263 | 120.13 | 1723 | 1693 | 346.0 |
| A | 8 | 15 | 41253 | 114.32 | 1723 | 1693 | 346.0 |
| B | 14 | 167 | 84645 | 251.66 | 1740 | 1707 | 329.6 |
| B | 12 | 111 | 30553 | 87.53 | 1740 | 1707 | 329.6 |
| B | 15 | 204 | 25674 | 72.72 | 1740 | 1707 | 329.6 |
| C | 9 | 16 | 48051 | 121.1 | 1666 | 1685 | 382.9 |
| C | 9 | 247 | 14716 | 34.03 | 1666 | 1685 | 382.9 |
| C | 13 | 61 | 13500 | 30.86 | 1666 | 1685 | 382.9 |
| D | 2 | 63 | 203714 | 476.64 | 1633 | 1602 | 424.0 |
| D | 2 | 31 | 158080 | 369.02 | 1633 | 1602 | 424.0 |
| D | 8 | 112 | 82460 | 190.69 | 1633 | 1602 | 424.0 |
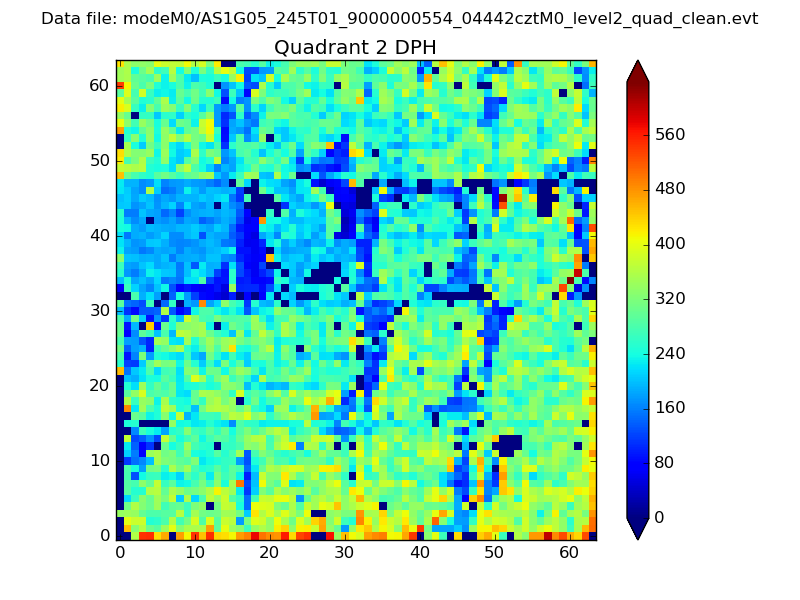
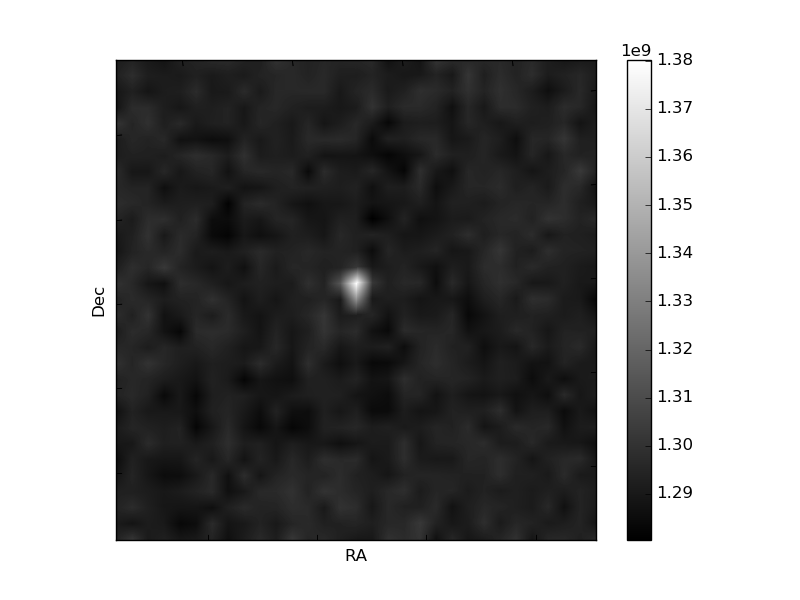
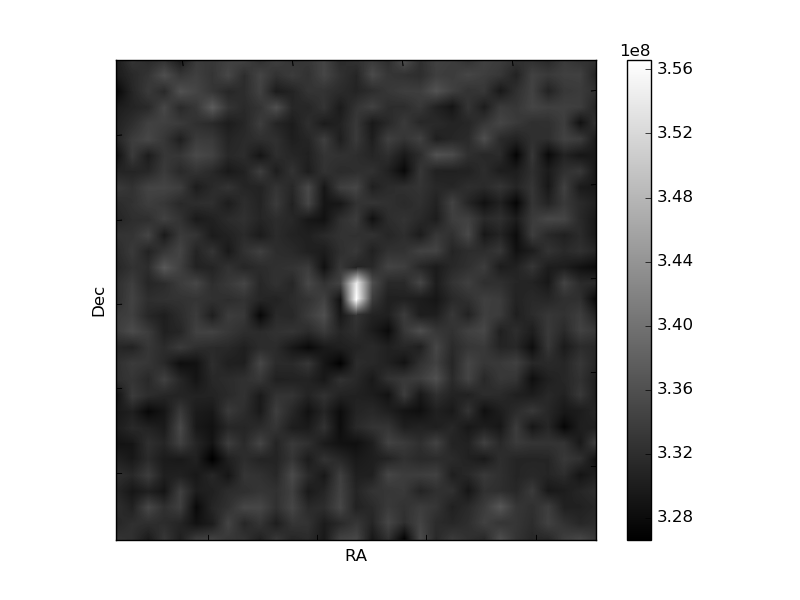
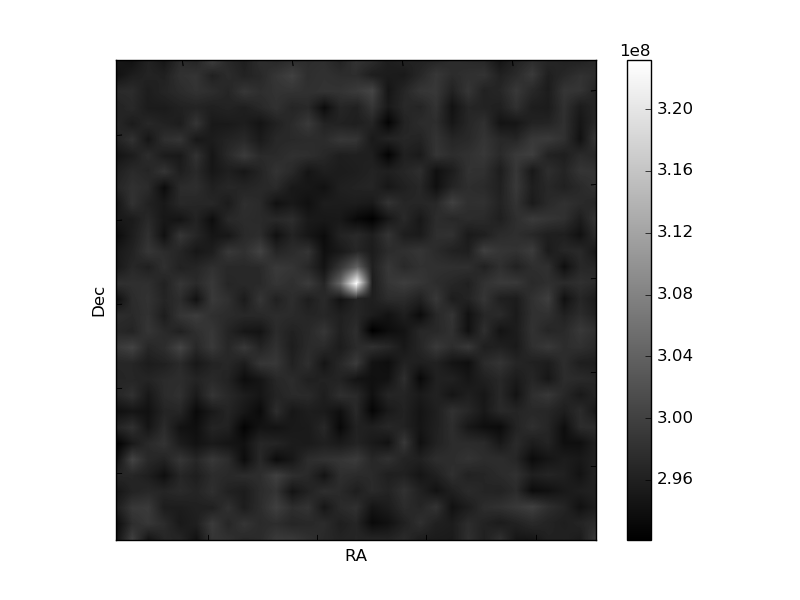
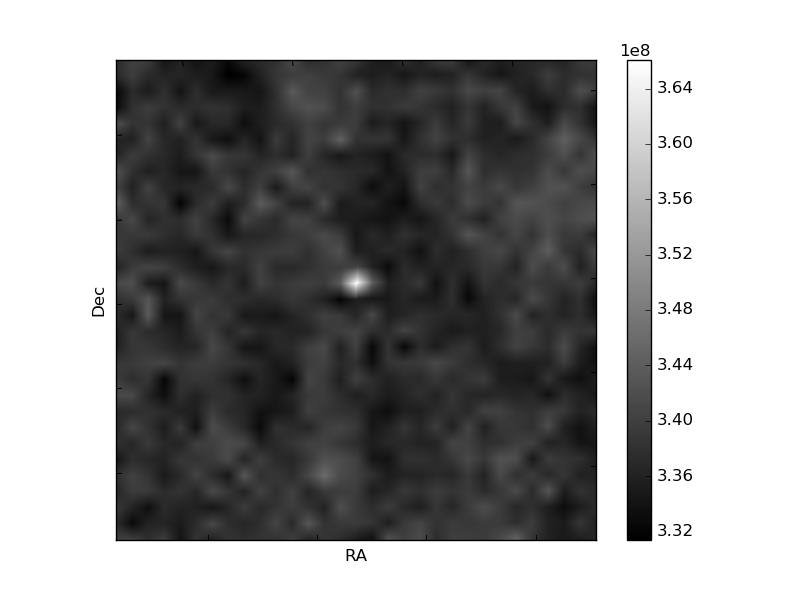
Histogram calculated using DETX and DETY for each event in the final _common_clean file
| Quadrant A | 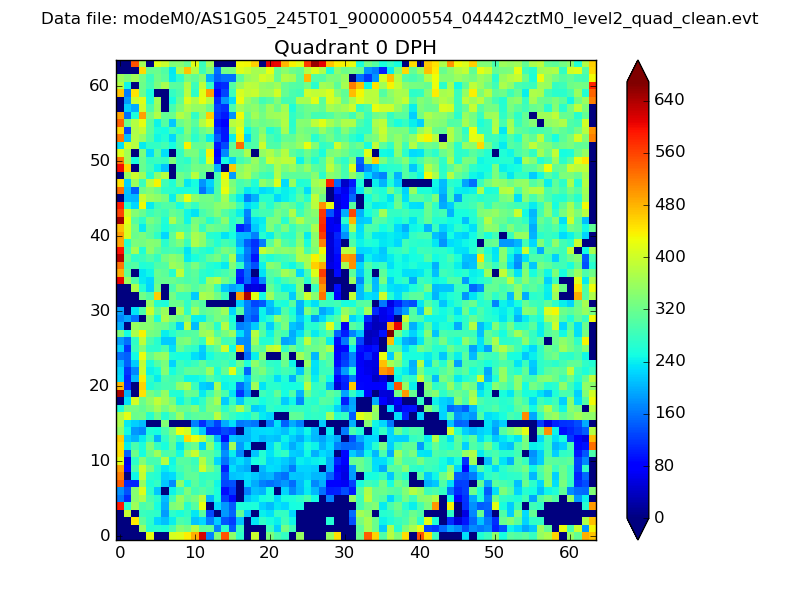 |
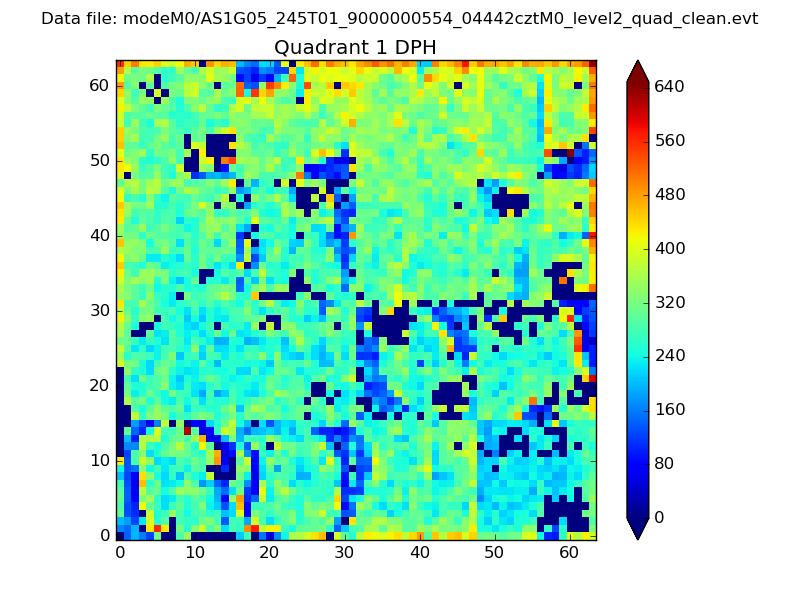 |
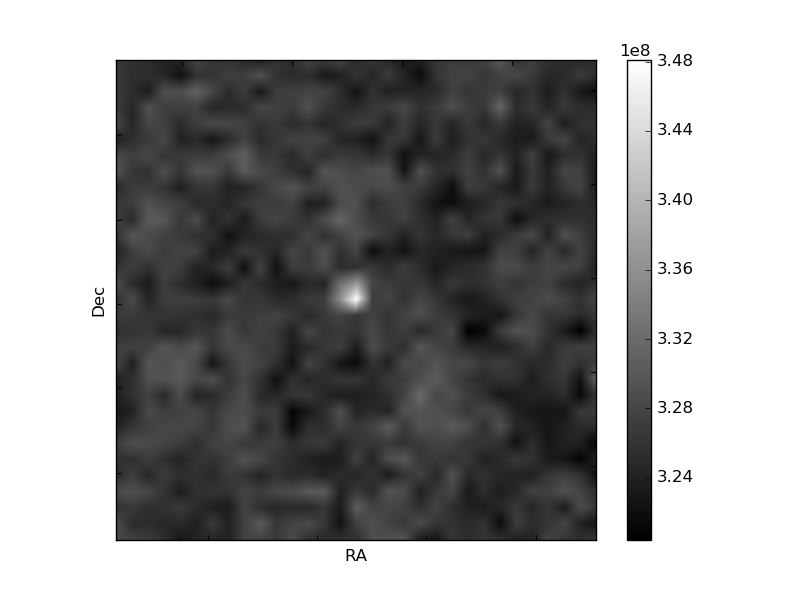
Quadrant B |
|---|---|---|---|
| Quadrant D | 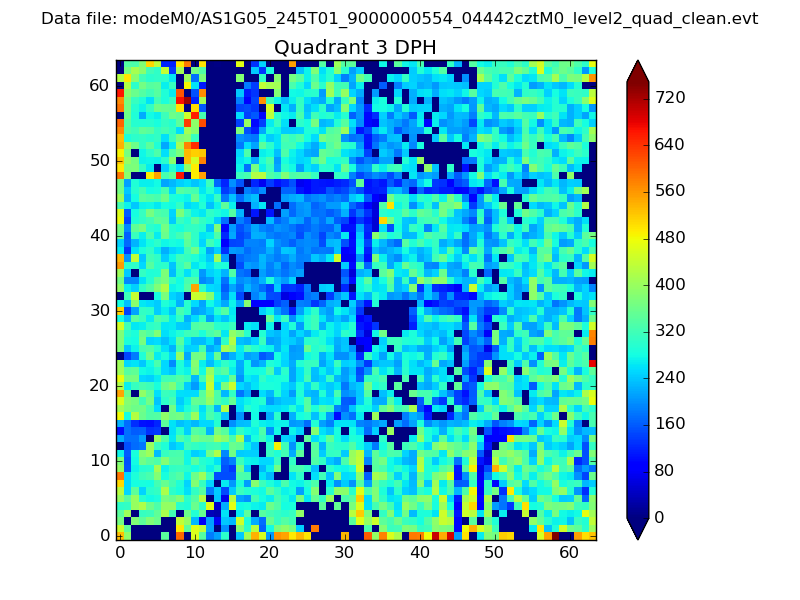 |
 |
Quadrant C |
| Plot type | Count rate plots | Images |
|---|---|---|
| Comparison with Poisson distribution Blue bars denote a histogram of data divided into 1 sec bins. Red curve is a Poisson curve with rate = median count rate of data. |
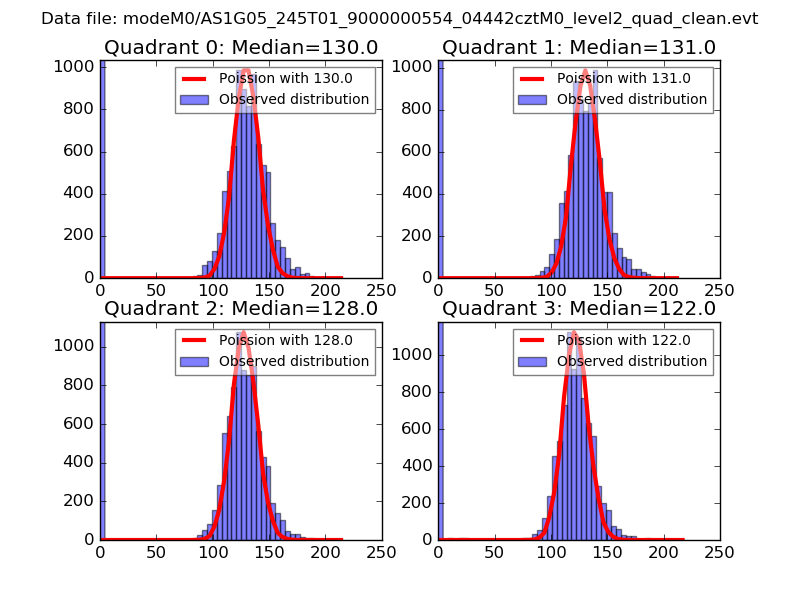 |
 |
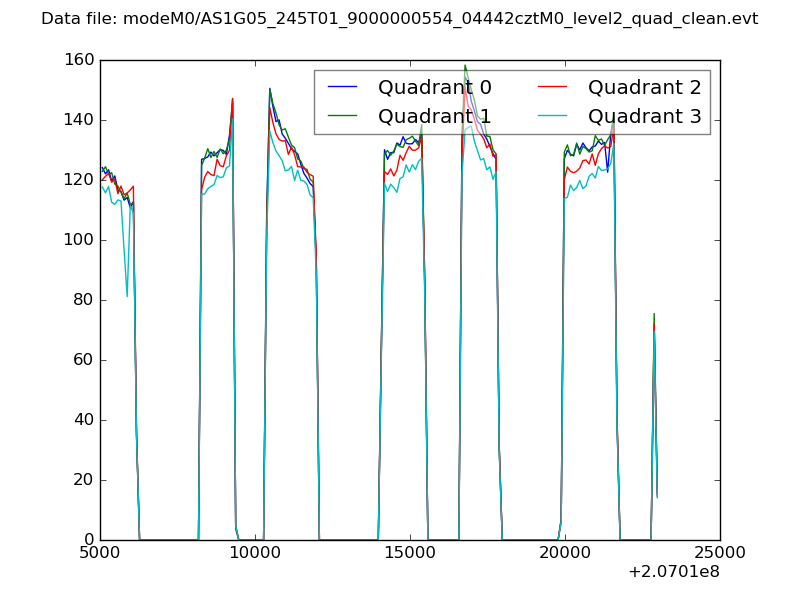
| Quadrant-wise count rates Data is divided into 100 sec bins |
 |
|
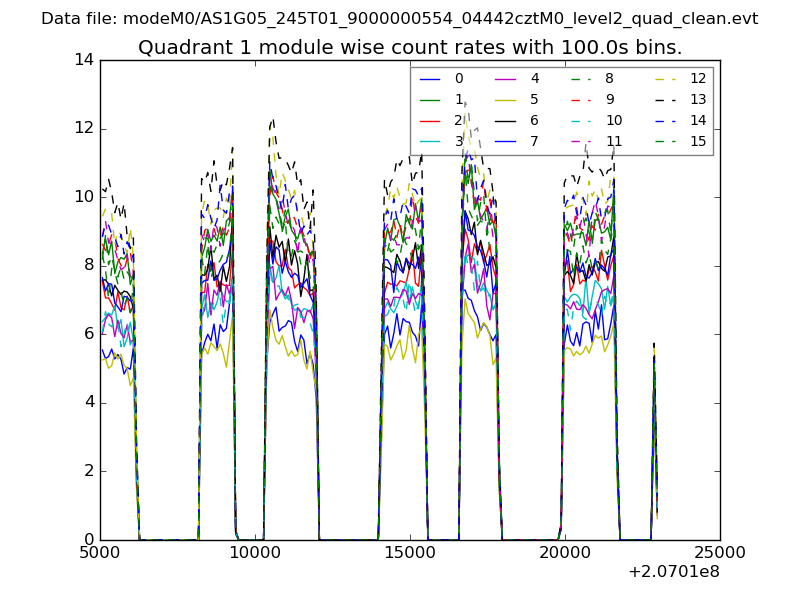
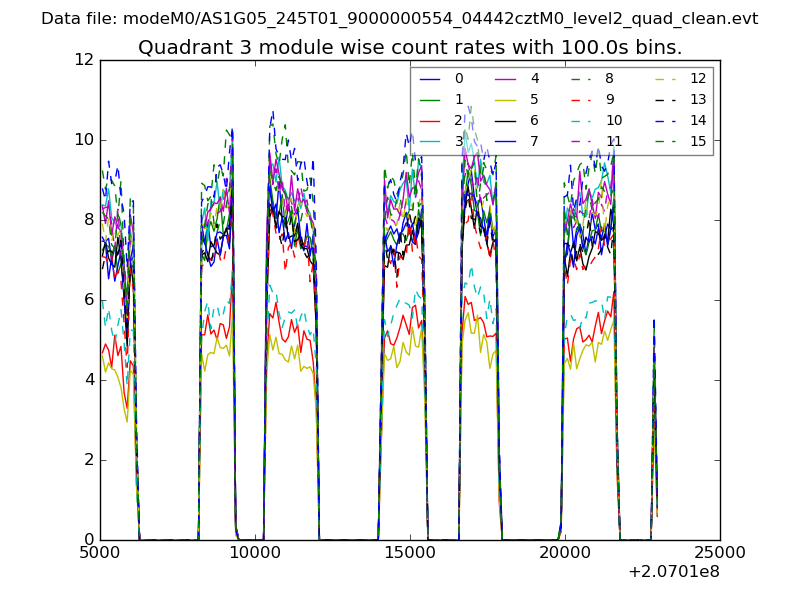
| Module-wise count rates for Quadrant A Data is divided into 100 sec bins |
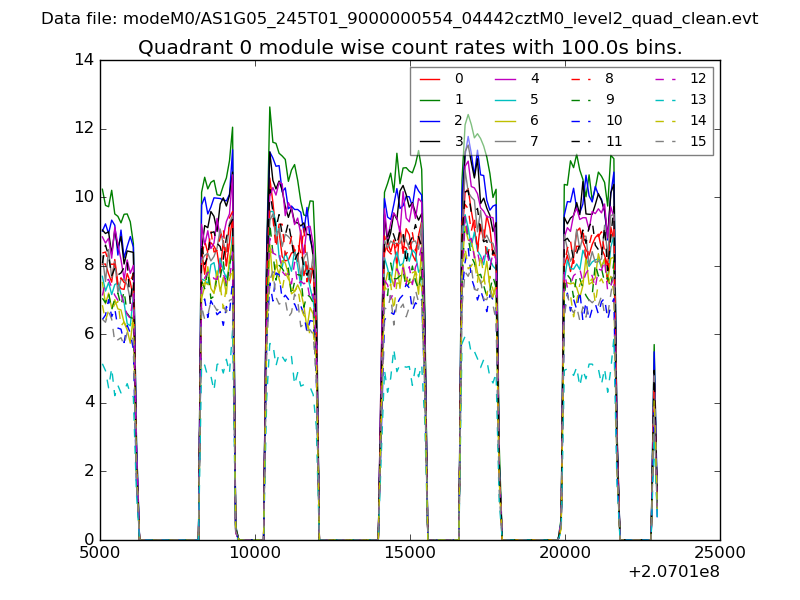 |
 |
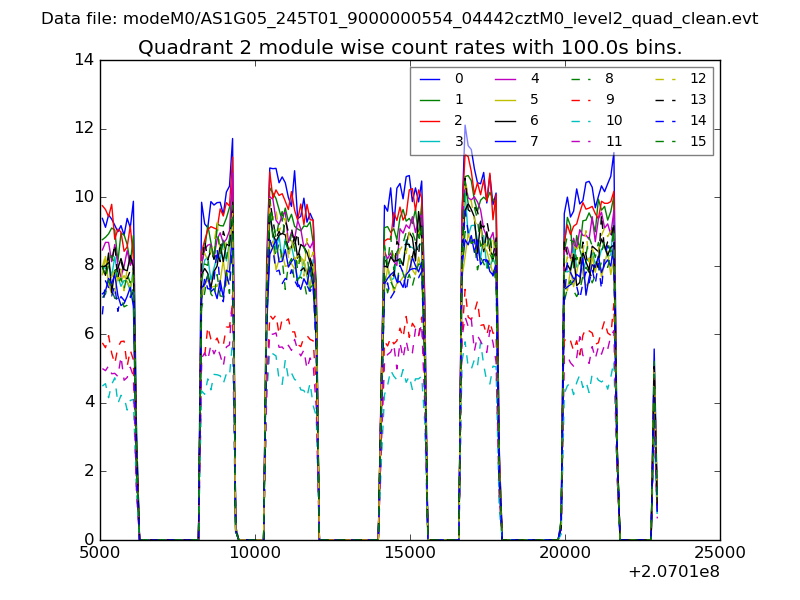
| Module-wise count rates for Quadrant B Data is divided into 100 sec bins |
 |
 |
| Module-wise count rates for Quadrant C Data is divided into 100 sec bins |
 |
 |
| Module-wise count rates for Quadrant D Data is divided into 100 sec bins |
 |
 |
| Parameter | Plot |
|---|---|
| CZT HV Monitor | 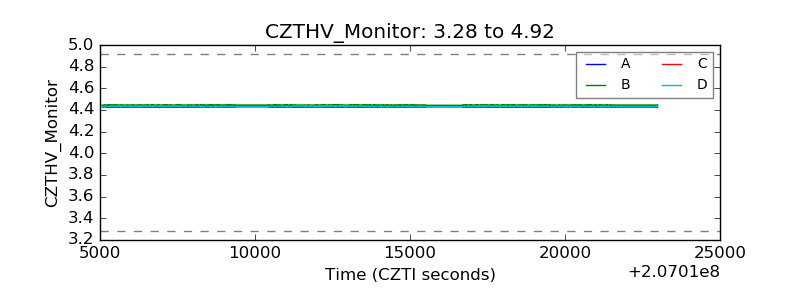 |
| D_VDD | 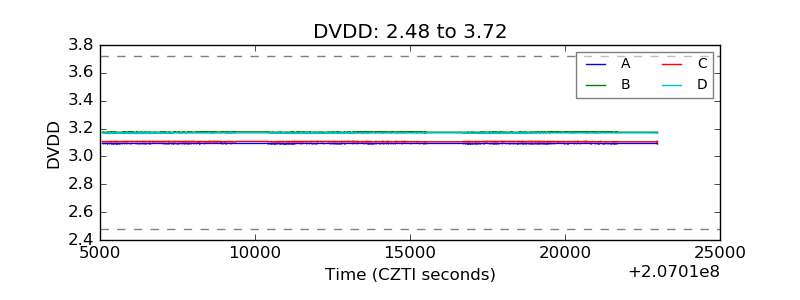 |
| Temperature 1 | 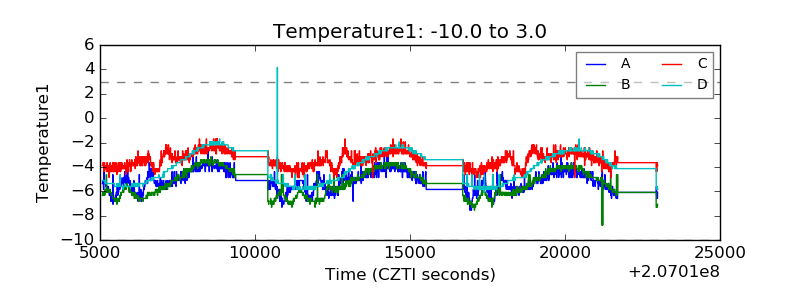 |
| Veto HV Monitor | 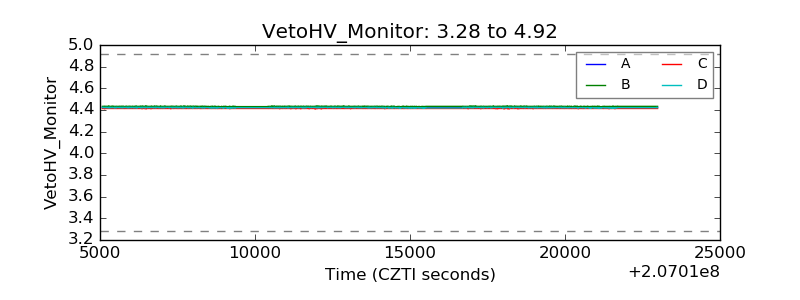 |
| Veto LLD | 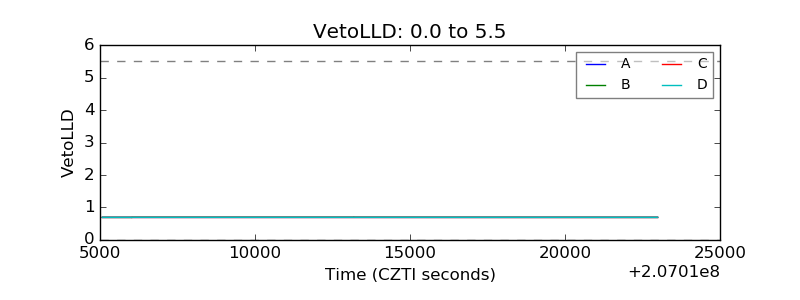 |
| Alpha Counter | 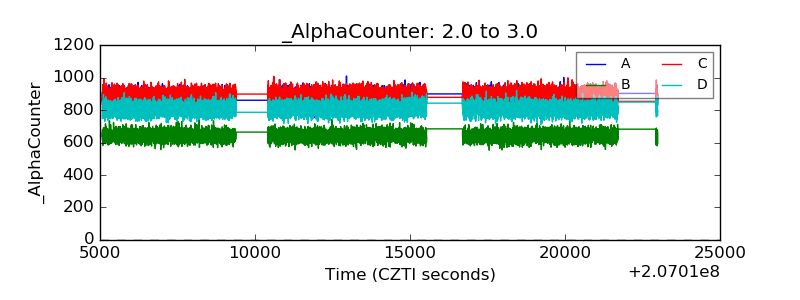 |
| _CPM_Rate | 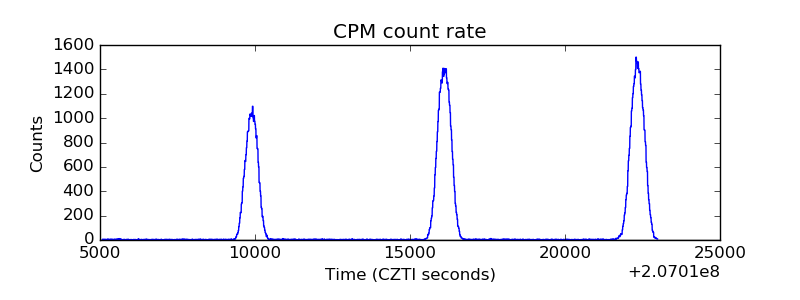 |
| CZT Counter | 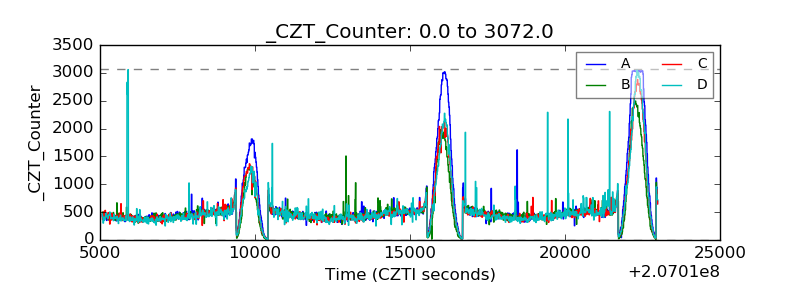 |
| +2.5 Volts monitor | 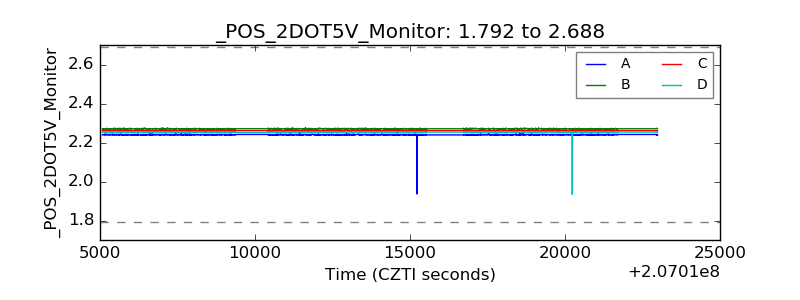 |
| +5 Volts monitor | 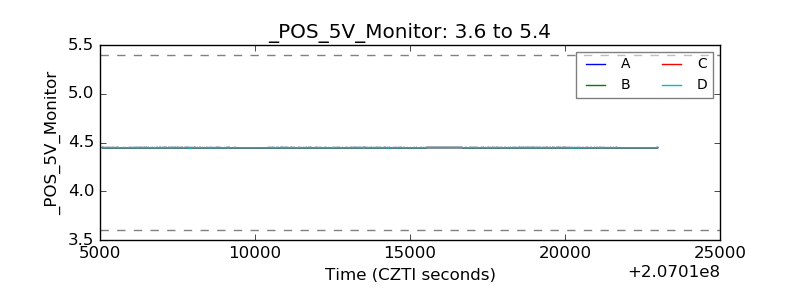 |
| _ROLL_ROT | 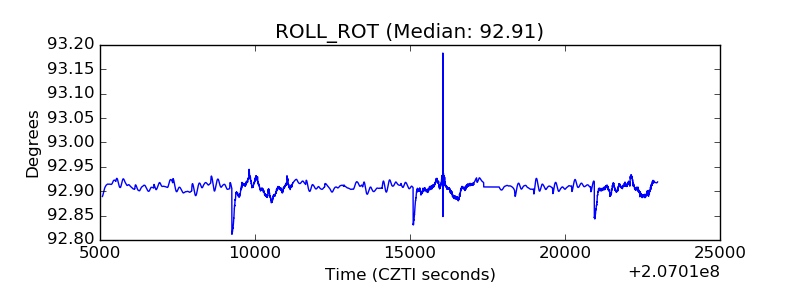 |
| _Roll_DEC | 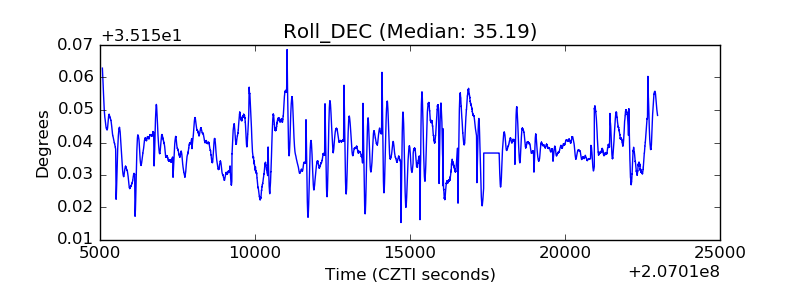 |
| _Roll_RA | 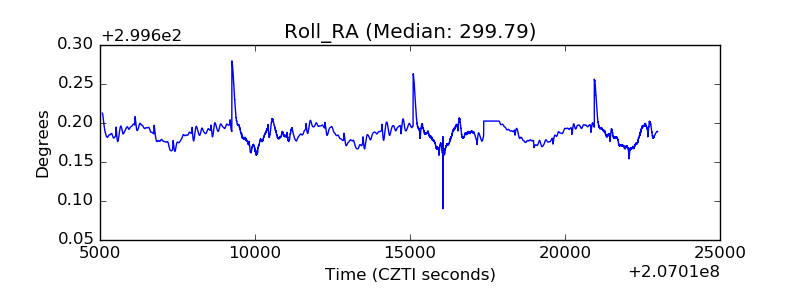 |
| Veto Counter | 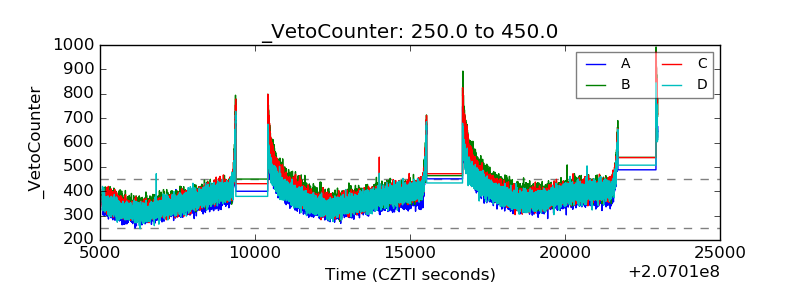 |