| Param | Original file | Final file |
|---|---|---|
| Filename | modeM0/AS1G05_253T01_9000000560cztM0_level2.fits | modeM0/AS1G05_253T01_9000000560cztM0_level2_quad_clean.evt |
| Size (bytes) | 1,051,876,800 | 1,098,115,200 |
| Size | 1003.1 MB | 1.0 GB |
| Events in quadrant A | 6,248,734 | 6,557,220 |
| Events in quadrant B | 6,086,888 | 6,532,105 |
| Events in quadrant C | 6,244,650 | 6,401,179 |
| Events in quadrant D | 5,295,232 | 5,790,532 |
| Mode SS | |||
|---|---|---|---|
| Quadrant | BADHDUFLAG | Total packets | Discarded packets |
| A | 0 | 2313 | 0 |
| B | 0 | 2322 | 0 |
| C | 0 | 2274 | 0 |
| D | 0 | 2271 | 0 |
| Mode M9 | |||
|---|---|---|---|
| Quadrant | BADHDUFLAG | Total packets | Discarded packets |
| A | 0 | 178 | 0 |
| B | 0 | 177 | 0 |
| C | 0 | 178 | 0 |
| D | 0 | 178 | 0 |
| Mode M0 | |||
|---|---|---|---|
| Quadrant | BADHDUFLAG | Total packets | Discarded packets |
| A | 0 | 248243 | 0 |
| B | 0 | 249390 | 0 |
| C | 0 | 244783 | 0 |
| D | 0 | 276933 | 0 |
| Quadrant | Total seconds | Saturated seconds | Saturation percentage |
|---|---|---|---|
| A | 116638 | 1990 | 1.706134% |
| B | 116659 | 1659 | 1.422093% |
| C | 116750 | 1080 | 0.925054% |
| D | 116611 | 3981 | 3.413915% |
Noise dominated data is calculated using 1-second bins in cleaned event files. If a bin has >2000 counts, and if more than 50% of those come from <1% of pixels, then it is considered to be noise-dominated and hence unusable.
| Quadrant | # 1 sec bins | Bins with >0 counts | Bins with >2000 counts | High rate bins dominated by noise | Noise dominated (total time) | Noise dominated (detector-on time) | Marked lightcurve |
|---|---|---|---|---|---|---|---|
| A | 147129 | 117698 | 0 | 0 | 0.00% | 0.00% |  |
| B | 147129 | 117715 | 0 | 0 | 0.00% | 0.00% |  |
| C | 147129 | 117782 | 0 | 0 | 0.00% | 0.00% |  |
| D | 147129 | 117636 | 0 | 0 | 0.00% | 0.00% | 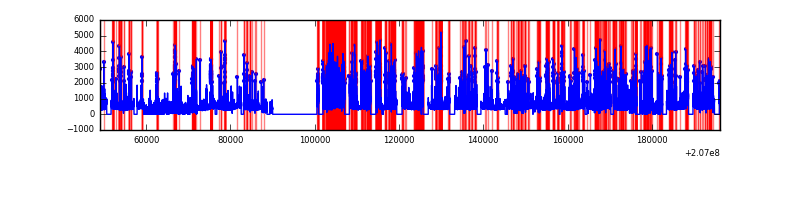 |
Top three noisy pixels from each quadrant. If the there are fewer than three noisy pixels in the level2.evt file, extra rows are filled as -1
| Pixel properties | Quadrant properties | ||||||
|---|---|---|---|---|---|---|---|
| Quadrant | DetID | PixID | Counts | Sigma | Mean | Median | Sigma |
| A | 14 | 188 | 6131 | 10.92 | 1625 | 1511 | 422.9 |
| A | 7 | 110 | 5373 | 9.13 | 1625 | 1511 | 422.9 |
| A | 0 | 29 | 5357 | 9.09 | 1625 | 1511 | 422.9 |
| B | 2 | 9 | 5314 | 11.6 | 1606 | 1522 | 326.8 |
| B | 12 | 226 | 4464 | 9.0 | 1606 | 1522 | 326.8 |
| B | 5 | 128 | 4240 | 8.32 | 1606 | 1522 | 326.8 |
| C | 1 | 80 | 4583 | 7.01 | 1648 | 1520 | 436.9 |
| C | 1 | 81 | 4528 | 6.88 | 1648 | 1520 | 436.9 |
| C | 12 | 241 | 4435 | 6.67 | 1648 | 1520 | 436.9 |
| D | 11 | 82 | 4445 | 7.6 | 1511 | 1371 | 404.2 |
| D | 4 | 160 | 4073 | 6.68 | 1511 | 1371 | 404.2 |
| D | 3 | 14 | 3970 | 6.43 | 1511 | 1371 | 404.2 |
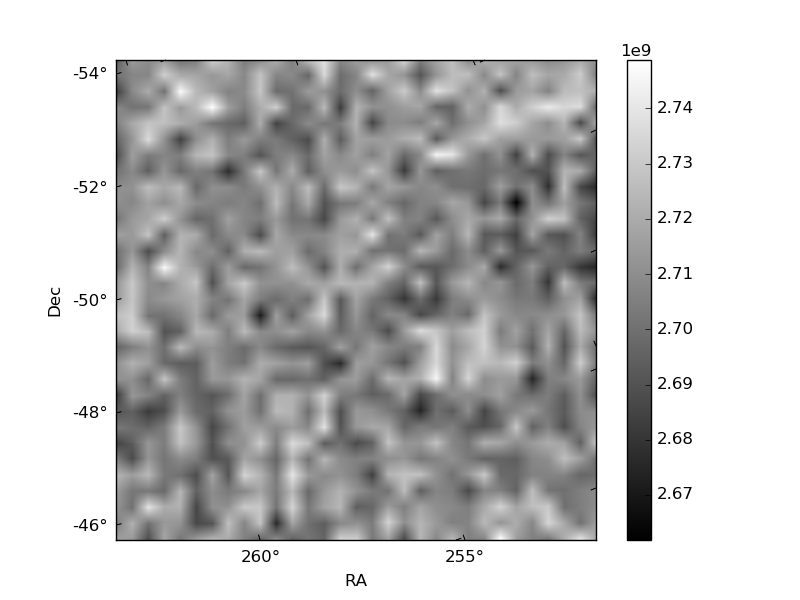
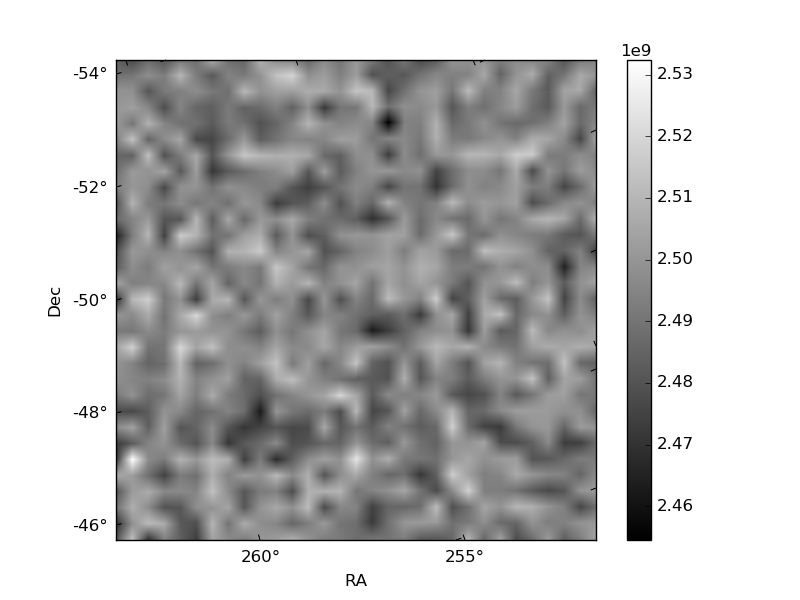
Histogram calculated using DETX and DETY for each event in the final _common_clean file
| Quadrant A |  |
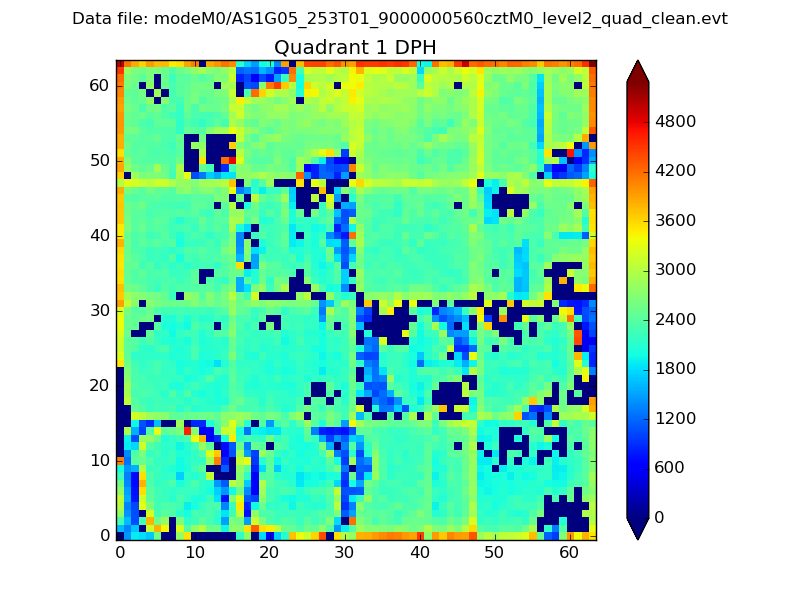 |
Quadrant B |
|---|---|---|---|
| Quadrant D |  |
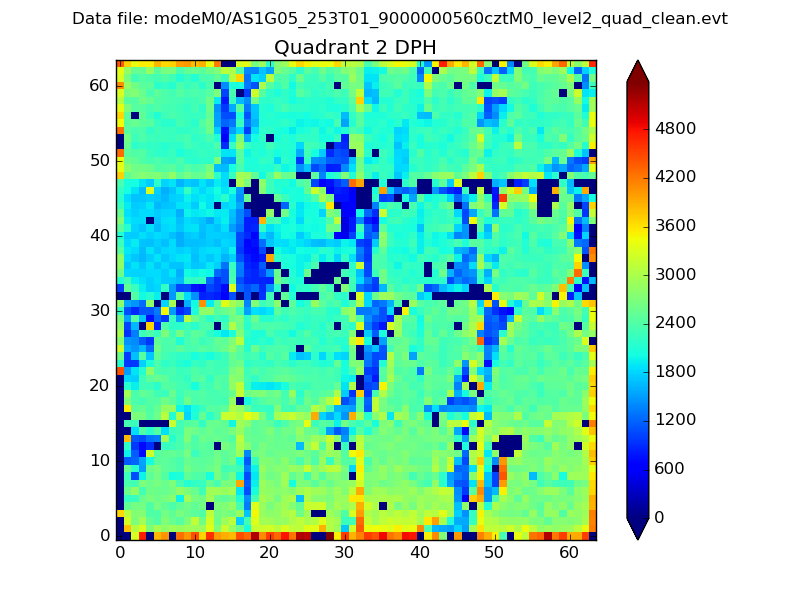 |
Quadrant C |
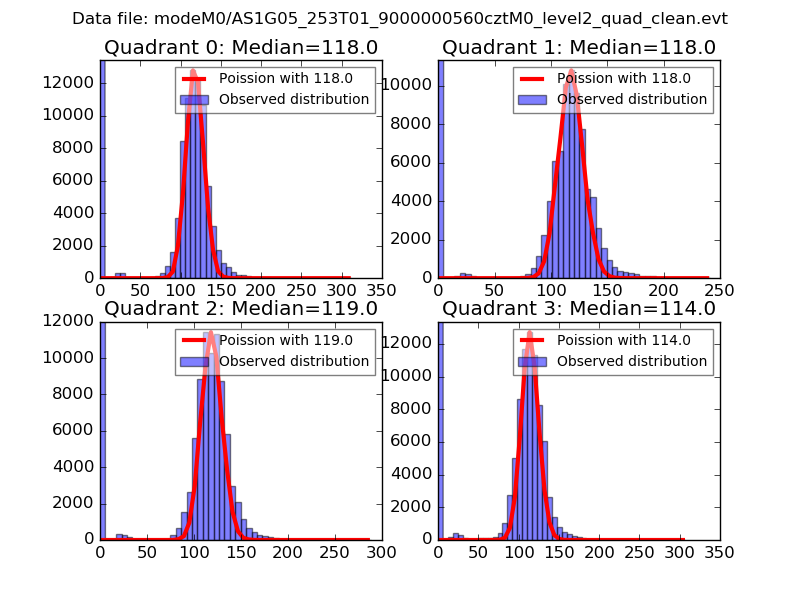
| Plot type | Count rate plots | Images |
|---|---|---|
| Comparison with Poisson distribution Blue bars denote a histogram of data divided into 1 sec bins. Red curve is a Poisson curve with rate = median count rate of data. |
 |
 |
| Quadrant-wise count rates Data is divided into 100 sec bins |
 |
|
| Module-wise count rates for Quadrant A Data is divided into 100 sec bins |
 |
 |
| Module-wise count rates for Quadrant B Data is divided into 100 sec bins |
 |
 |
| Module-wise count rates for Quadrant C Data is divided into 100 sec bins |
 |
 |
| Module-wise count rates for Quadrant D Data is divided into 100 sec bins |
 |
 |
| Parameter | Plot |
|---|---|
| CZT HV Monitor |  |
| D_VDD |  |
| Temperature 1 |  |
| Veto HV Monitor |  |
| Veto LLD |  |
| Alpha Counter |  |
| _CPM_Rate |  |
| CZT Counter |  |
| +2.5 Volts monitor |  |
| +5 Volts monitor |  |
| _ROLL_ROT |  |
| _Roll_DEC | 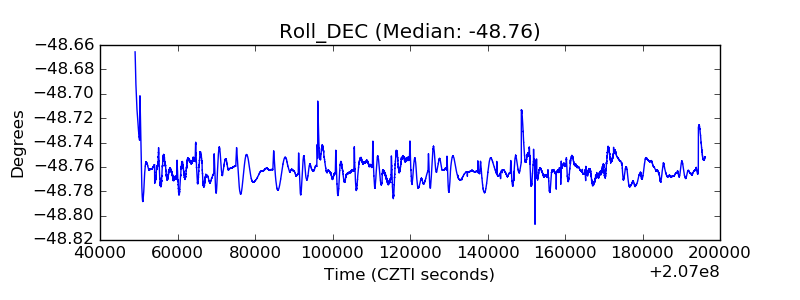 |
| _Roll_RA |  |
| Veto Counter |  |