| Param | Original file | Final file |
|---|---|---|
| Filename | modeM0/AS1G05_253T01_9000000560_04447cztM0_level2.evt | modeM0/AS1G05_253T01_9000000560_04447cztM0_level2_quad_clean.evt |
| Size (bytes) | 289,987,200 | 49,417,920 |
| Size | 276.6 MB | 47.1 MB |
| Events in quadrant A | 2,152,592 | 293,987 |
| Events in quadrant B | 2,098,205 | 292,241 |
| Events in quadrant C | 2,119,735 | 303,076 |
| Events in quadrant D | 2,100,531 | 287,045 |
| Mode SS | |||
|---|---|---|---|
| Quadrant | BADHDUFLAG | Total packets | Discarded packets |
| A | 0 | 136 | 38 |
| B | 0 | 137 | 37 |
| C | 0 | 138 | 42 |
| D | 0 | 137 | 42 |
| Mode M9 | |||
|---|---|---|---|
| Quadrant | BADHDUFLAG | Total packets | Discarded packets |
| A | 0 | 3 | 0 |
| B | 0 | 3 | 0 |
| C | 0 | 3 | 0 |
| D | 0 | 3 | 0 |
| Mode M0 | |||
|---|---|---|---|
| Quadrant | BADHDUFLAG | Total packets | Discarded packets |
| A | 0 | 14307 | 4822 |
| B | 0 | 13875 | 4542 |
| C | 0 | 13984 | 4369 |
| D | 0 | 14642 | 5063 |
| Quadrant | Total seconds | Saturated seconds | Saturation percentage |
|---|---|---|---|
| A | 4511 | 132 | 2.926180% |
| B | 4497 | 139 | 3.090950% |
| C | 4573 | 109 | 2.383556% |
| D | 4483 | 120 | 2.676779% |
Noise dominated data is calculated using 1-second bins in cleaned event files. If a bin has >2000 counts, and if more than 50% of those come from <1% of pixels, then it is considered to be noise-dominated and hence unusable.
| Quadrant | # 1 sec bins | Bins with >0 counts | Bins with >2000 counts | High rate bins dominated by noise | Noise dominated (total time) | Noise dominated (detector-on time) | Marked lightcurve |
|---|---|---|---|---|---|---|---|
| A | 7115 | 5148 | 0 | 0 | 0.00% | 0.00% | 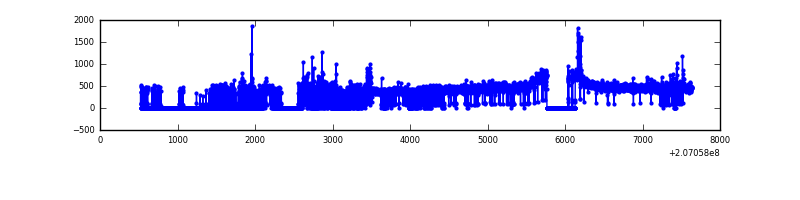 |
| B | 7113 | 5167 | 1 | 1 | 0.01% | 0.02% | 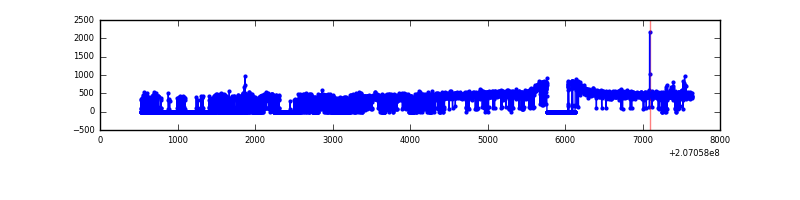 |
| C | 7116 | 5220 | 16 | 16 | 0.22% | 0.31% | 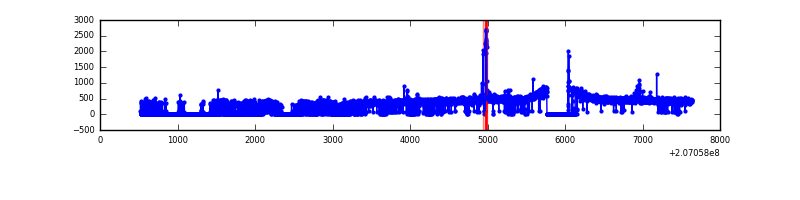 |
| D | 7111 | 5148 | 8 | 8 | 0.11% | 0.16% | 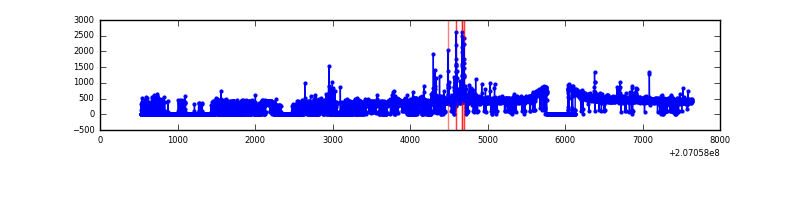 |
Top three noisy pixels from each quadrant. If the there are fewer than three noisy pixels in the level2.evt file, extra rows are filled as -1
| Pixel properties | Quadrant properties | ||||||
|---|---|---|---|---|---|---|---|
| Quadrant | DetID | PixID | Counts | Sigma | Mean | Median | Sigma |
| A | 15 | 47 | 42288 | 376.46 | 530 | 516 | 111.0 |
| A | 8 | 15 | 32727 | 290.29 | 530 | 516 | 111.0 |
| A | 0 | 118 | 20041 | 175.96 | 530 | 516 | 111.0 |
| B | 15 | 204 | 16456 | 152.95 | 532 | 518 | 104.2 |
| B | 15 | 54 | 15465 | 143.44 | 532 | 518 | 104.2 |
| B | 12 | 111 | 9335 | 84.61 | 532 | 518 | 104.2 |
| C | 14 | 48 | 50458 | 409.26 | 522 | 524 | 122.0 |
| C | 9 | 247 | 14738 | 116.5 | 522 | 524 | 122.0 |
| C | 9 | 16 | 13980 | 110.29 | 522 | 524 | 122.0 |
| D | 4 | 95 | 51473 | 413.11 | 513 | 498 | 123.4 |
| D | 2 | 14 | 37623 | 300.86 | 513 | 498 | 123.4 |
| D | 13 | 239 | 27161 | 216.08 | 513 | 498 | 123.4 |
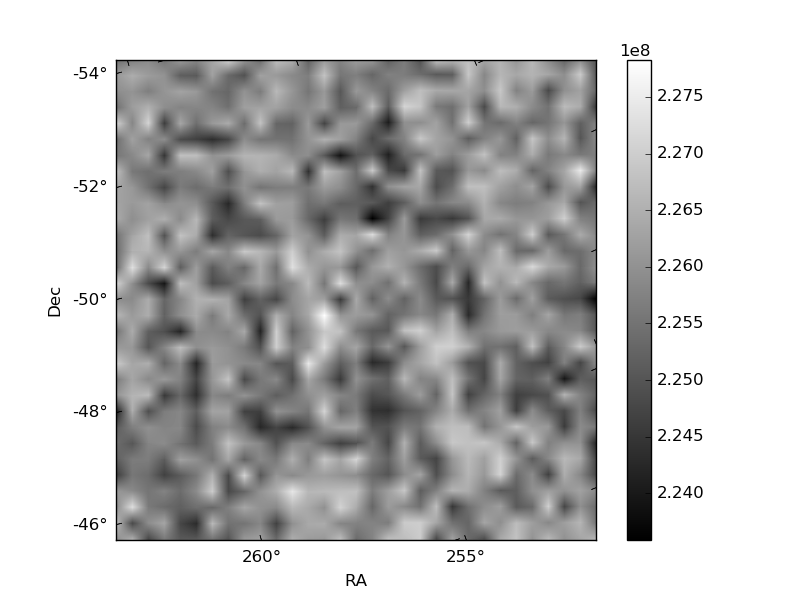
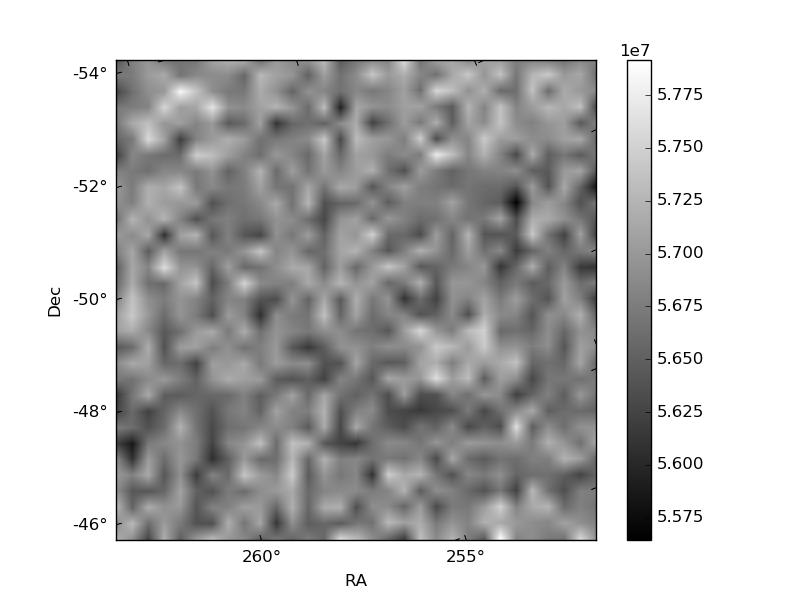
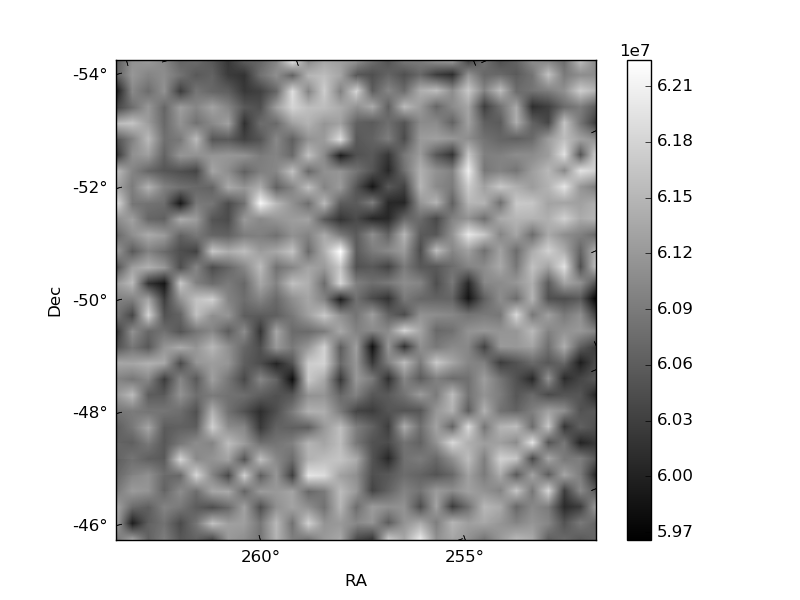
Histogram calculated using DETX and DETY for each event in the final _common_clean file
| Quadrant A | 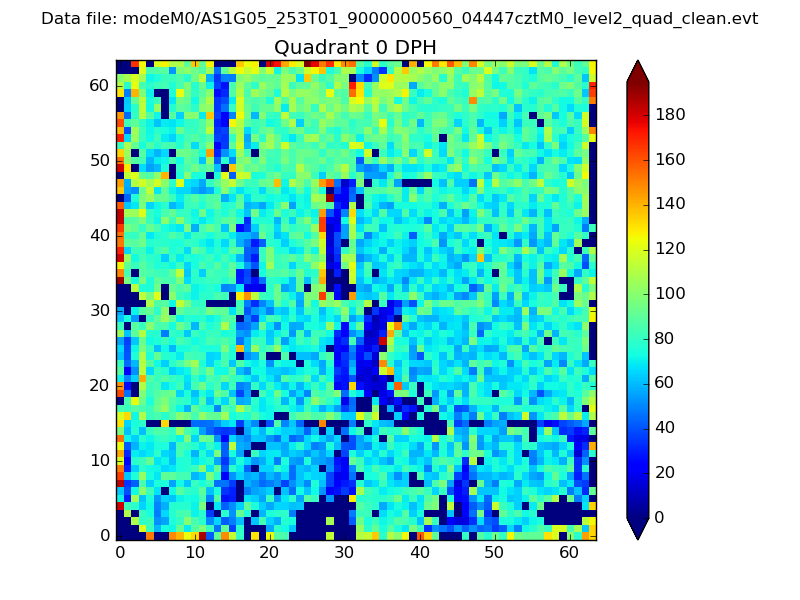 |
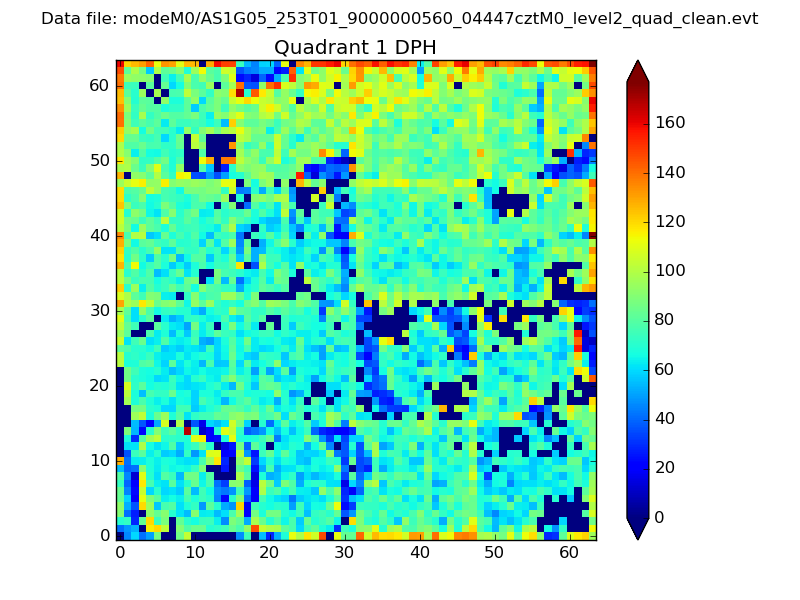 |
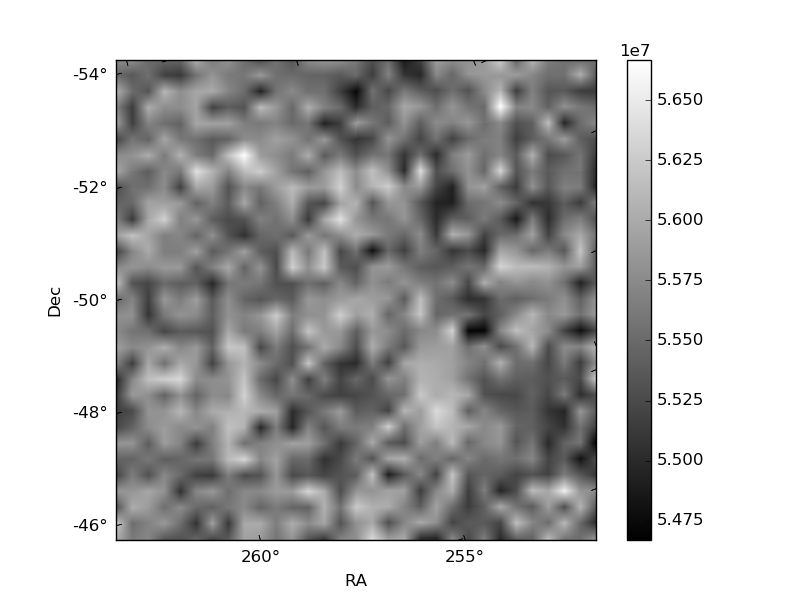
Quadrant B |
|---|---|---|---|
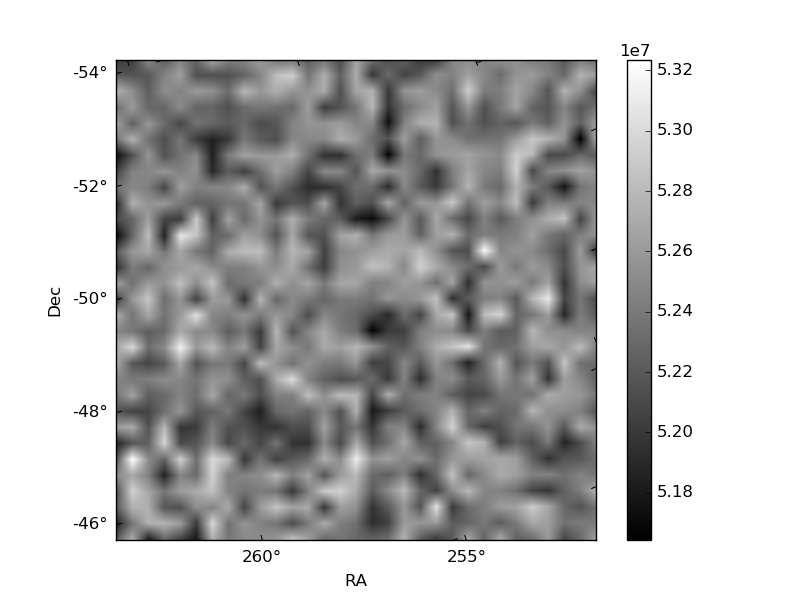
| Quadrant D | 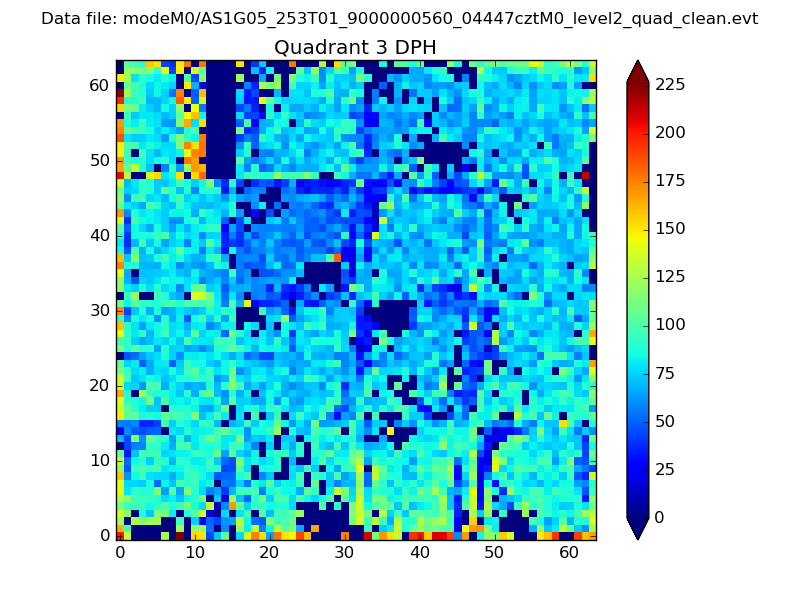 |
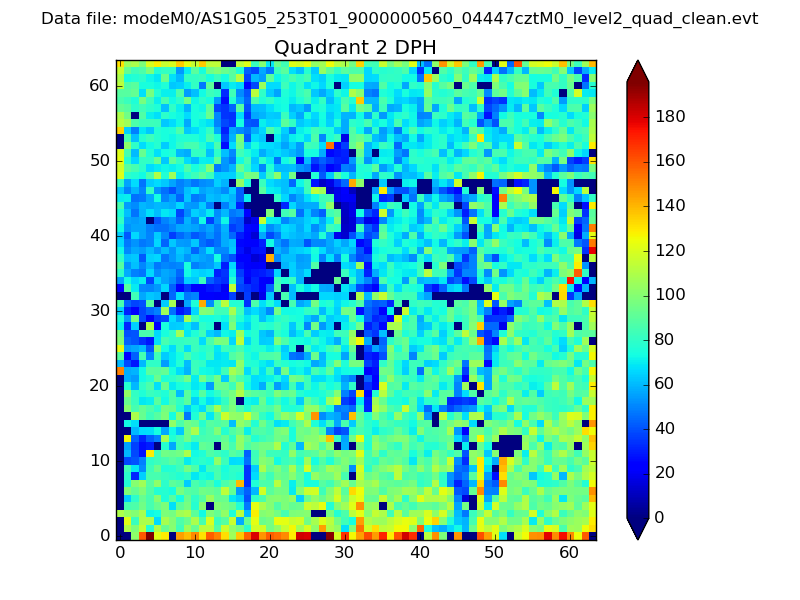 |
Quadrant C |
| Plot type | Count rate plots | Images |
|---|---|---|
| Comparison with Poisson distribution Blue bars denote a histogram of data divided into 1 sec bins. Red curve is a Poisson curve with rate = median count rate of data. |
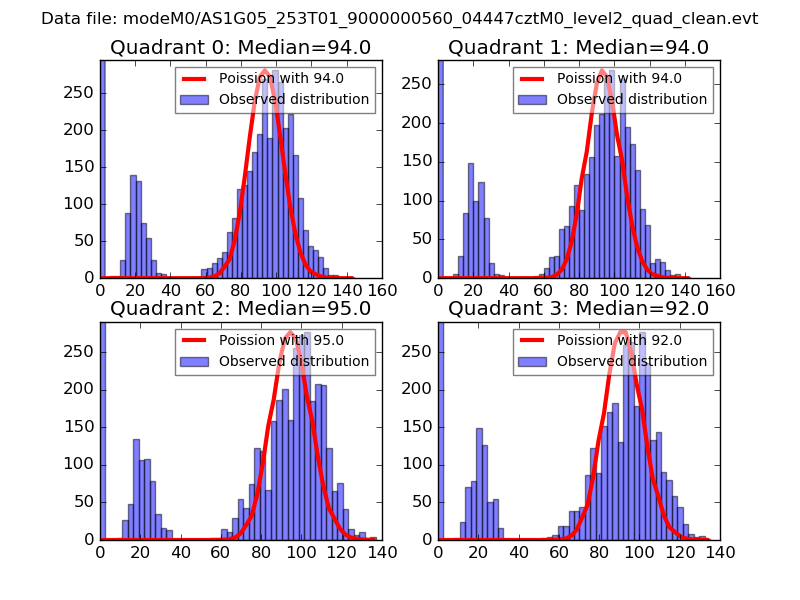 |
 |
| Quadrant-wise count rates Data is divided into 100 sec bins |
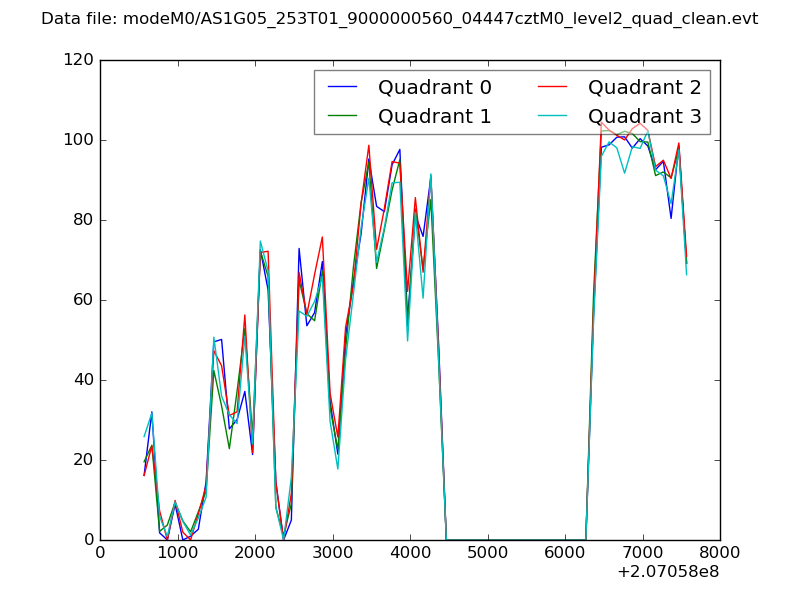 |
|
| Module-wise count rates for Quadrant A Data is divided into 100 sec bins |
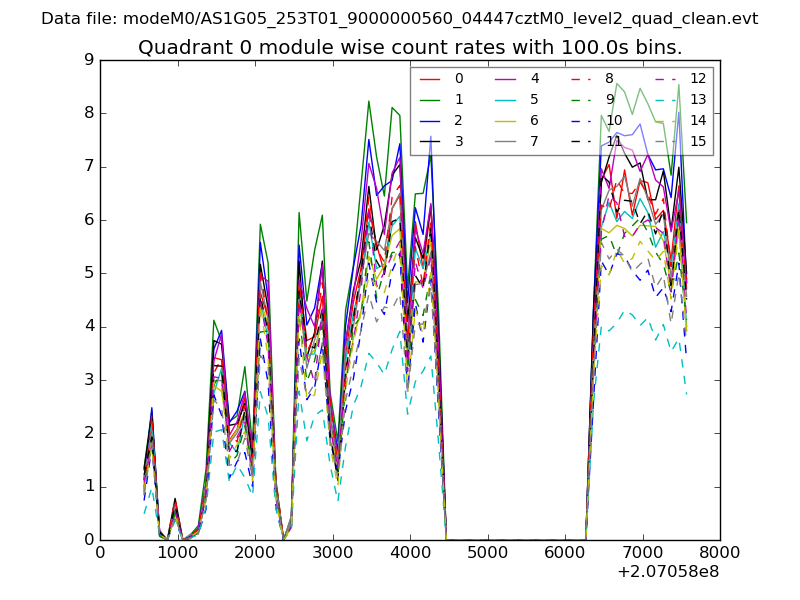 |
 |
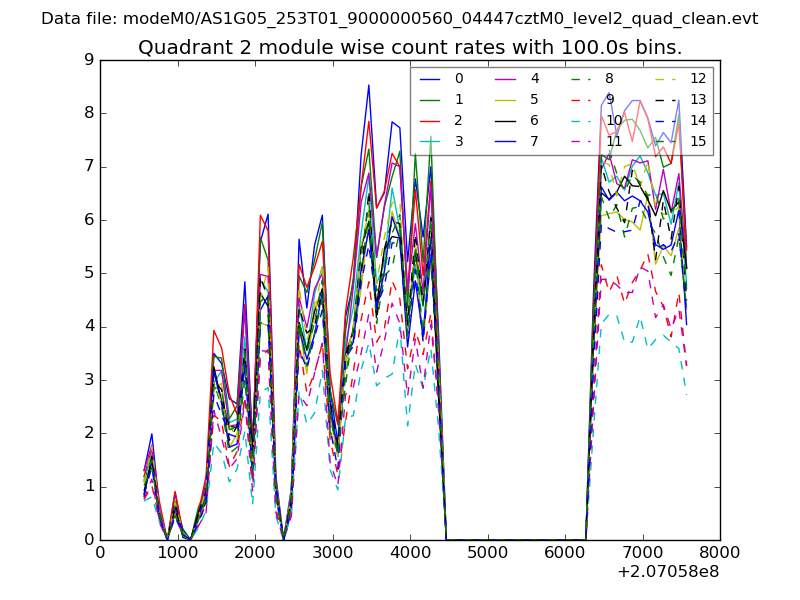
| Module-wise count rates for Quadrant B Data is divided into 100 sec bins |
 |
 |
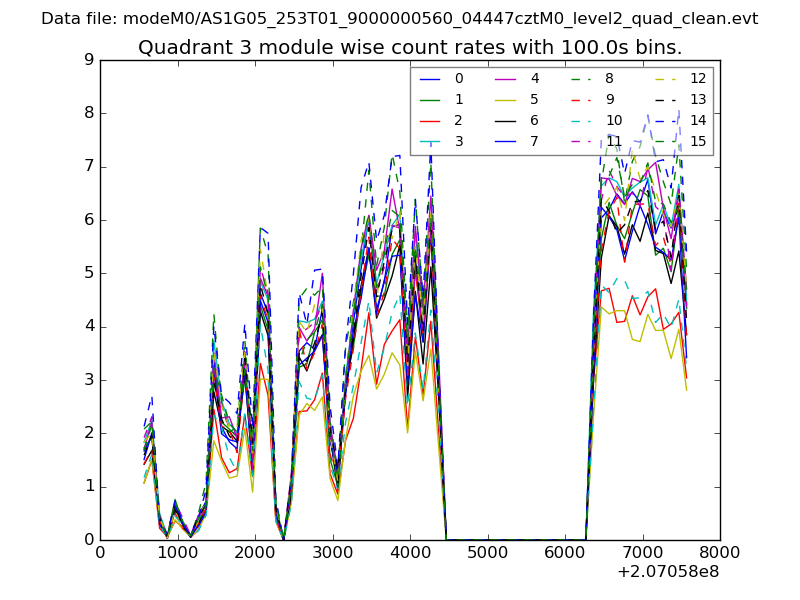
| Module-wise count rates for Quadrant C Data is divided into 100 sec bins |
 |
 |
| Module-wise count rates for Quadrant D Data is divided into 100 sec bins |
 |
 |
| Parameter | Plot |
|---|---|
| CZT HV Monitor | 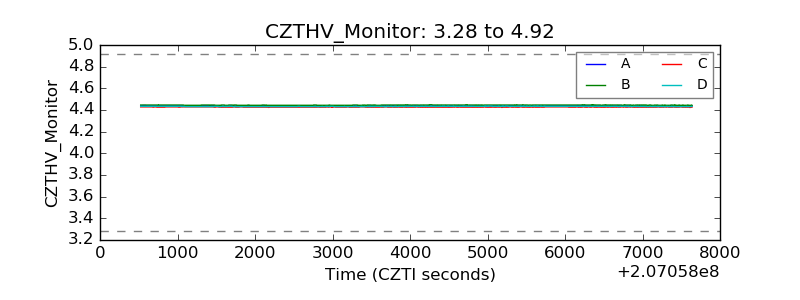 |
| D_VDD |  |
| Temperature 1 | 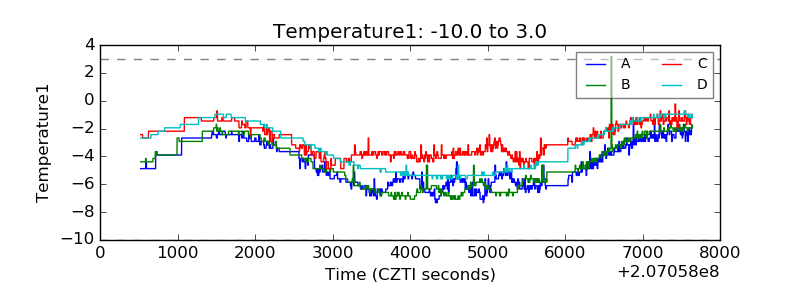 |
| Veto HV Monitor | 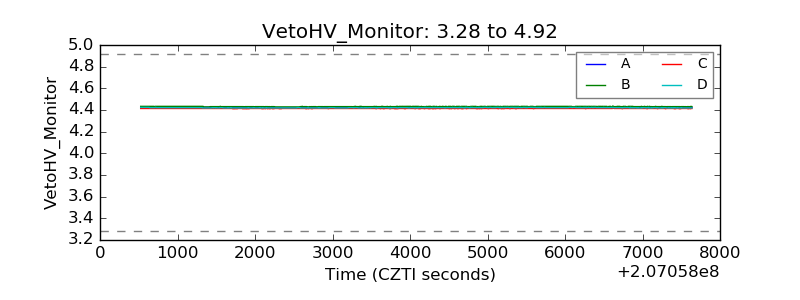 |
| Veto LLD | 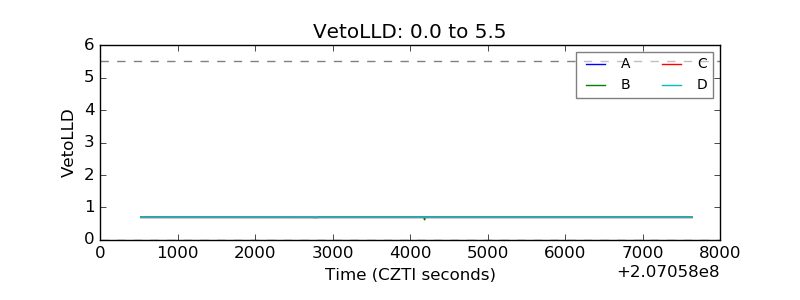 |
| Alpha Counter | 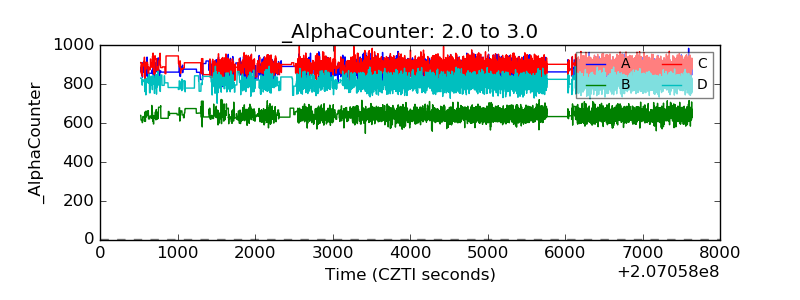 |
| _CPM_Rate | 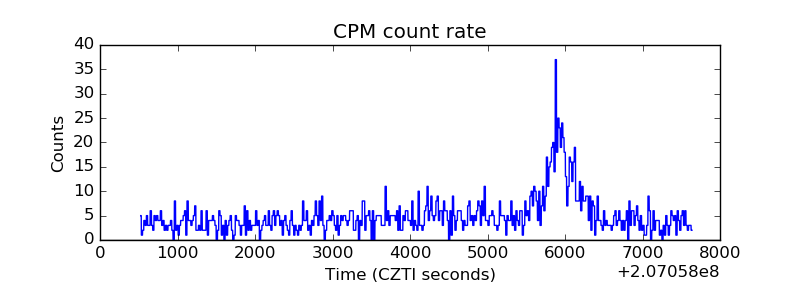 |
| CZT Counter | 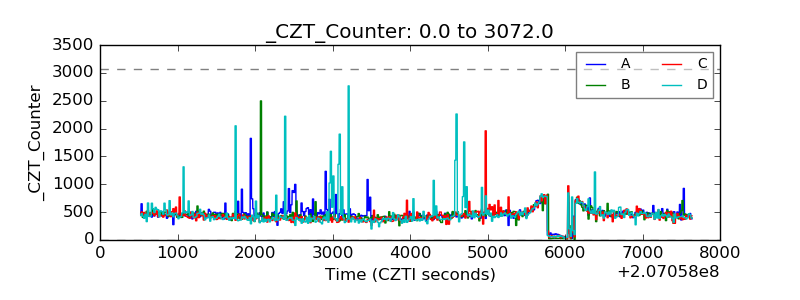 |
| +2.5 Volts monitor | 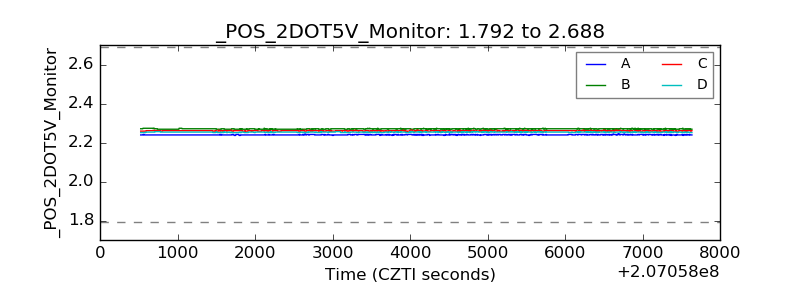 |
| +5 Volts monitor | 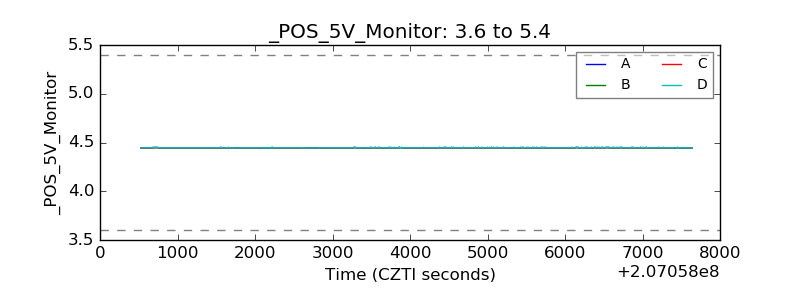 |
| _ROLL_ROT | 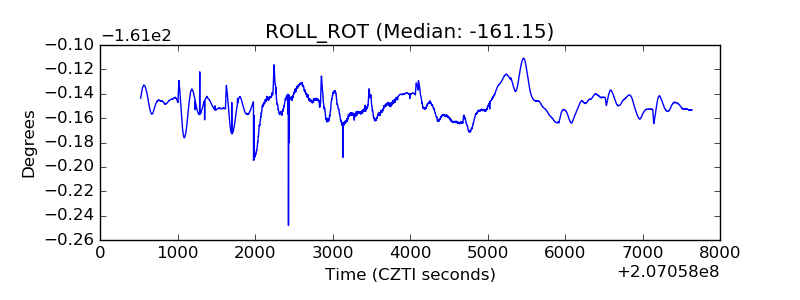 |
| _Roll_DEC | 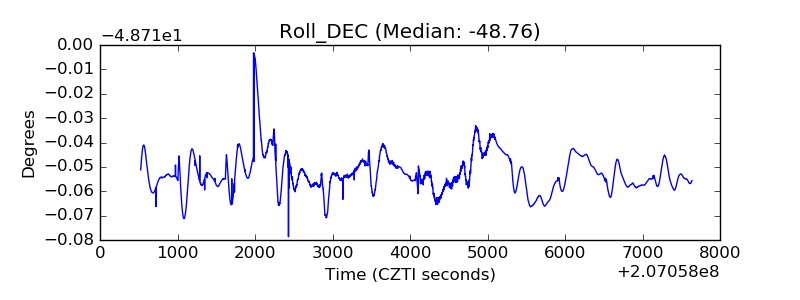 |
| _Roll_RA | 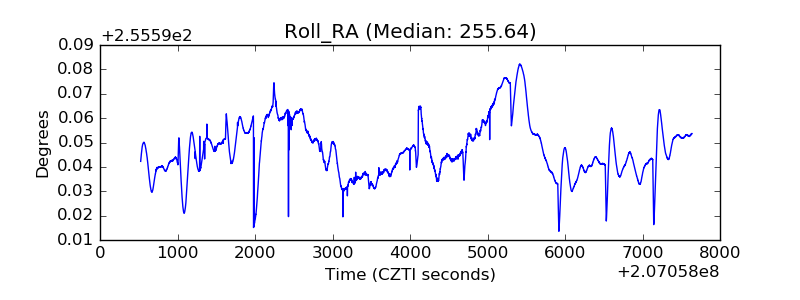 |
| Veto Counter | 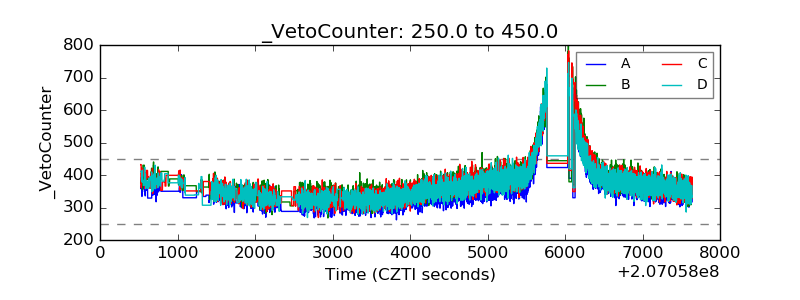 |