| Param | Original file | Final file |
|---|---|---|
| Filename | modeM0/AS1G05_253T01_9000000560_04448cztM0_level2.evt | modeM0/AS1G05_253T01_9000000560_04448cztM0_level2_quad_clean.evt |
| Size (bytes) | 804,617,280 | 148,570,560 |
| Size | 767.3 MB | 141.7 MB |
| Events in quadrant A | 5,856,866 | 912,616 |
| Events in quadrant B | 5,907,122 | 912,797 |
| Events in quadrant C | 5,619,420 | 919,812 |
| Events in quadrant D | 6,130,790 | 884,769 |
| Mode SS | |||
|---|---|---|---|
| Quadrant | BADHDUFLAG | Total packets | Discarded packets |
| A | 0 | 264 | 10 |
| B | 0 | 264 | 14 |
| C | 0 | 264 | 8 |
| D | 0 | 264 | 6 |
| Mode M9 | |||
|---|---|---|---|
| Quadrant | BADHDUFLAG | Total packets | Discarded packets |
| A | 0 | 5 | 0 |
| B | 0 | 5 | 1 |
| C | 0 | 5 | 0 |
| D | 0 | 5 | 0 |
| Mode M0 | |||
|---|---|---|---|
| Quadrant | BADHDUFLAG | Total packets | Discarded packets |
| A | 0 | 27215 | 909 |
| B | 0 | 27243 | 850 |
| C | 0 | 26934 | 809 |
| D | 0 | 28695 | 919 |
| Quadrant | Total seconds | Saturated seconds | Saturation percentage |
|---|---|---|---|
| A | 12555 | 230 | 1.831939% |
| B | 12580 | 232 | 1.844197% |
| C | 12603 | 138 | 1.094977% |
| D | 12563 | 309 | 2.459604% |
Noise dominated data is calculated using 1-second bins in cleaned event files. If a bin has >2000 counts, and if more than 50% of those come from <1% of pixels, then it is considered to be noise-dominated and hence unusable.
| Quadrant | # 1 sec bins | Bins with >0 counts | Bins with >2000 counts | High rate bins dominated by noise | Noise dominated (total time) | Noise dominated (detector-on time) | Marked lightcurve |
|---|---|---|---|---|---|---|---|
| A | 13535 | 12938 | 8 | 8 | 0.06% | 0.06% | 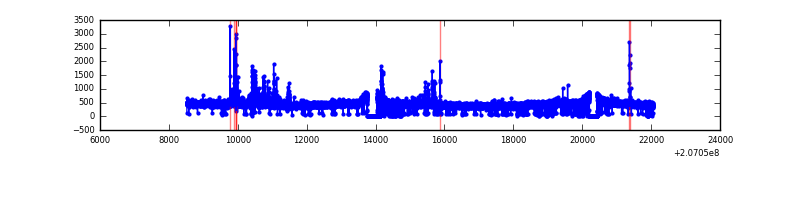 |
| B | 13535 | 12940 | 9 | 9 | 0.07% | 0.07% | 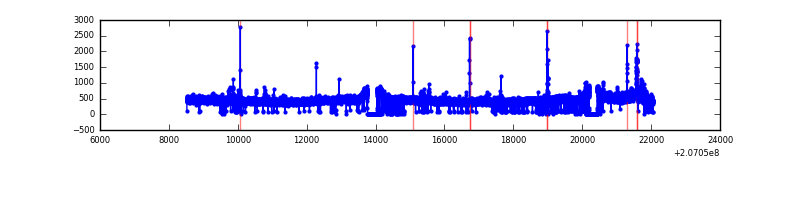 |
| C | 13535 | 12944 | 18 | 18 | 0.13% | 0.14% | 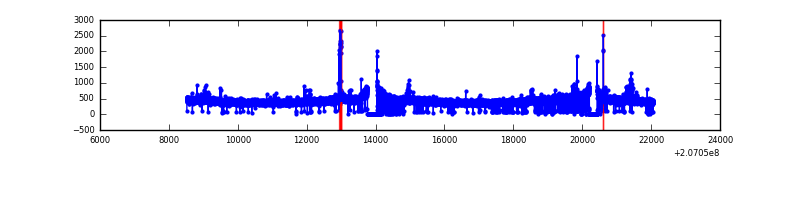 |
| D | 13535 | 12946 | 161 | 161 | 1.19% | 1.24% | 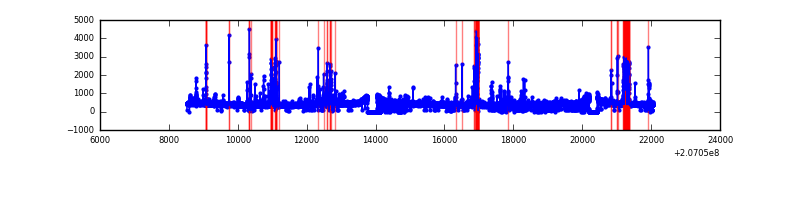 |
Top three noisy pixels from each quadrant. If the there are fewer than three noisy pixels in the level2.evt file, extra rows are filled as -1
| Pixel properties | Quadrant properties | ||||||
|---|---|---|---|---|---|---|---|
| Quadrant | DetID | PixID | Counts | Sigma | Mean | Median | Sigma |
| A | 15 | 47 | 129129 | 436.27 | 1432 | 1401 | 292.8 |
| A | 0 | 118 | 114005 | 384.61 | 1432 | 1401 | 292.8 |
| A | 8 | 15 | 43987 | 145.46 | 1432 | 1401 | 292.8 |
| B | 15 | 204 | 163997 | 589.01 | 1446 | 1412 | 276.0 |
| B | 15 | 54 | 65042 | 230.52 | 1446 | 1412 | 276.0 |
| B | 12 | 111 | 24192 | 82.53 | 1446 | 1412 | 276.0 |
| C | 14 | 48 | 87948 | 267.64 | 1394 | 1400 | 323.4 |
| C | 9 | 16 | 54340 | 163.71 | 1394 | 1400 | 323.4 |
| C | 9 | 247 | 28007 | 82.28 | 1394 | 1400 | 323.4 |
| D | 8 | 230 | 233333 | 702.02 | 1383 | 1343 | 330.5 |
| D | 13 | 239 | 200283 | 602.01 | 1383 | 1343 | 330.5 |
| D | 12 | 227 | 97112 | 289.81 | 1383 | 1343 | 330.5 |
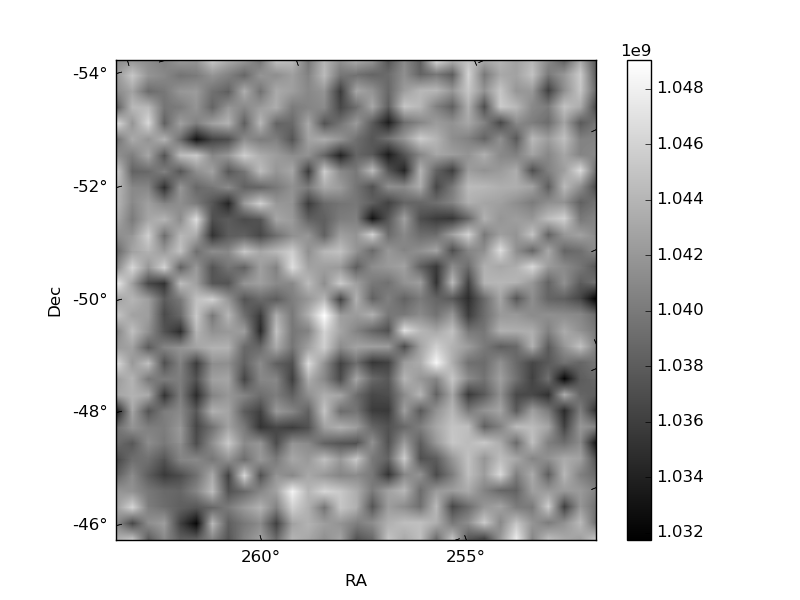
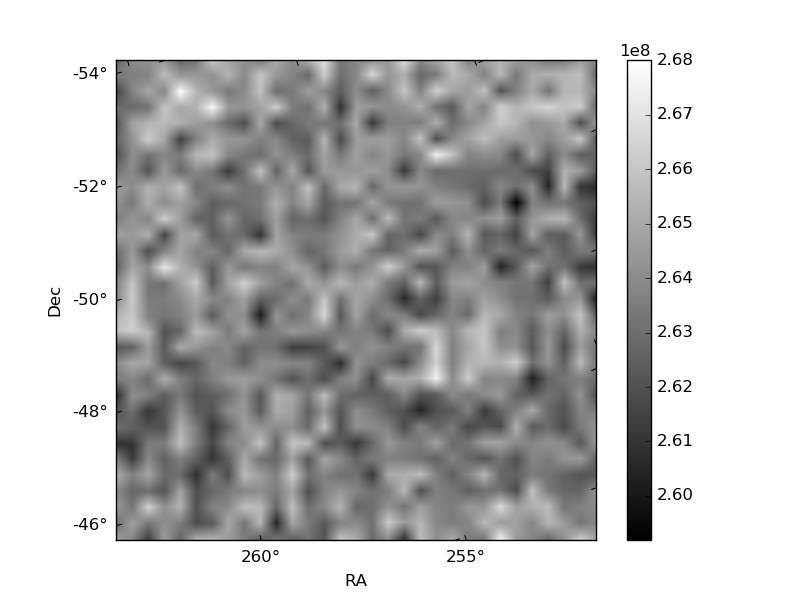
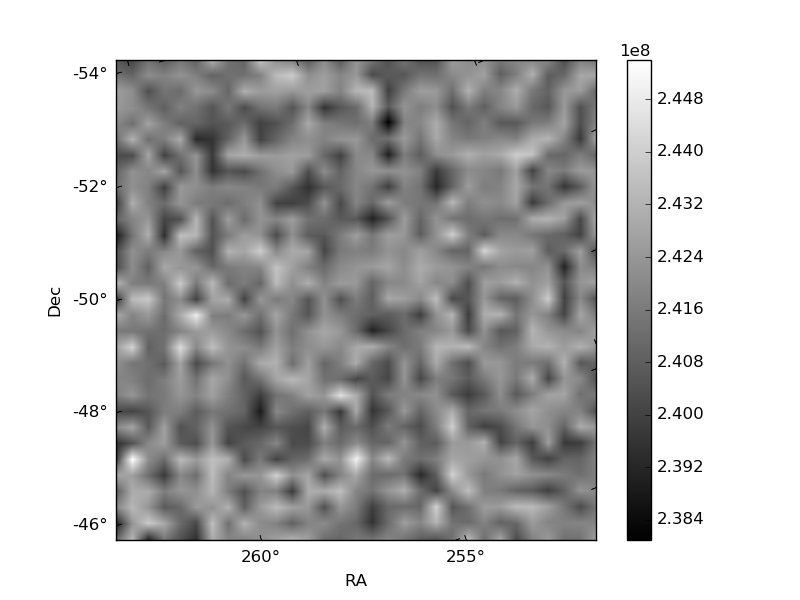
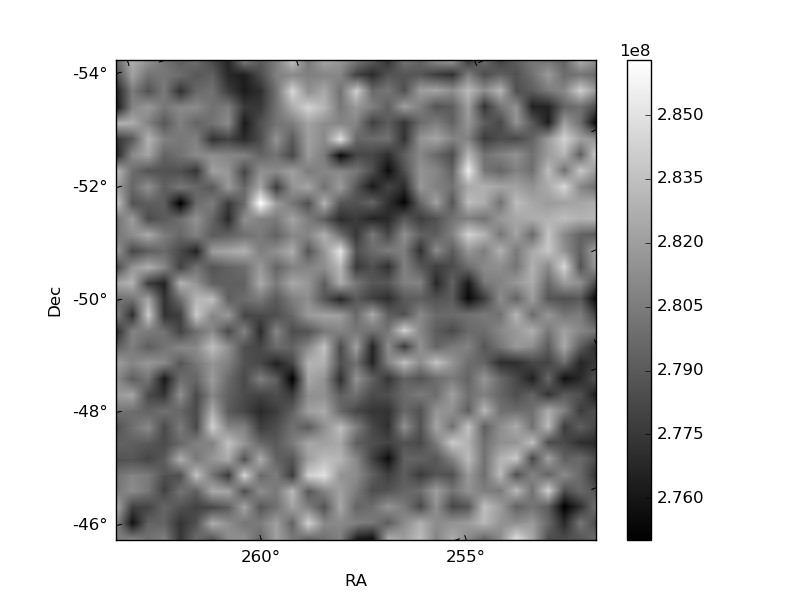
Histogram calculated using DETX and DETY for each event in the final _common_clean file
| Quadrant A | 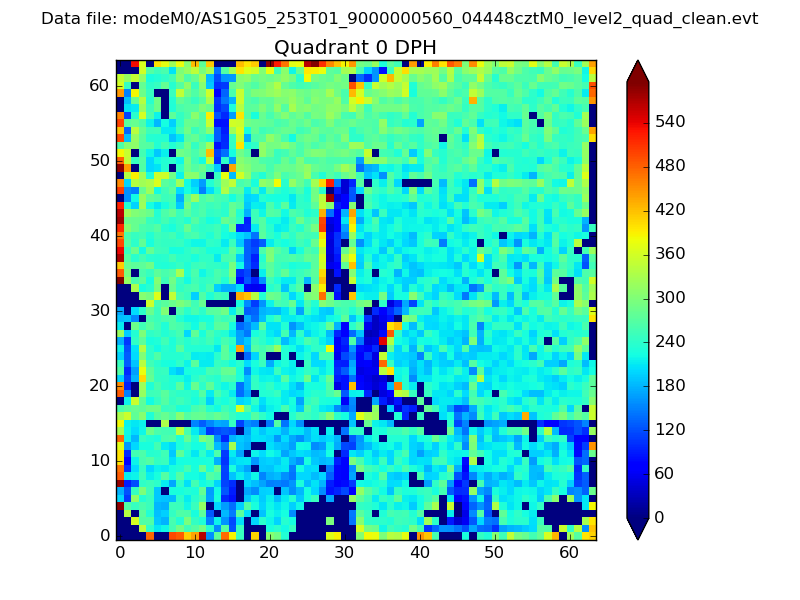 |
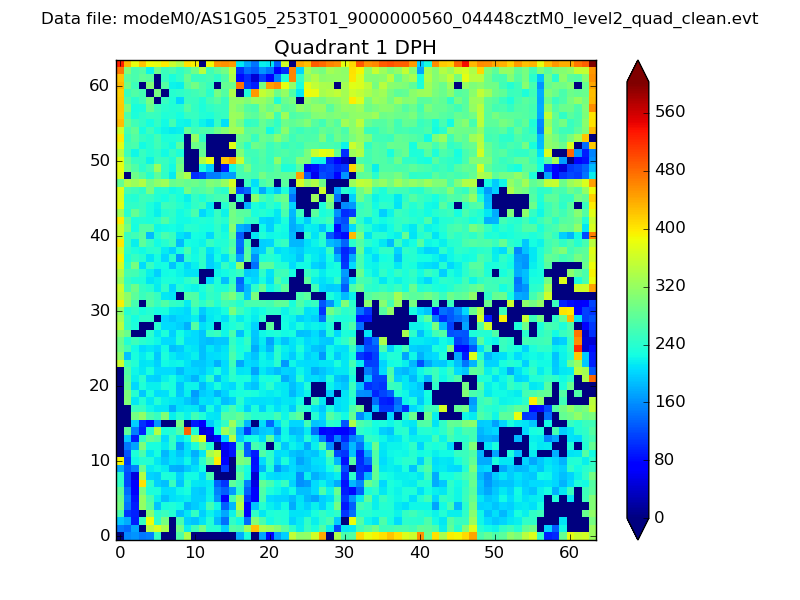 |
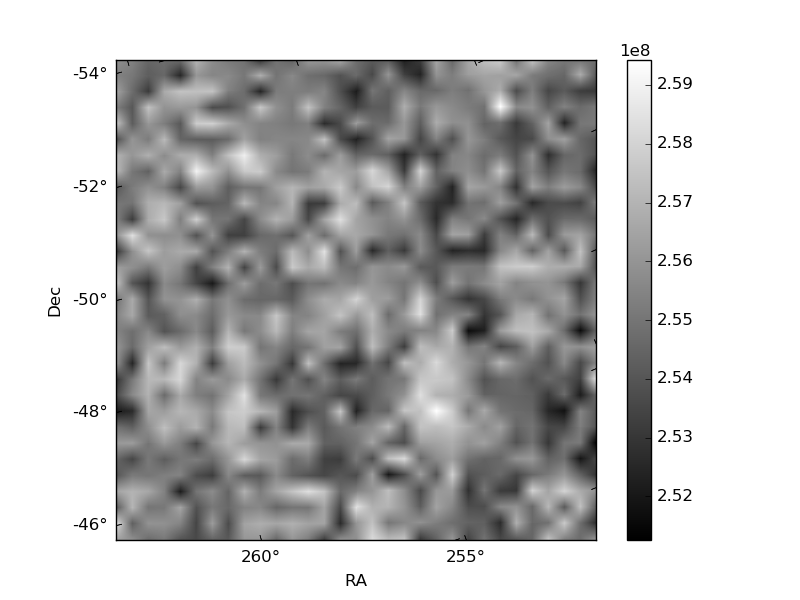
Quadrant B |
|---|---|---|---|
| Quadrant D | 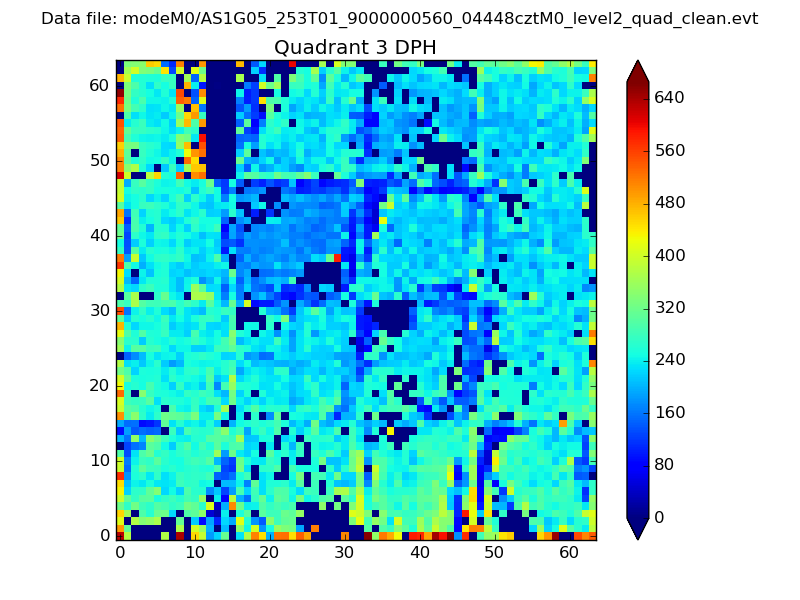 |
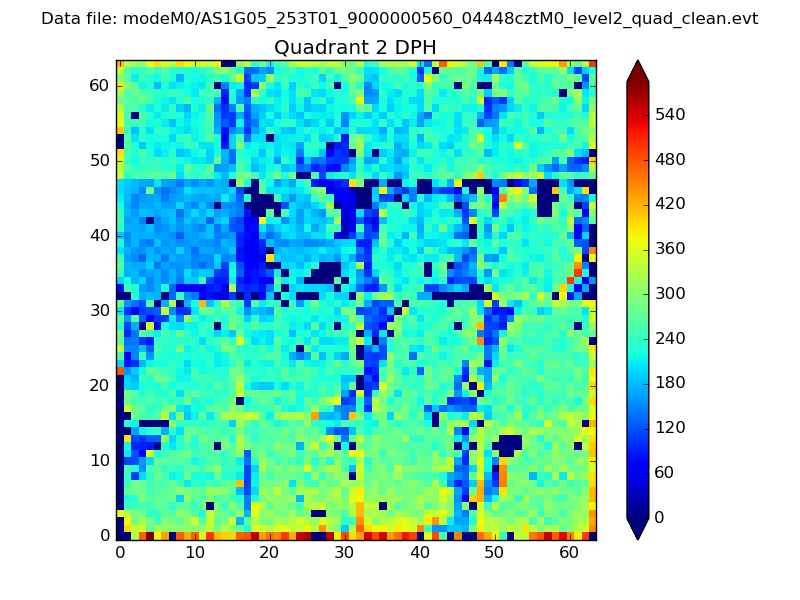 |
Quadrant C |
| Plot type | Count rate plots | Images |
|---|---|---|
| Comparison with Poisson distribution Blue bars denote a histogram of data divided into 1 sec bins. Red curve is a Poisson curve with rate = median count rate of data. |
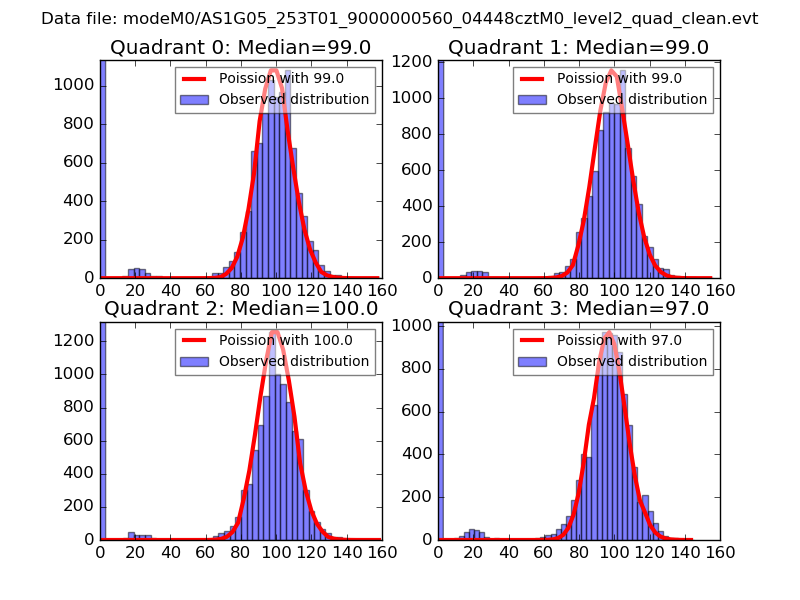 |
 |
| Quadrant-wise count rates Data is divided into 100 sec bins |
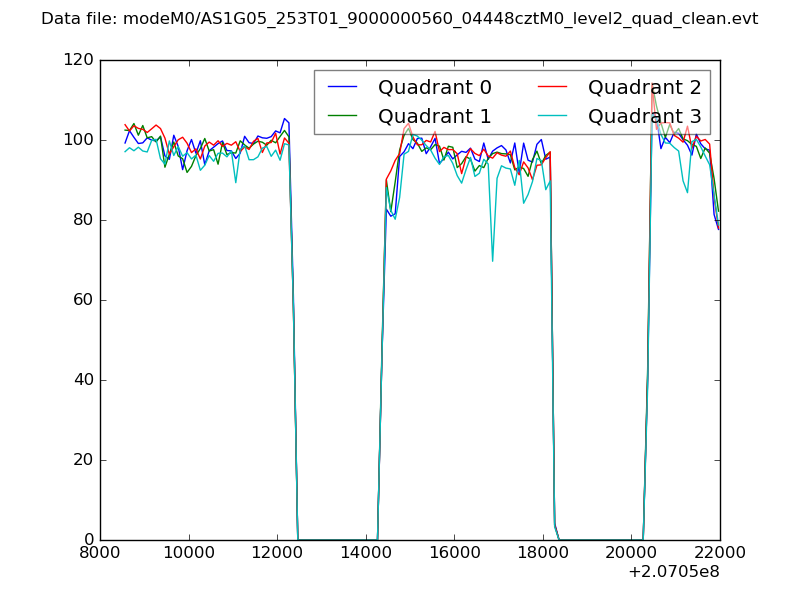 |
|
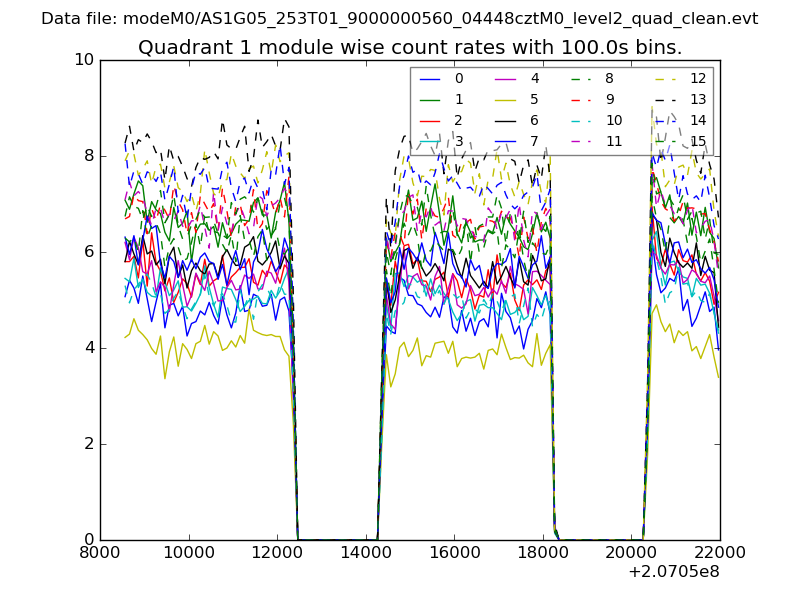
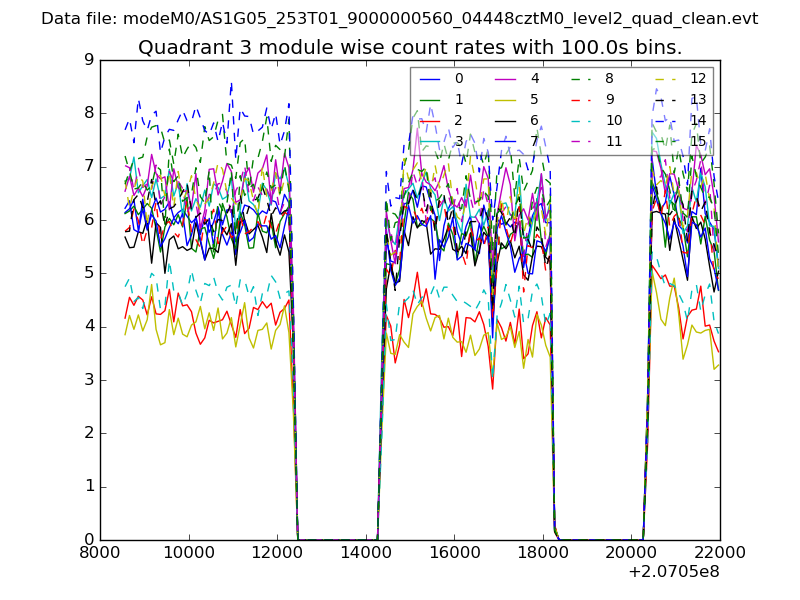
| Module-wise count rates for Quadrant A Data is divided into 100 sec bins |
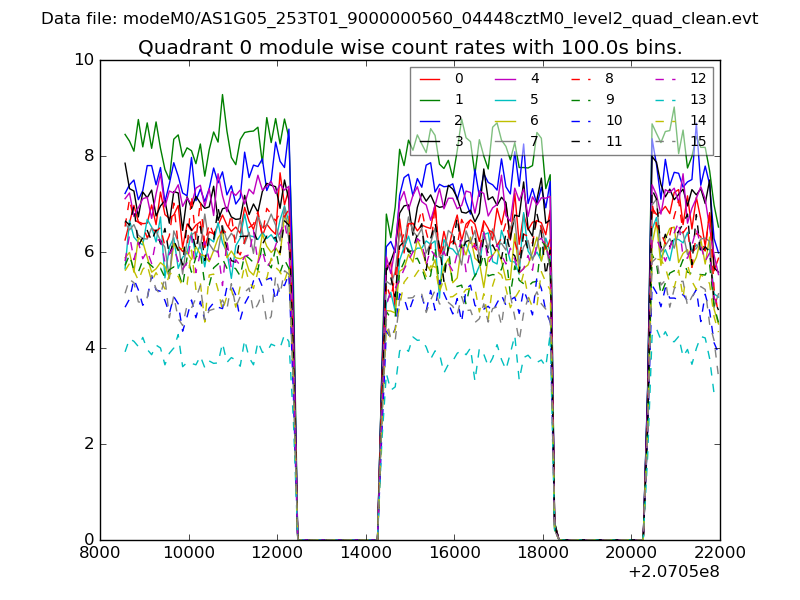 |
 |
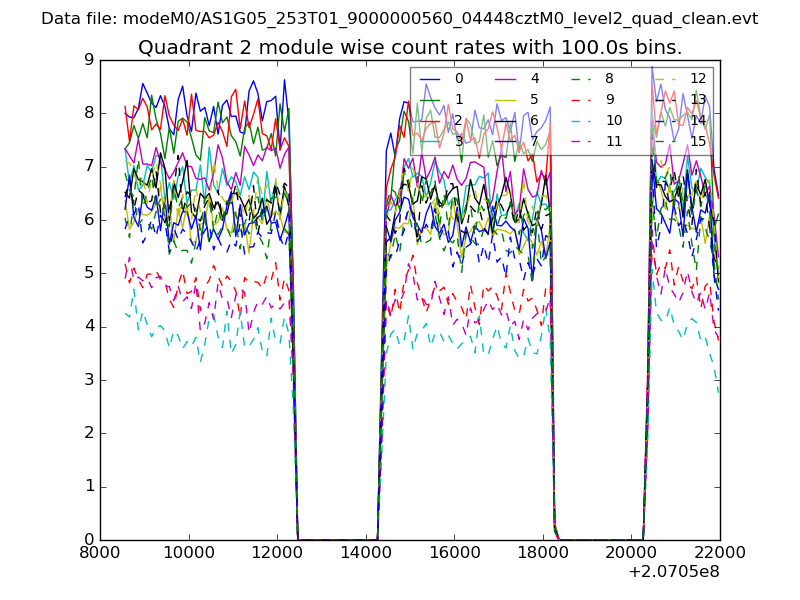
| Module-wise count rates for Quadrant B Data is divided into 100 sec bins |
 |
 |
| Module-wise count rates for Quadrant C Data is divided into 100 sec bins |
 |
 |
| Module-wise count rates for Quadrant D Data is divided into 100 sec bins |
 |
 |
| Parameter | Plot |
|---|---|
| CZT HV Monitor | 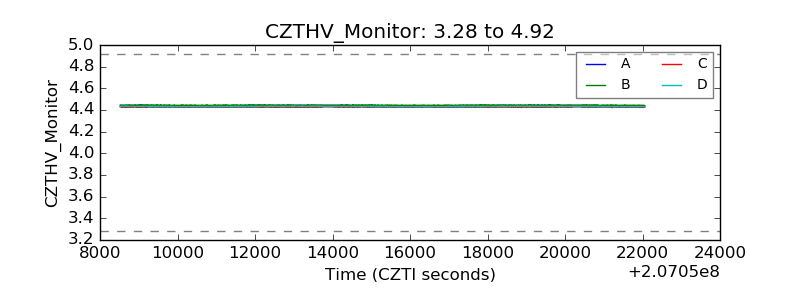 |
| D_VDD | 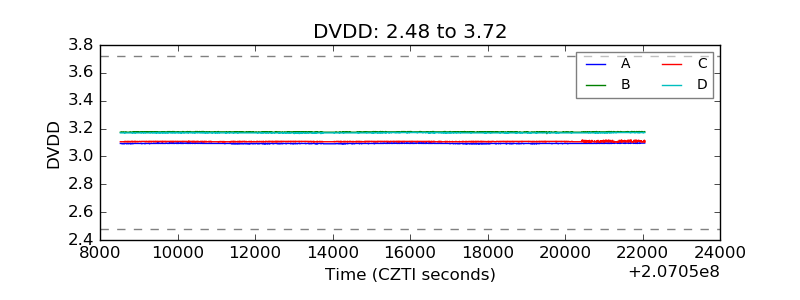 |
| Temperature 1 | 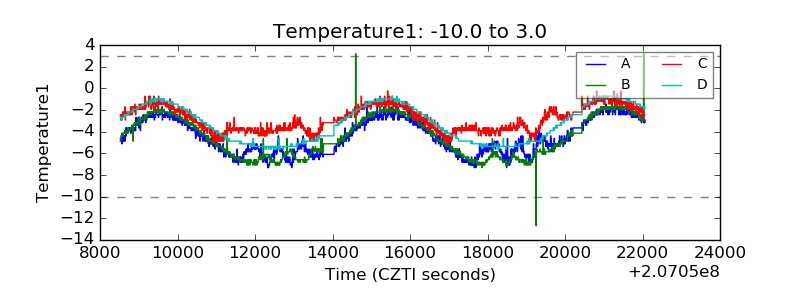 |
| Veto HV Monitor | 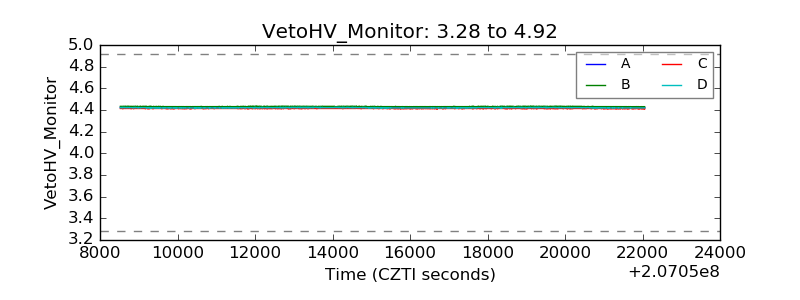 |
| Veto LLD | 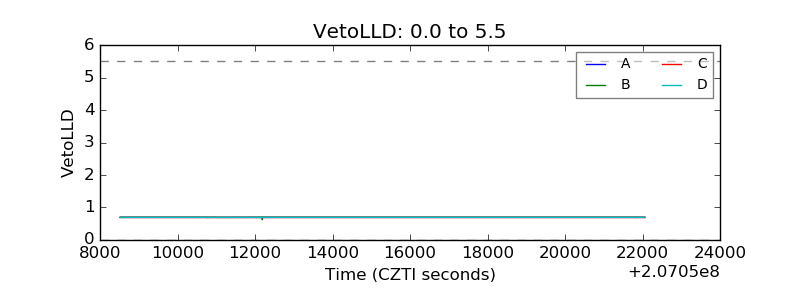 |
| Alpha Counter | 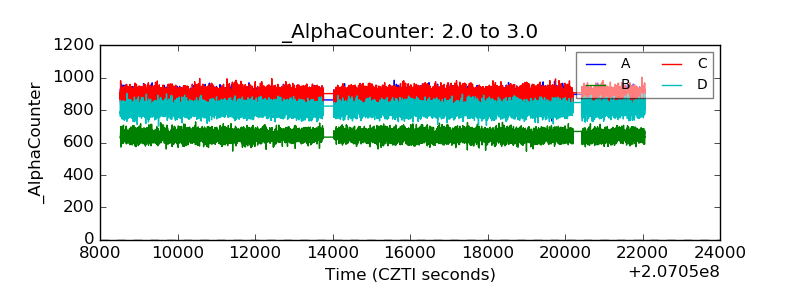 |
| _CPM_Rate |  |
| CZT Counter | 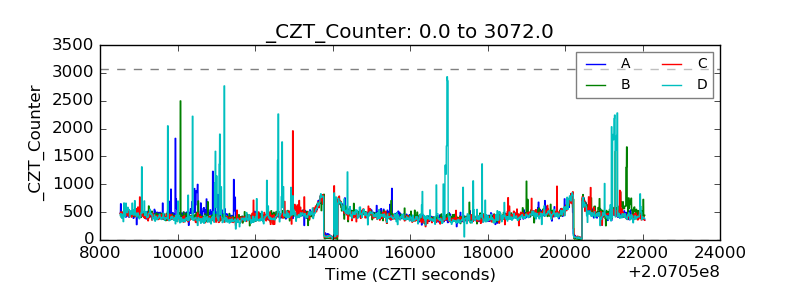 |
| +2.5 Volts monitor |  |
| +5 Volts monitor |  |
| _ROLL_ROT | 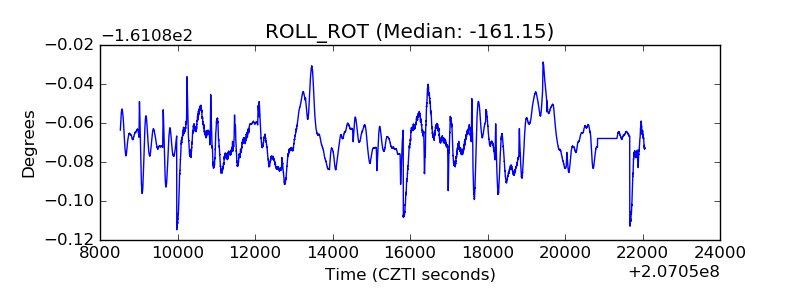 |
| _Roll_DEC | 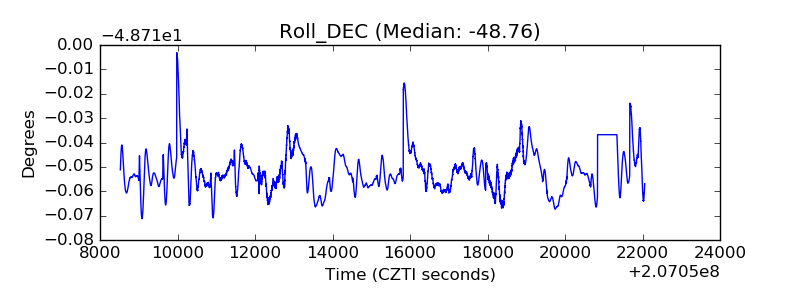 |
| _Roll_RA | 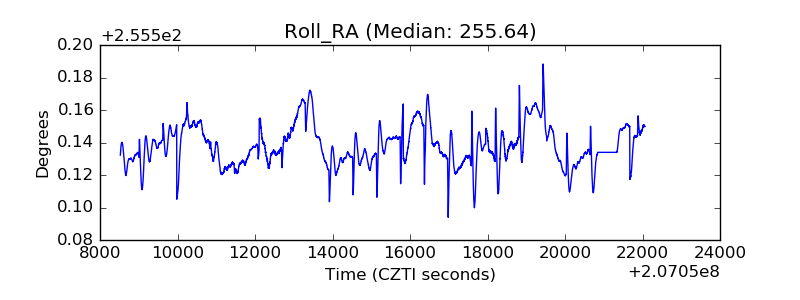 |
| Veto Counter | 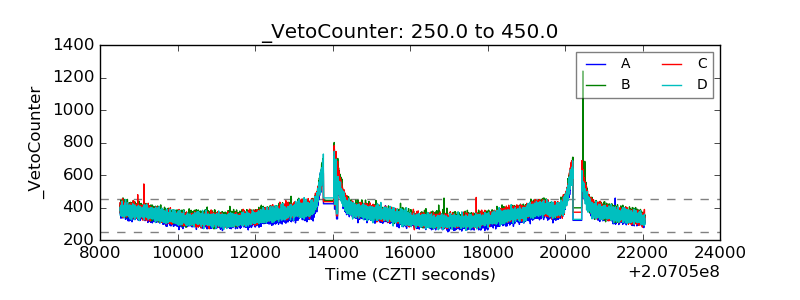 |