| Param | Original file | Final file |
|---|---|---|
| Filename | modeM0/AS1G05_253T01_9000000560_04449cztM0_level2.evt | modeM0/AS1G05_253T01_9000000560_04449cztM0_level2_quad_clean.evt |
| Size (bytes) | 223,698,240 | 38,943,360 |
| Size | 213.3 MB | 37.1 MB |
| Events in quadrant A | 1,575,326 | 237,814 |
| Events in quadrant B | 1,676,066 | 227,496 |
| Events in quadrant C | 1,578,664 | 229,375 |
| Events in quadrant D | 1,695,349 | 226,758 |
| Mode SS | |||
|---|---|---|---|
| Quadrant | BADHDUFLAG | Total packets | Discarded packets |
| A | 0 | 98 | 22 |
| B | 0 | 99 | 27 |
| C | 0 | 99 | 25 |
| D | 0 | 99 | 27 |
| Mode M9 | |||
|---|---|---|---|
| Quadrant | BADHDUFLAG | Total packets | Discarded packets |
| A | 1 | 224764499168 | 0 |
| B | 1 | -1 | -1 |
| C | 1 | -1 | -1 |
| D | 1 | -1 | -1 |
| Mode M0 | |||
|---|---|---|---|
| Quadrant | BADHDUFLAG | Total packets | Discarded packets |
| A | 0 | 9988 | 2546 |
| B | 0 | 10502 | 3001 |
| C | 0 | 10130 | 2735 |
| D | 0 | 10866 | 2921 |
| Quadrant | Total seconds | Saturated seconds | Saturation percentage |
|---|---|---|---|
| A | 3659 | 10 | 0.273299% |
| B | 3577 | 12 | 0.335477% |
| C | 3615 | 5 | 0.138313% |
| D | 3637 | 68 | 1.869673% |
Noise dominated data is calculated using 1-second bins in cleaned event files. If a bin has >2000 counts, and if more than 50% of those come from <1% of pixels, then it is considered to be noise-dominated and hence unusable.
| Quadrant | # 1 sec bins | Bins with >0 counts | Bins with >2000 counts | High rate bins dominated by noise | Noise dominated (total time) | Noise dominated (detector-on time) | Marked lightcurve |
|---|---|---|---|---|---|---|---|
| A | 4997 | 4067 | 0 | 0 | 0.00% | 0.00% | 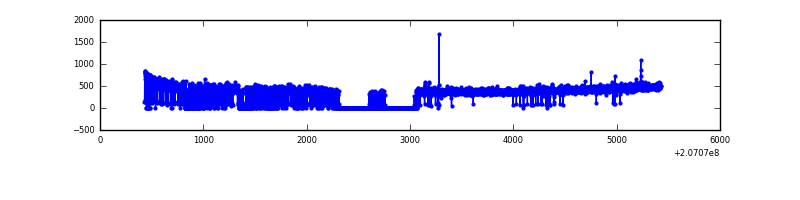 |
| B | 4997 | 3980 | 1 | 1 | 0.02% | 0.03% | 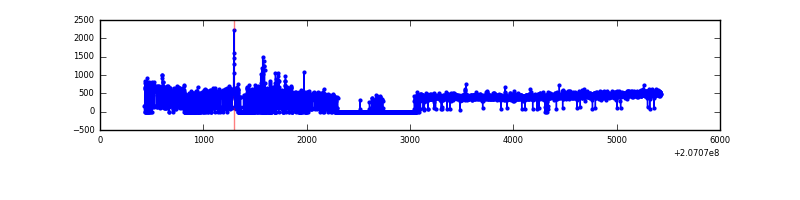 |
| C | 4997 | 4012 | 1 | 1 | 0.02% | 0.02% | 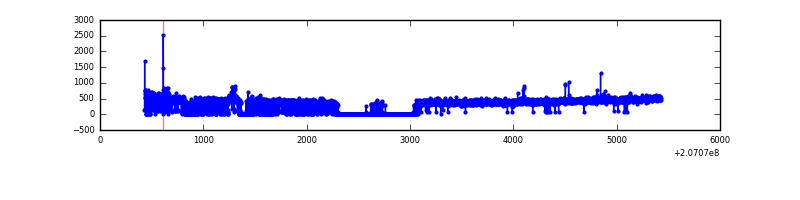 |
| D | 4997 | 4043 | 51 | 51 | 1.02% | 1.26% | 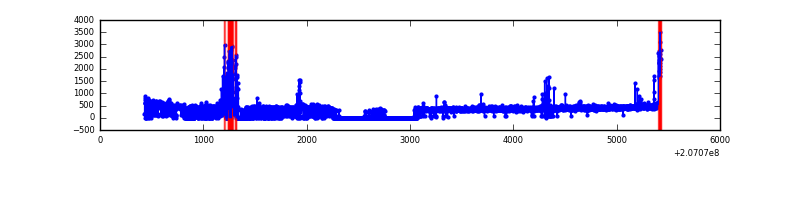 |
Top three noisy pixels from each quadrant. If the there are fewer than three noisy pixels in the level2.evt file, extra rows are filled as -1
| Pixel properties | Quadrant properties | ||||||
|---|---|---|---|---|---|---|---|
| Quadrant | DetID | PixID | Counts | Sigma | Mean | Median | Sigma |
| A | 0 | 13 | 6675 | 74.12 | 403 | 395 | 84.7 |
| A | 13 | 14 | 4880 | 52.93 | 403 | 395 | 84.7 |
| A | 0 | 226 | 4378 | 47.01 | 403 | 395 | 84.7 |
| B | 15 | 204 | 73382 | 932.12 | 401 | 390 | 78.3 |
| B | 15 | 54 | 20784 | 260.43 | 401 | 390 | 78.3 |
| B | 15 | 185 | 18592 | 232.44 | 401 | 390 | 78.3 |
| C | 14 | 48 | 20405 | 215.63 | 389 | 389 | 92.8 |
| C | 8 | 128 | 10513 | 109.06 | 389 | 389 | 92.8 |
| C | 9 | 16 | 10395 | 107.79 | 389 | 389 | 92.8 |
| D | 8 | 230 | 120390 | 1260.17 | 387 | 374 | 95.2 |
| D | 12 | 227 | 50824 | 529.73 | 387 | 374 | 95.2 |
| D | 13 | 239 | 19361 | 199.36 | 387 | 374 | 95.2 |
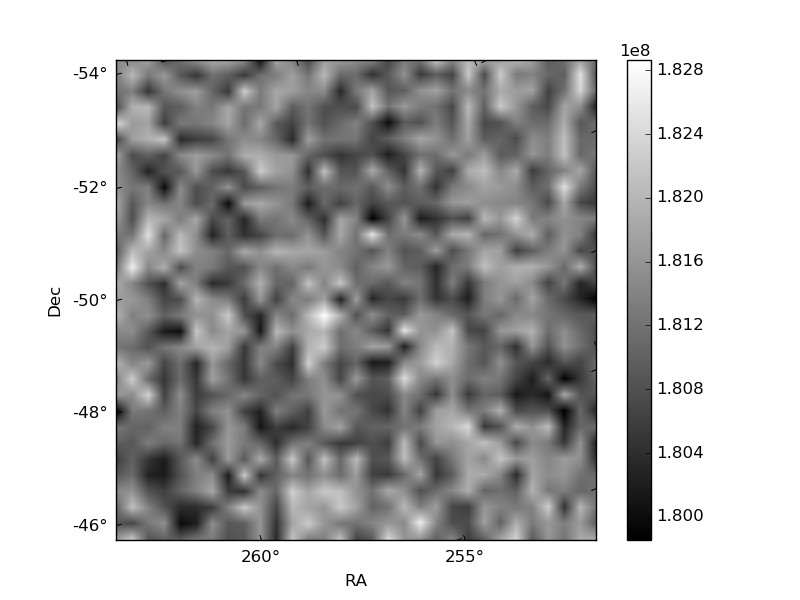
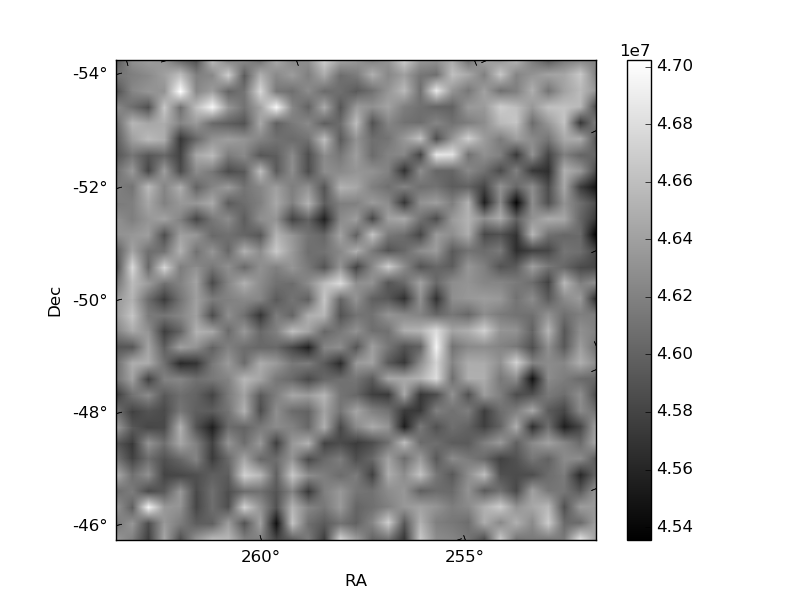
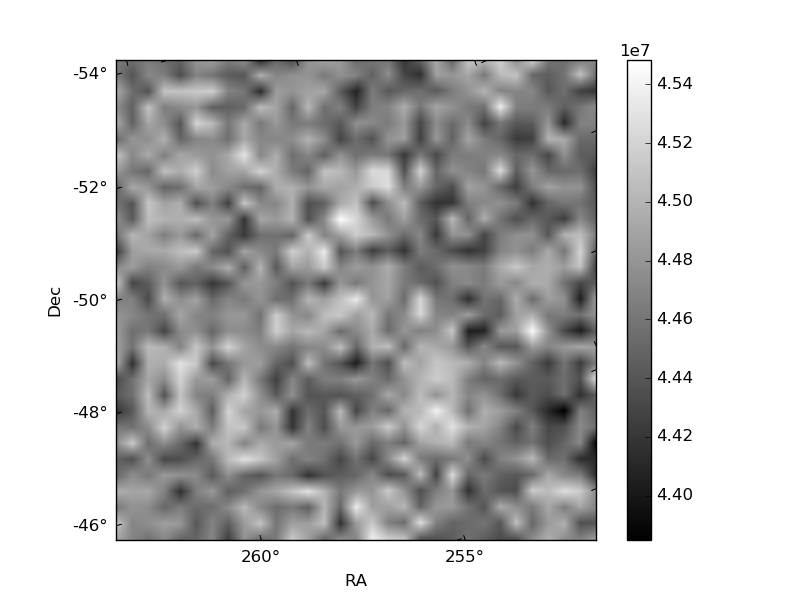
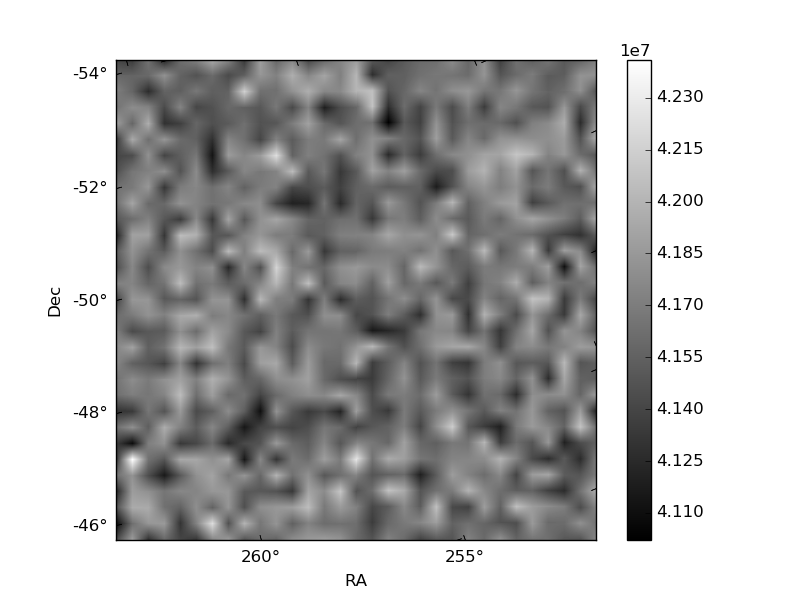
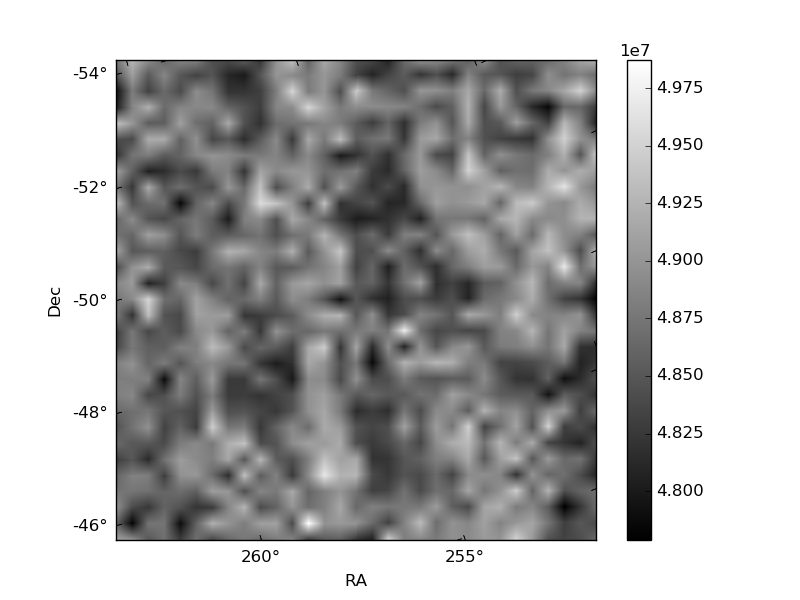
Histogram calculated using DETX and DETY for each event in the final _common_clean file
| Quadrant A | 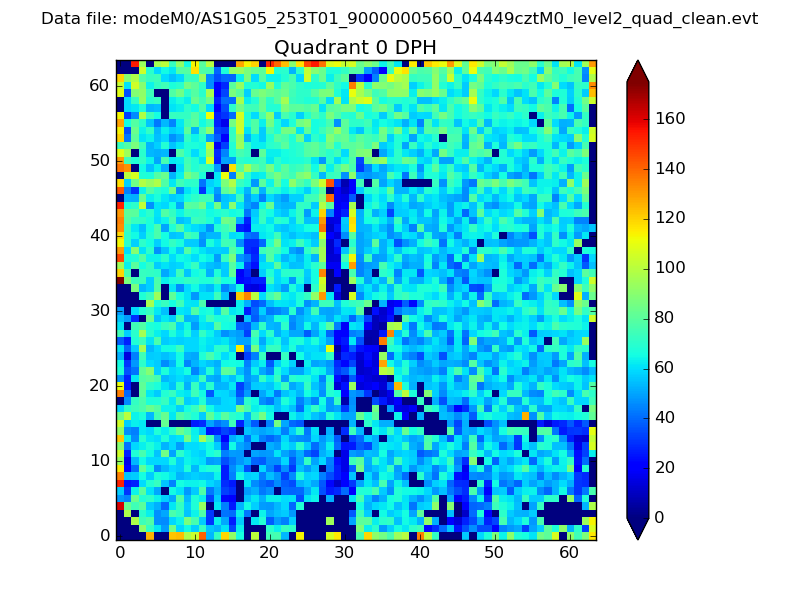 |
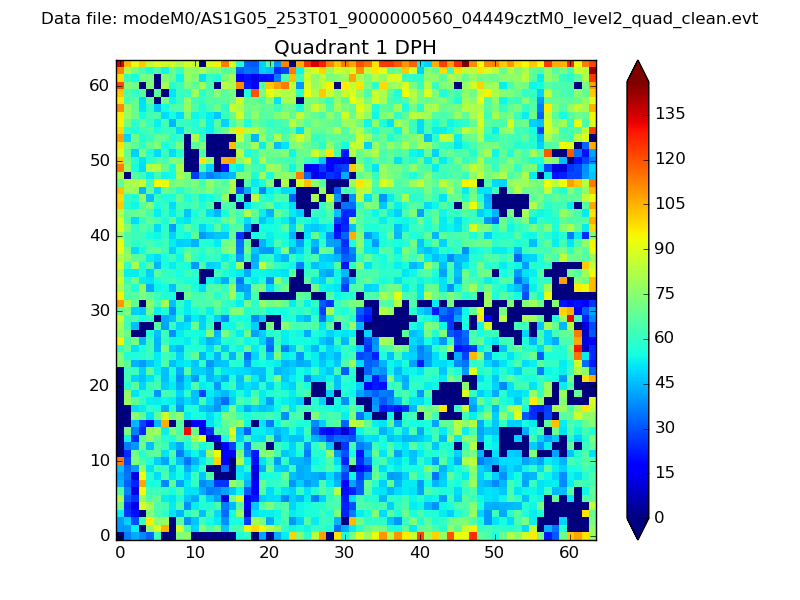 |
Quadrant B |
|---|---|---|---|
| Quadrant D | 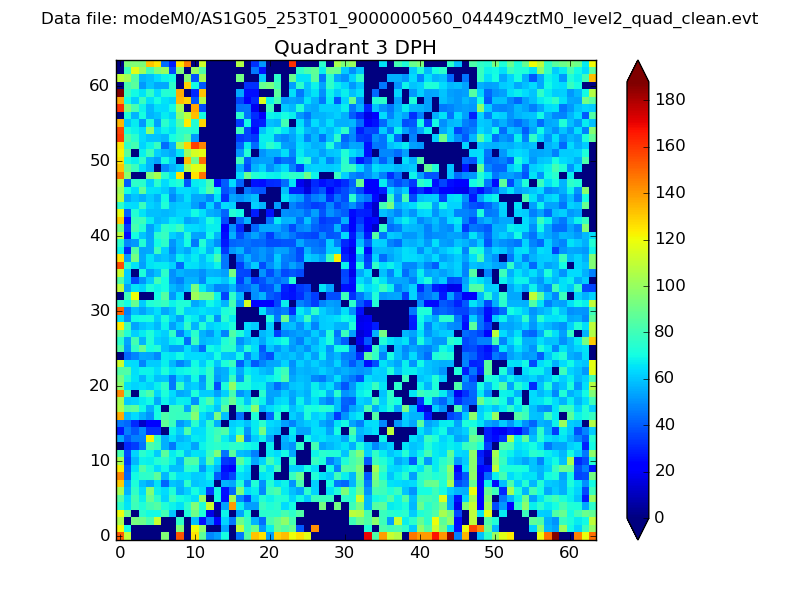 |
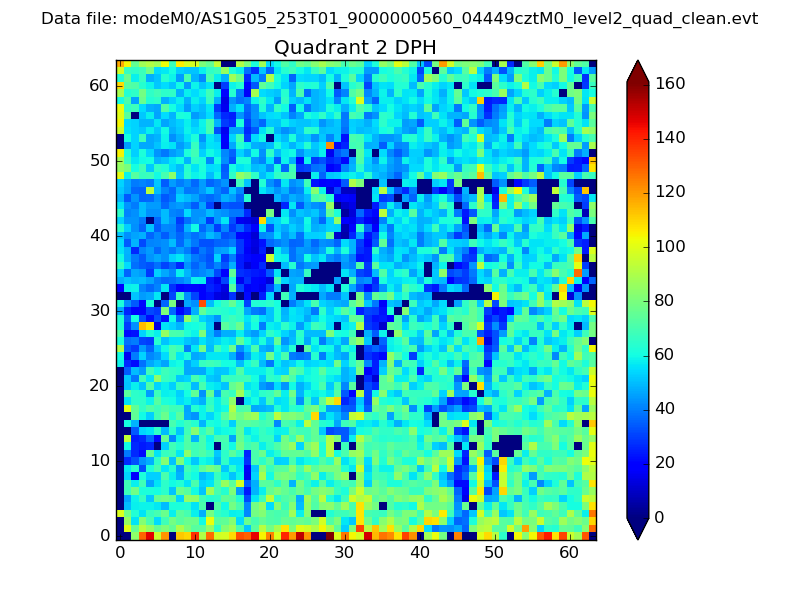 |
Quadrant C |
| Plot type | Count rate plots | Images |
|---|---|---|
| Comparison with Poisson distribution Blue bars denote a histogram of data divided into 1 sec bins. Red curve is a Poisson curve with rate = median count rate of data. |
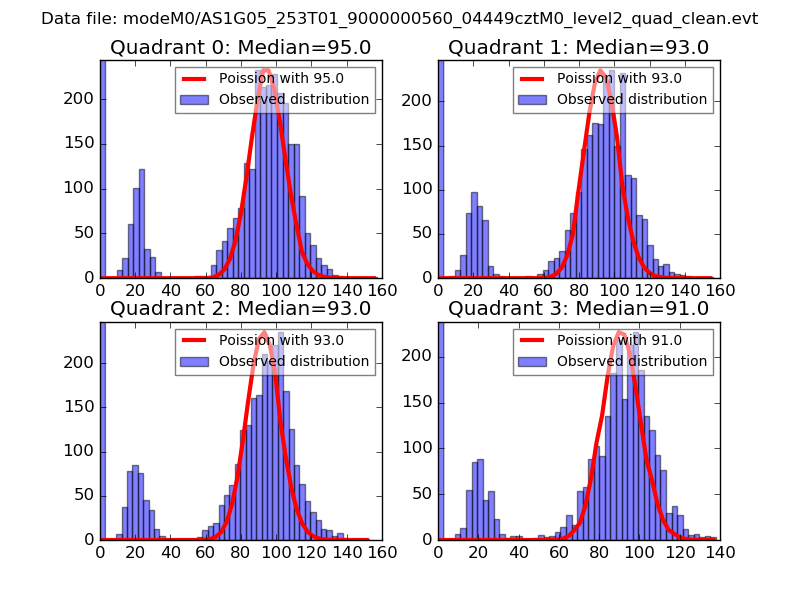 |
 |
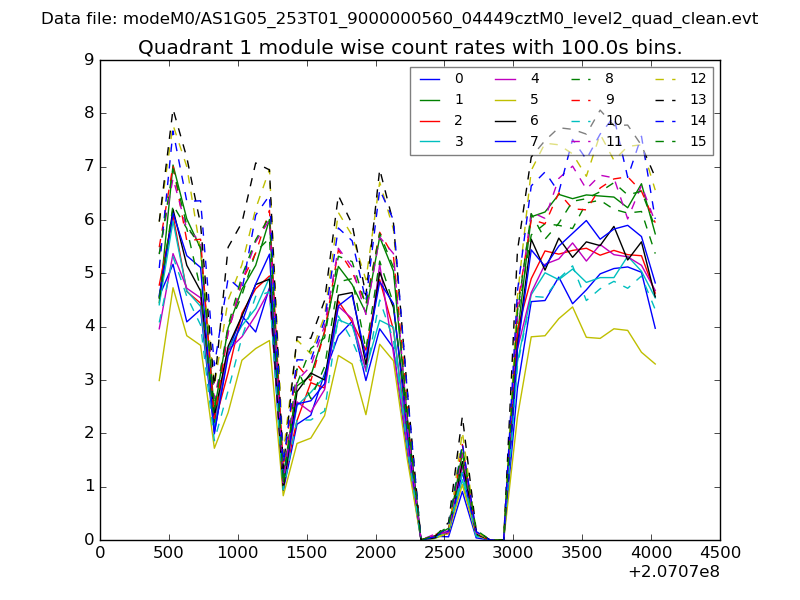
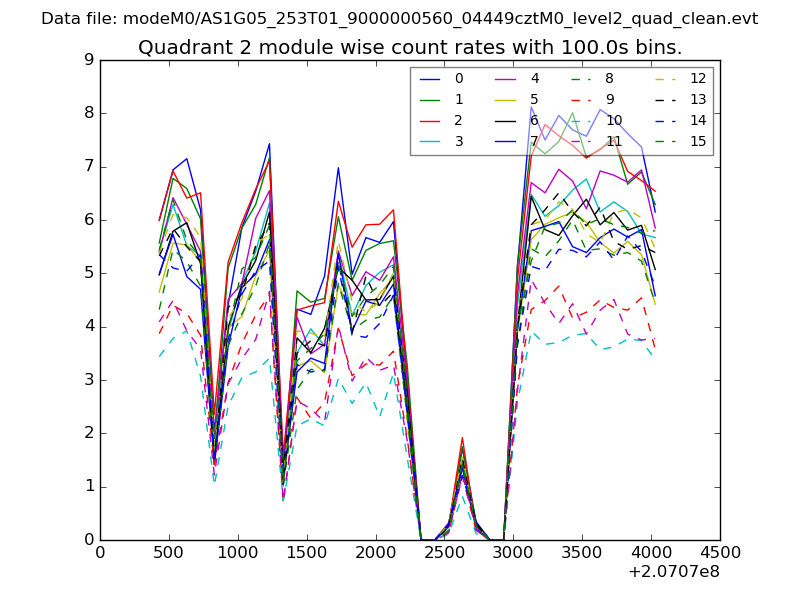
| Quadrant-wise count rates Data is divided into 100 sec bins |
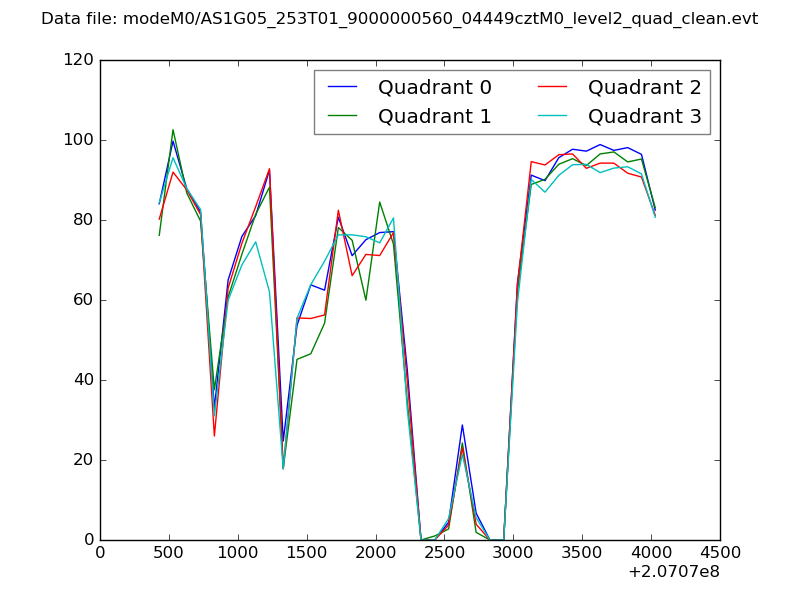 |
|
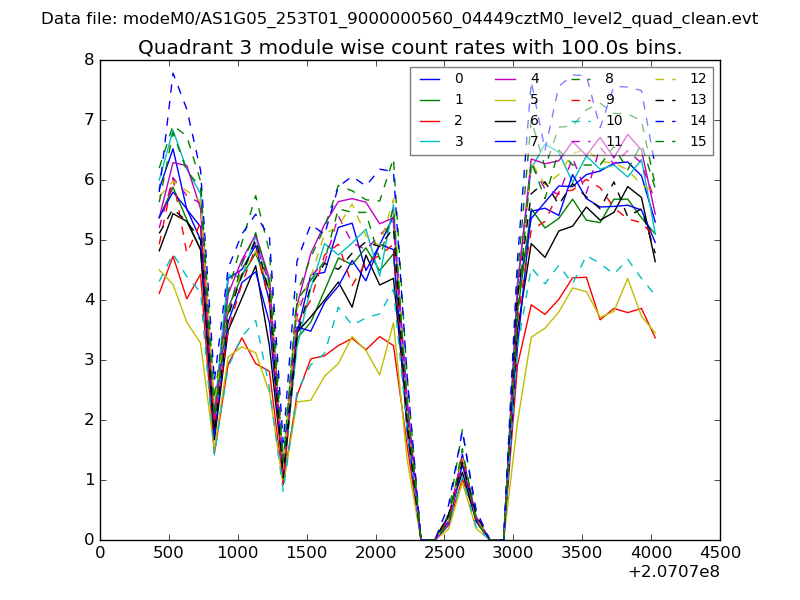
| Module-wise count rates for Quadrant A Data is divided into 100 sec bins |
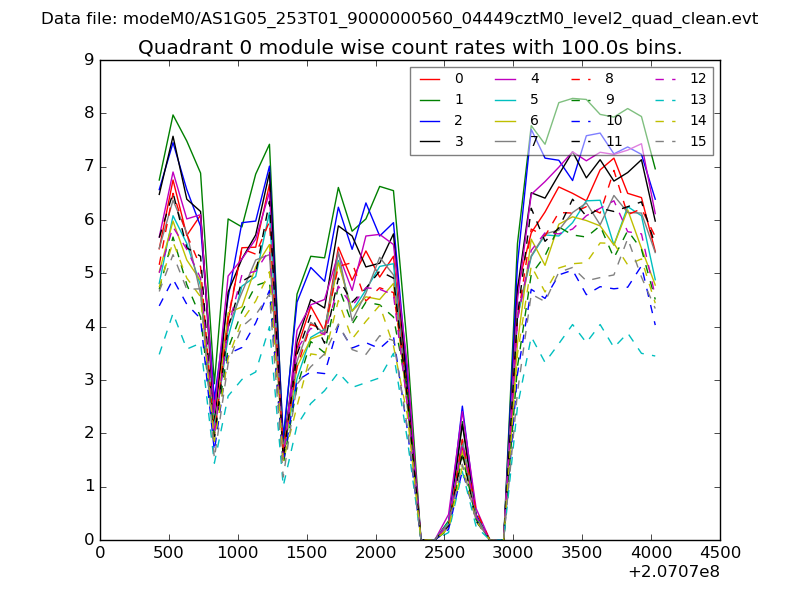 |
 |
| Module-wise count rates for Quadrant B Data is divided into 100 sec bins |
 |
 |
| Module-wise count rates for Quadrant C Data is divided into 100 sec bins |
 |
 |
| Module-wise count rates for Quadrant D Data is divided into 100 sec bins |
 |
 |
| Parameter | Plot |
|---|---|
| CZT HV Monitor | 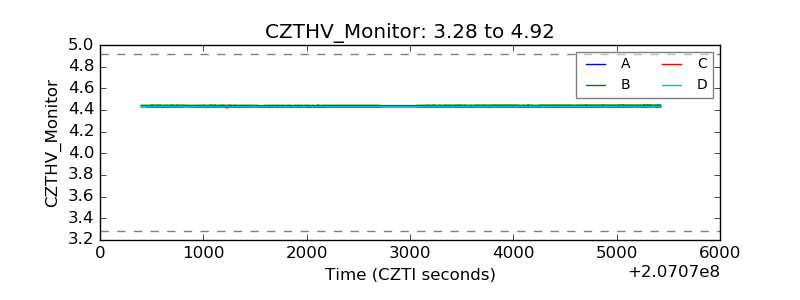 |
| D_VDD | 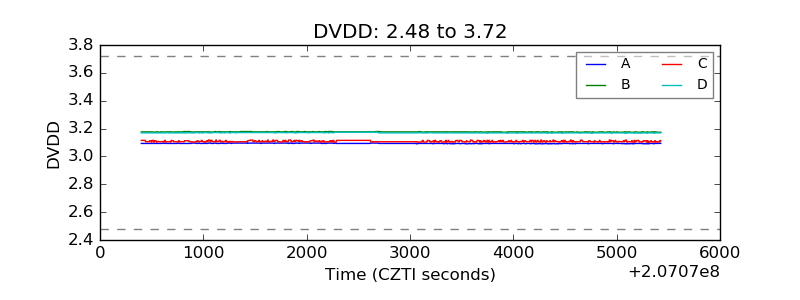 |
| Temperature 1 | 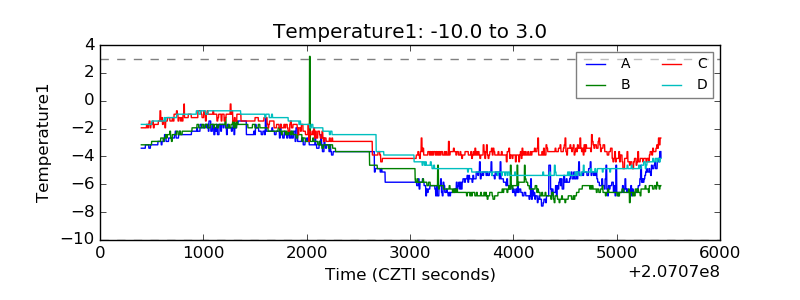 |
| Veto HV Monitor | 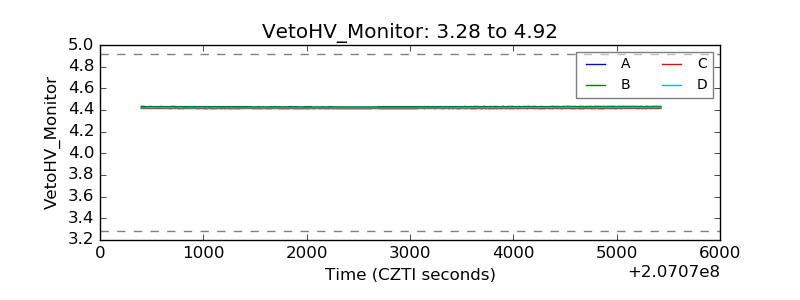 |
| Veto LLD | 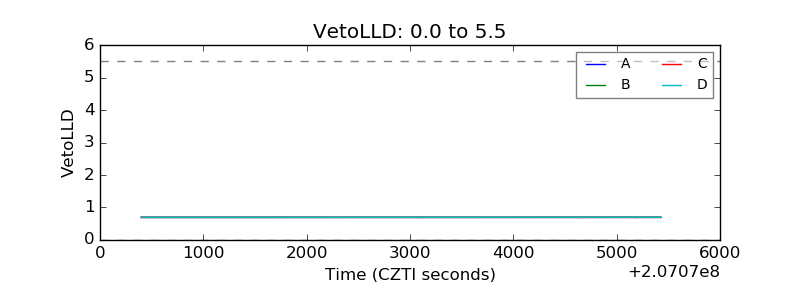 |
| Alpha Counter | 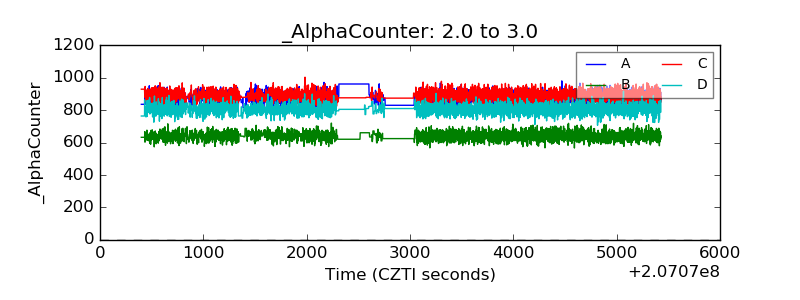 |
| _CPM_Rate | 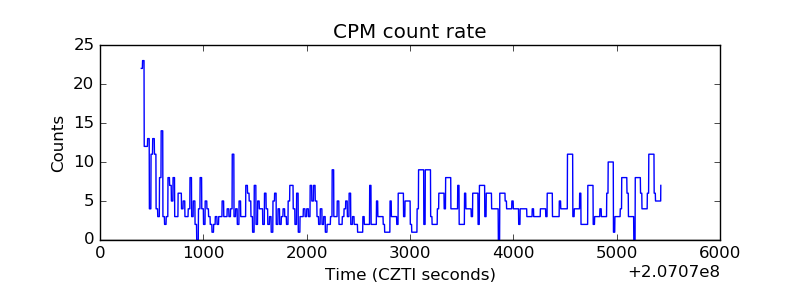 |
| CZT Counter | 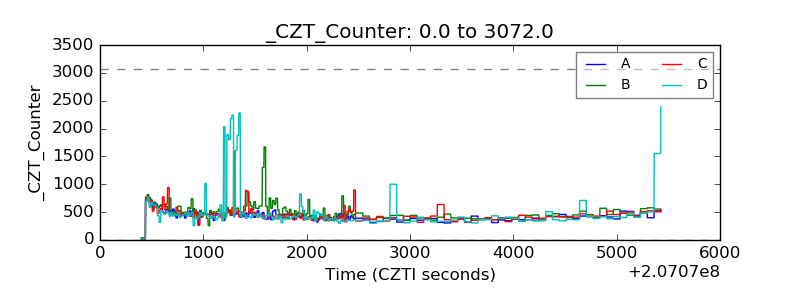 |
| +2.5 Volts monitor | 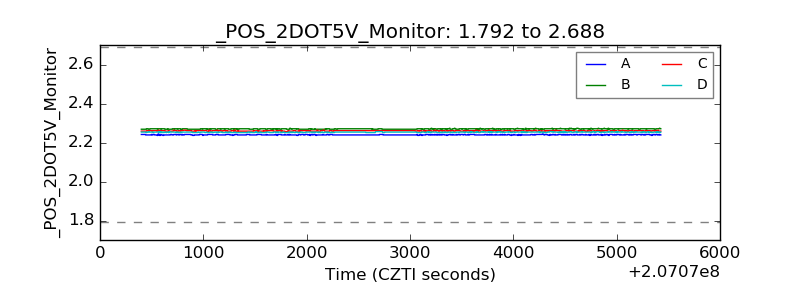 |
| +5 Volts monitor | 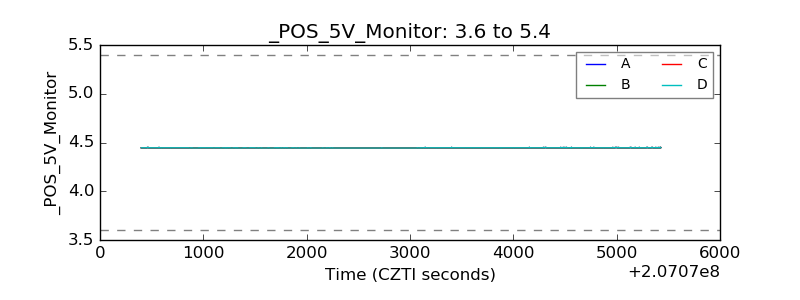 |
| _ROLL_ROT | 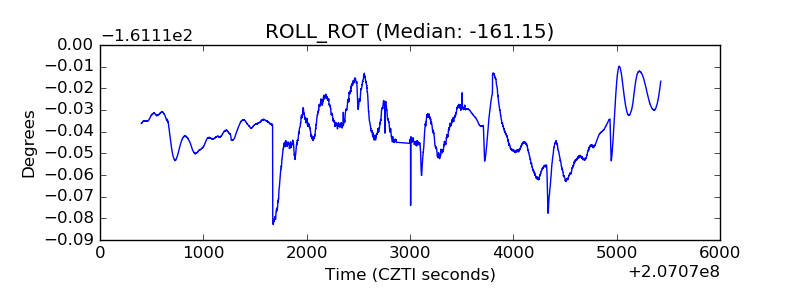 |
| _Roll_DEC | 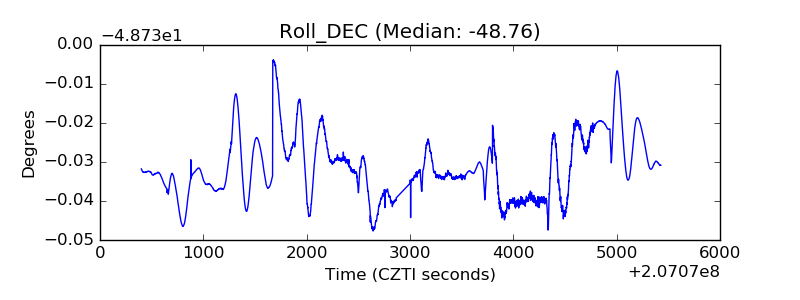 |
| _Roll_RA | 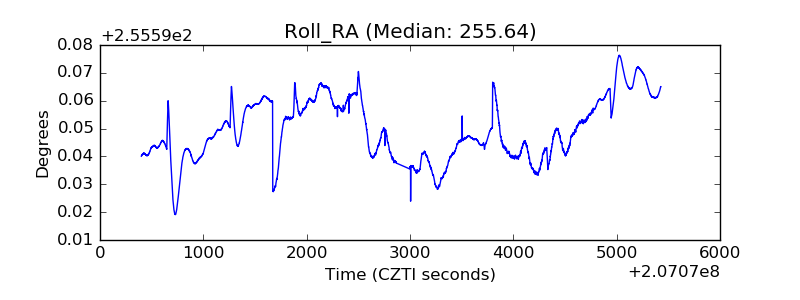 |
| Veto Counter |  |