| Param | Original file | Final file |
|---|---|---|
| Filename | modeM0/AS1G05_253T01_9000000560_04452cztM0_level2.evt | modeM0/AS1G05_253T01_9000000560_04452cztM0_level2_quad_clean.evt |
| Size (bytes) | 1,265,181,120 | 214,799,040 |
| Size | 1.2 GB | 204.8 MB |
| Events in quadrant A | 9,011,436 | 1,314,077 |
| Events in quadrant B | 9,765,552 | 1,286,144 |
| Events in quadrant C | 8,893,681 | 1,295,904 |
| Events in quadrant D | 9,323,247 | 1,263,099 |
| Mode SS | |||
|---|---|---|---|
| Quadrant | BADHDUFLAG | Total packets | Discarded packets |
| A | 0 | 402 | 0 |
| B | 0 | 402 | 0 |
| C | 0 | 402 | 0 |
| D | 0 | 402 | 0 |
| Mode M9 | |||
|---|---|---|---|
| Quadrant | BADHDUFLAG | Total packets | Discarded packets |
| A | 0 | 24 | 0 |
| B | 0 | 24 | 0 |
| C | 0 | 24 | 0 |
| D | 0 | 24 | 0 |
| Mode M0 | |||
|---|---|---|---|
| Quadrant | BADHDUFLAG | Total packets | Discarded packets |
| A | 0 | 40986 | 51 |
| B | 0 | 42390 | 78 |
| C | 0 | 40518 | 43 |
| D | 0 | 42549 | 52 |
| Quadrant | Total seconds | Saturated seconds | Saturation percentage |
|---|---|---|---|
| A | 19532 | 118 | 0.604137% |
| B | 19518 | 147 | 0.753151% |
| C | 19535 | 50 | 0.255951% |
| D | 19532 | 262 | 1.341388% |
Noise dominated data is calculated using 1-second bins in cleaned event files. If a bin has >2000 counts, and if more than 50% of those come from <1% of pixels, then it is considered to be noise-dominated and hence unusable.
| Quadrant | # 1 sec bins | Bins with >0 counts | Bins with >2000 counts | High rate bins dominated by noise | Noise dominated (total time) | Noise dominated (detector-on time) | Marked lightcurve |
|---|---|---|---|---|---|---|---|
| A | 22079 | 19558 | 28 | 28 | 0.13% | 0.14% | 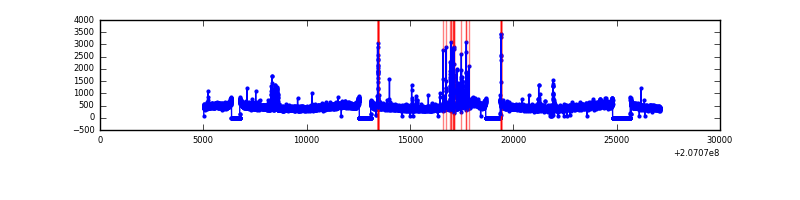 |
| B | 22079 | 19558 | 34 | 34 | 0.15% | 0.17% | 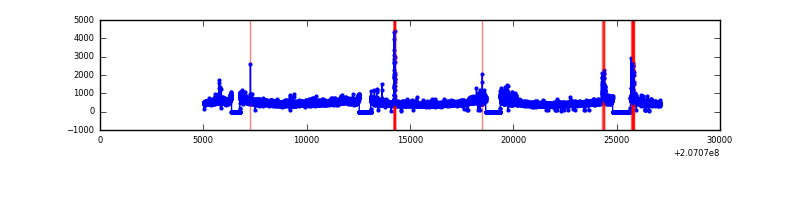 |
| C | 22079 | 19558 | 24 | 24 | 0.11% | 0.12% | 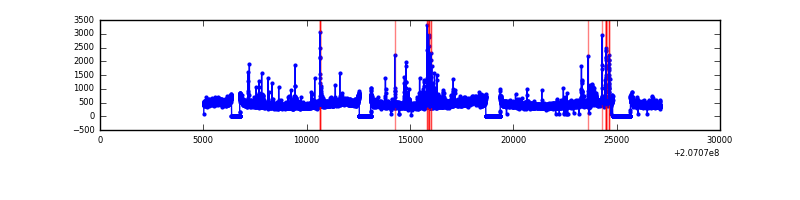 |
| D | 22079 | 19557 | 215 | 215 | 0.97% | 1.10% | 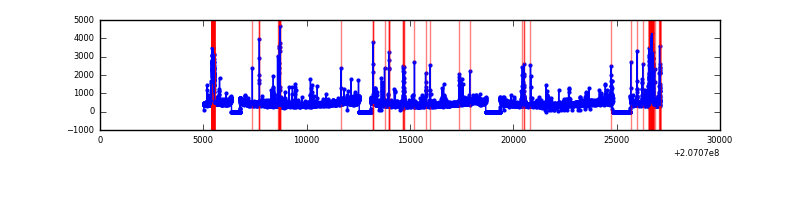 |
Top three noisy pixels from each quadrant. If the there are fewer than three noisy pixels in the level2.evt file, extra rows are filled as -1
| Pixel properties | Quadrant properties | ||||||
|---|---|---|---|---|---|---|---|
| Quadrant | DetID | PixID | Counts | Sigma | Mean | Median | Sigma |
| A | 0 | 13 | 292496 | 640.25 | 2228 | 2184 | 453.4 |
| A | 0 | 50 | 59202 | 125.75 | 2228 | 2184 | 453.4 |
| A | 13 | 248 | 44750 | 93.87 | 2228 | 2184 | 453.4 |
| B | 15 | 204 | 383816 | 885.88 | 2249 | 2198 | 430.8 |
| B | 15 | 185 | 360630 | 832.05 | 2249 | 2198 | 430.8 |
| B | 10 | 246 | 107721 | 244.96 | 2249 | 2198 | 430.8 |
| C | 9 | 16 | 183839 | 362.18 | 2163 | 2174 | 501.6 |
| C | 14 | 48 | 148064 | 290.86 | 2163 | 2174 | 501.6 |
| C | 9 | 247 | 60542 | 116.37 | 2163 | 2174 | 501.6 |
| D | 12 | 227 | 546844 | 1044.83 | 2144 | 2080 | 521.4 |
| D | 13 | 239 | 97617 | 183.24 | 2144 | 2080 | 521.4 |
| D | 9 | 35 | 96523 | 181.14 | 2144 | 2080 | 521.4 |
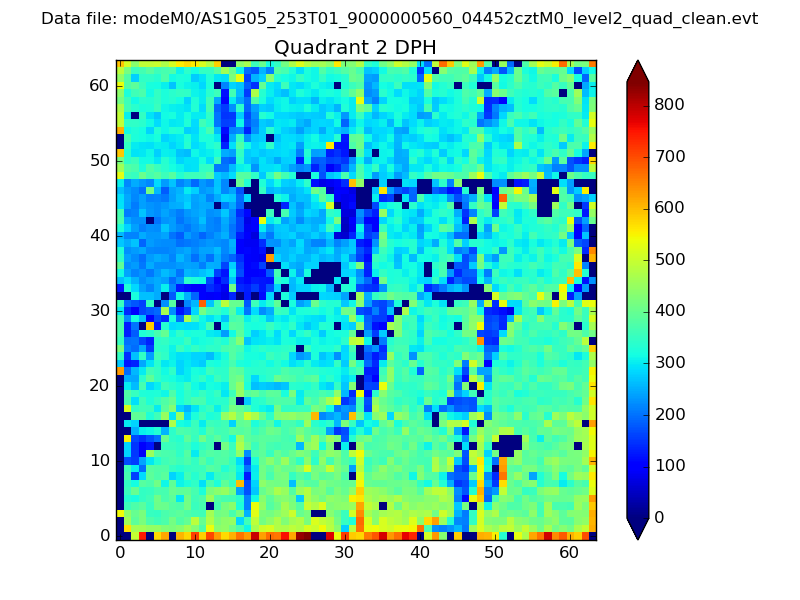
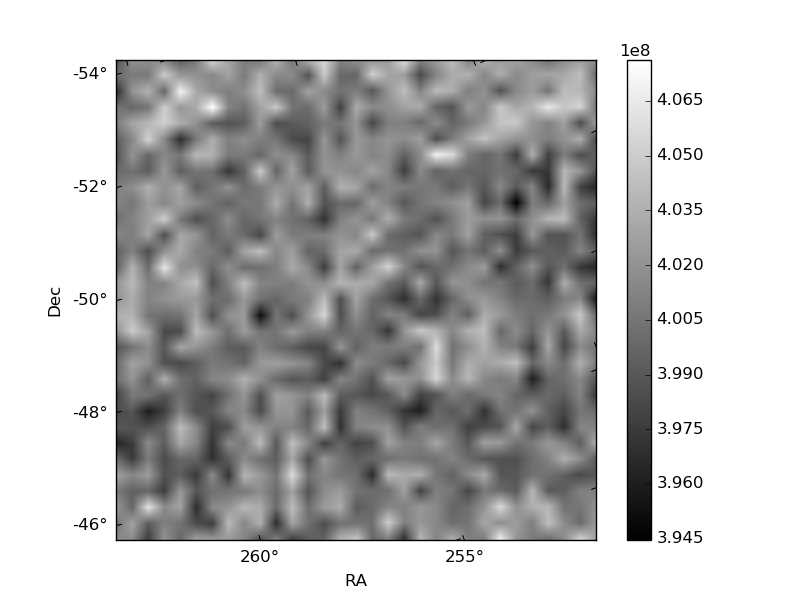
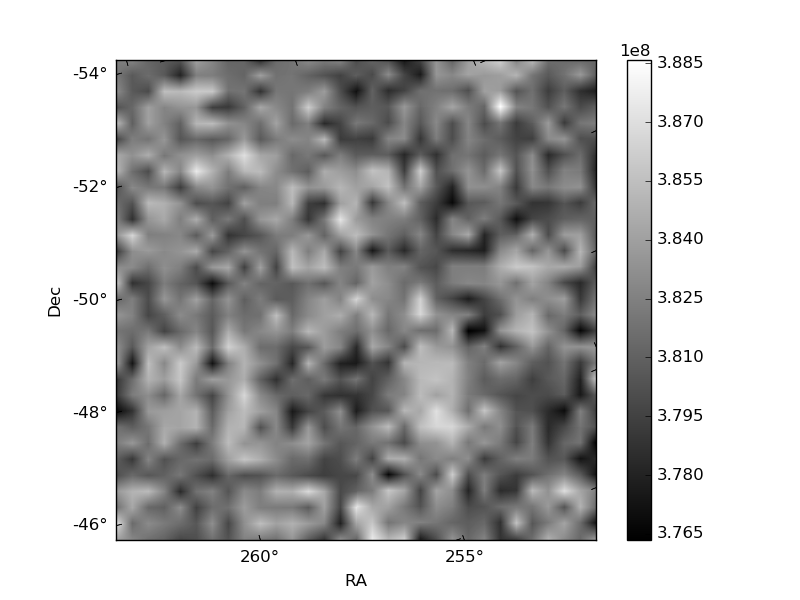
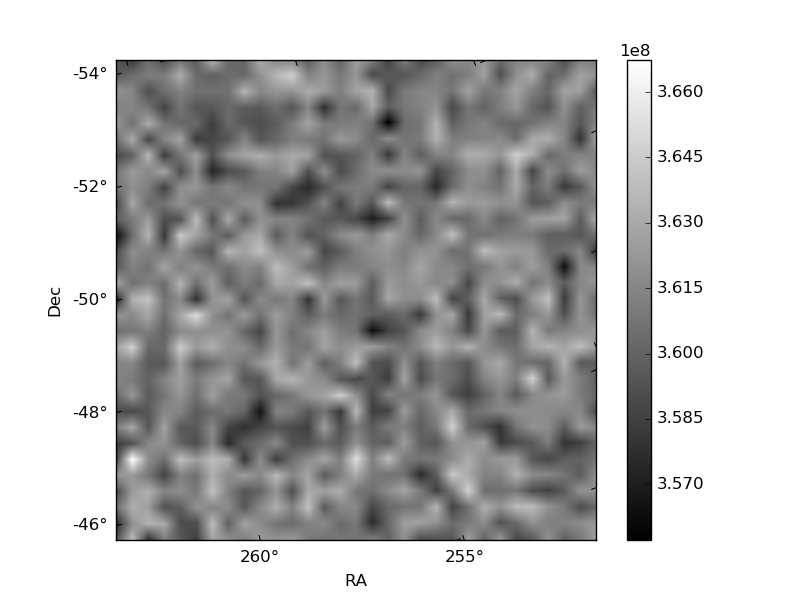
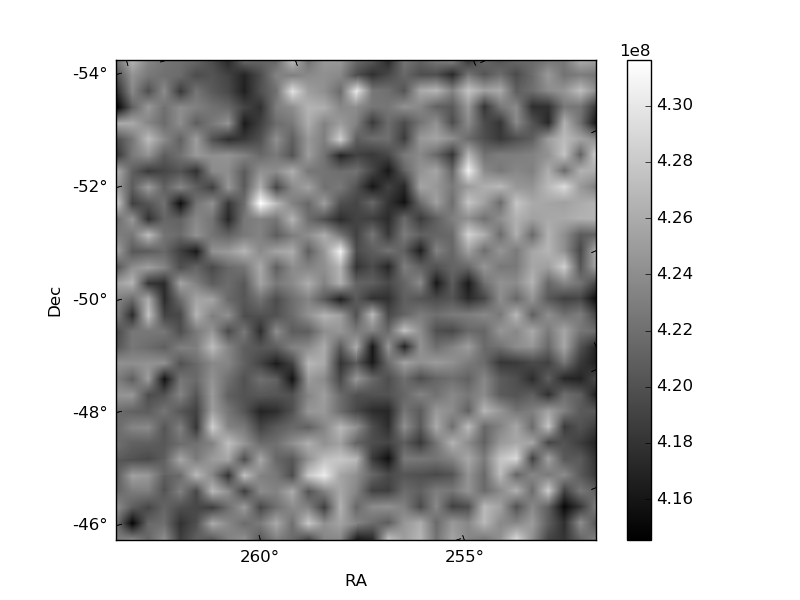
Histogram calculated using DETX and DETY for each event in the final _common_clean file
| Quadrant A | 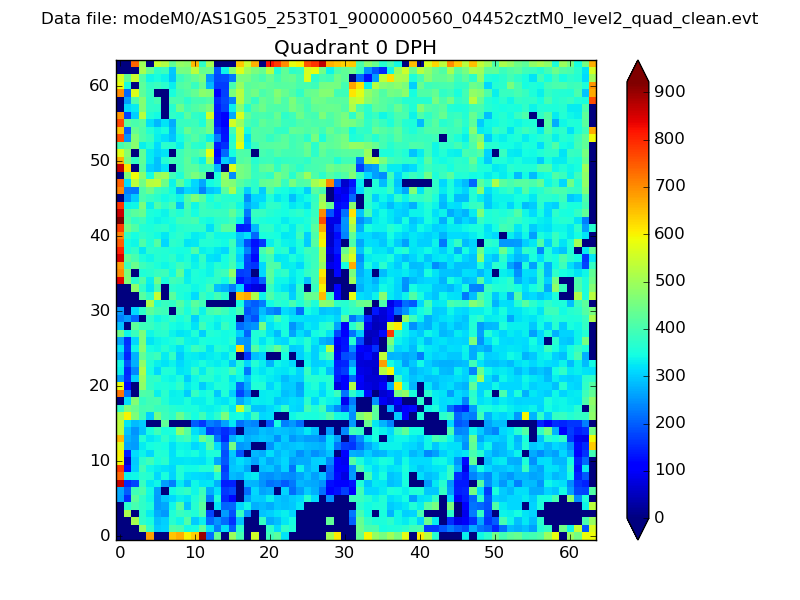 |
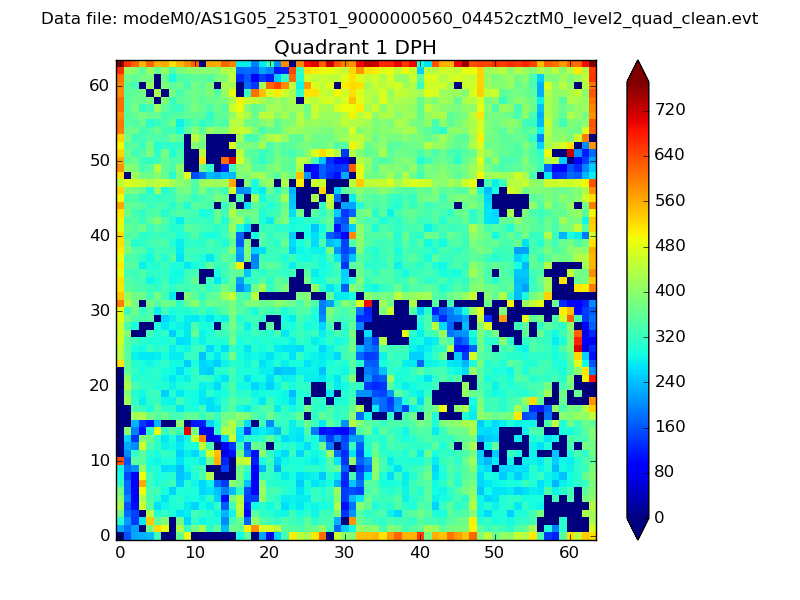 |
Quadrant B |
|---|---|---|---|
| Quadrant D | 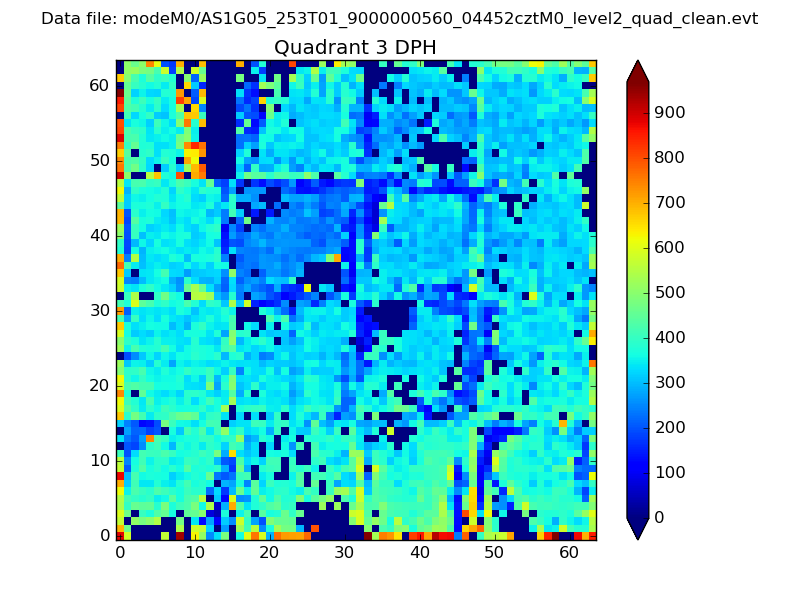 |
 |
Quadrant C |
| Plot type | Count rate plots | Images |
|---|---|---|
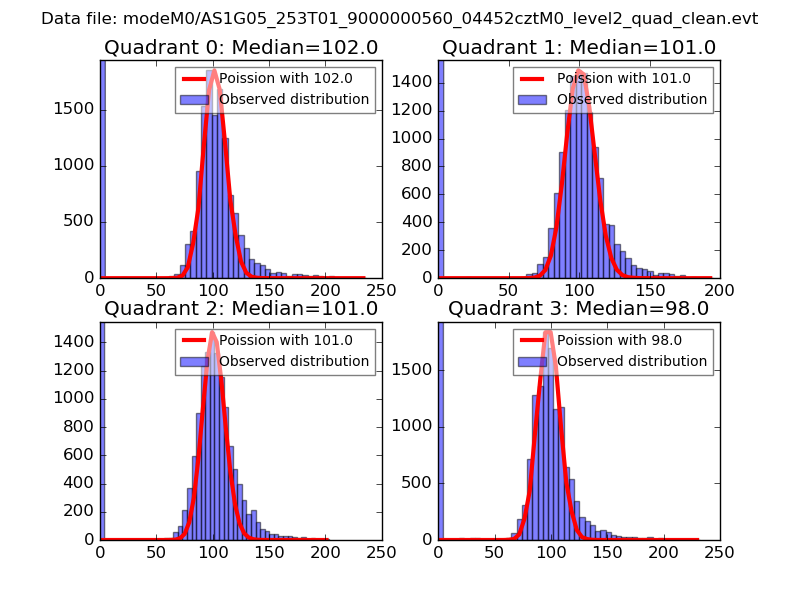
| Comparison with Poisson distribution Blue bars denote a histogram of data divided into 1 sec bins. Red curve is a Poisson curve with rate = median count rate of data. |
 |
 |
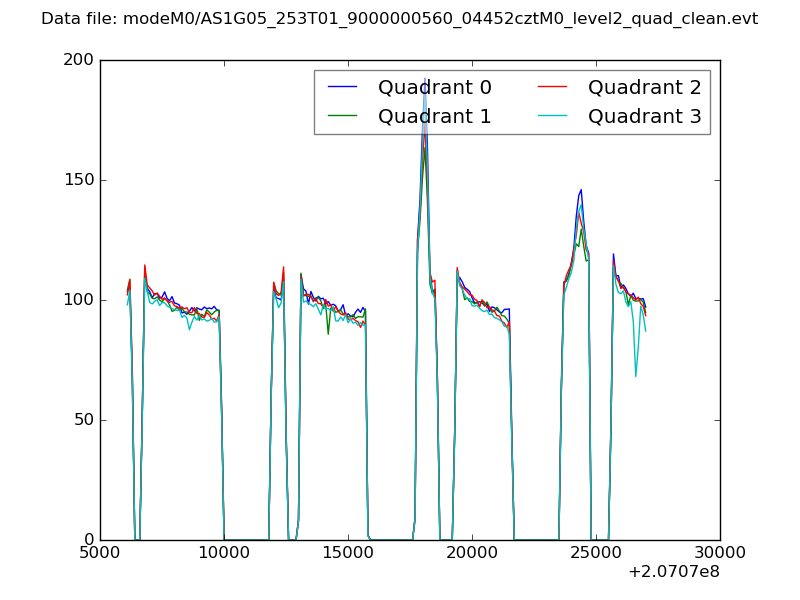
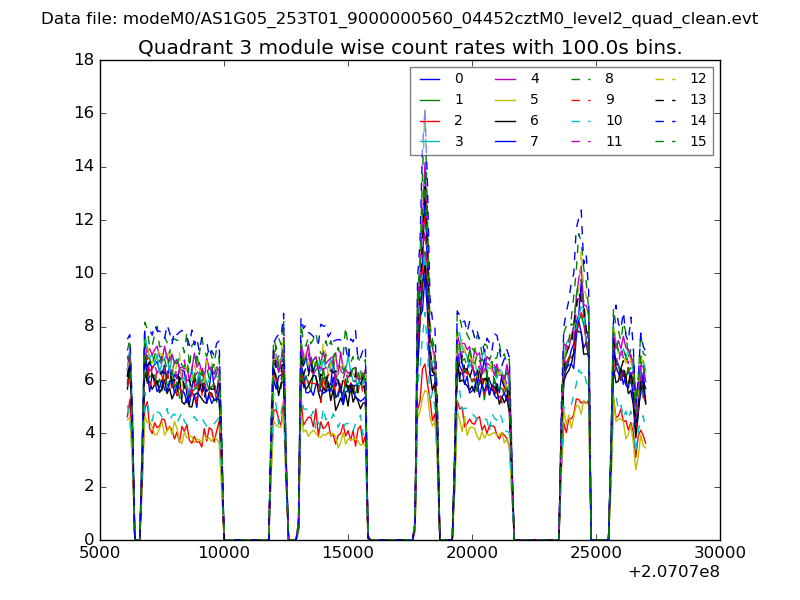
| Quadrant-wise count rates Data is divided into 100 sec bins |
 |
|
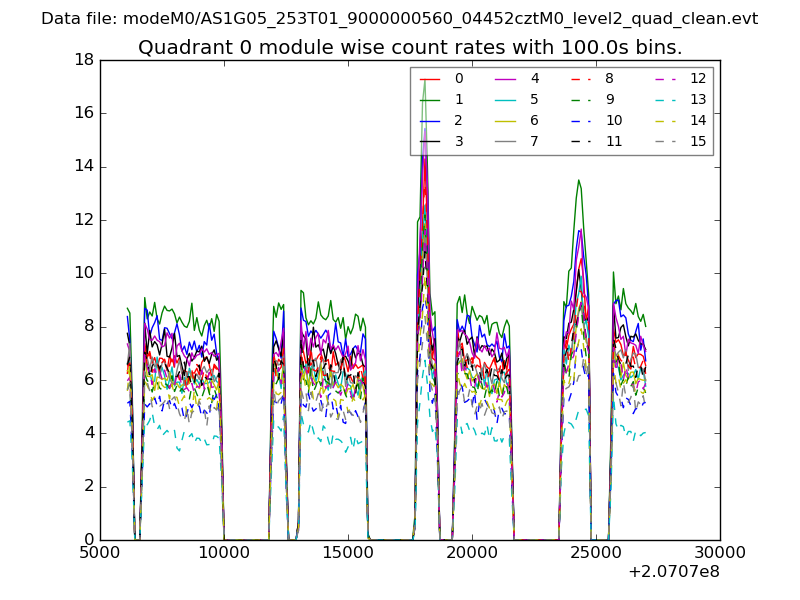
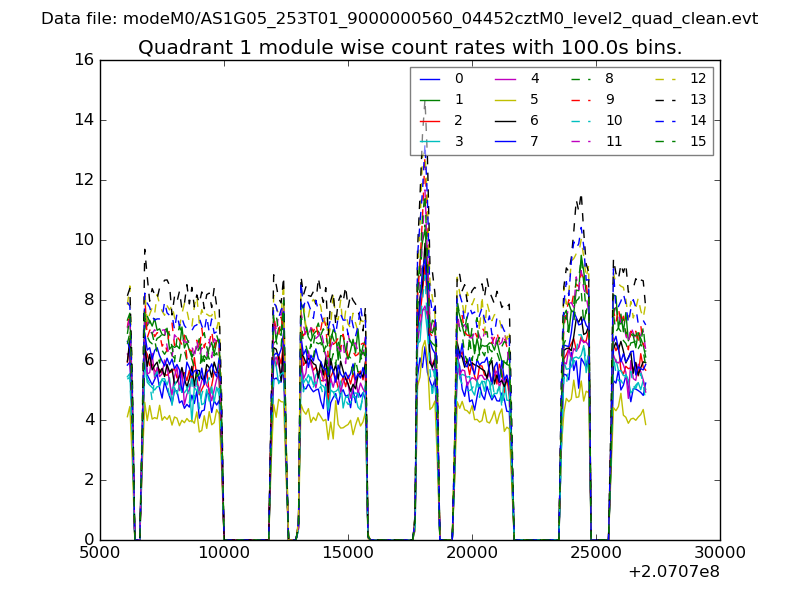
| Module-wise count rates for Quadrant A Data is divided into 100 sec bins |
 |
 |
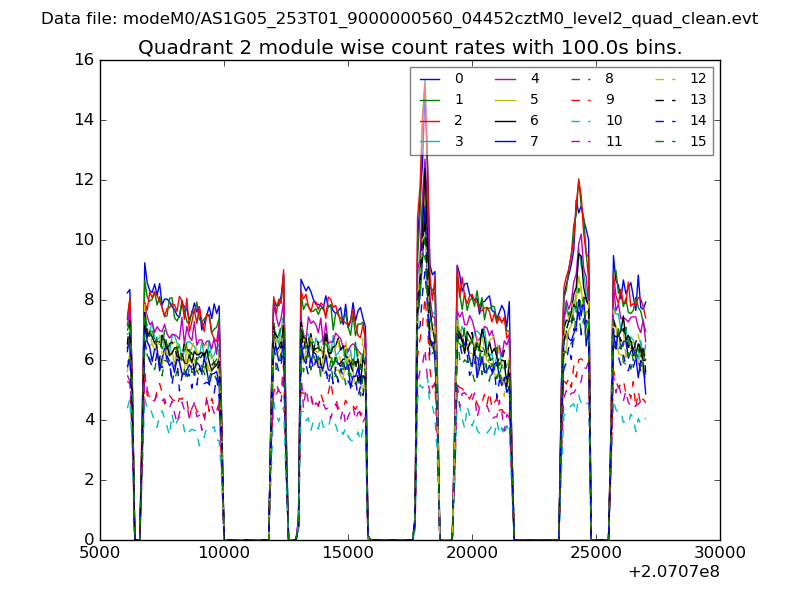
| Module-wise count rates for Quadrant B Data is divided into 100 sec bins |
 |
 |
| Module-wise count rates for Quadrant C Data is divided into 100 sec bins |
 |
 |
| Module-wise count rates for Quadrant D Data is divided into 100 sec bins |
 |
 |
| Parameter | Plot |
|---|---|
| CZT HV Monitor | 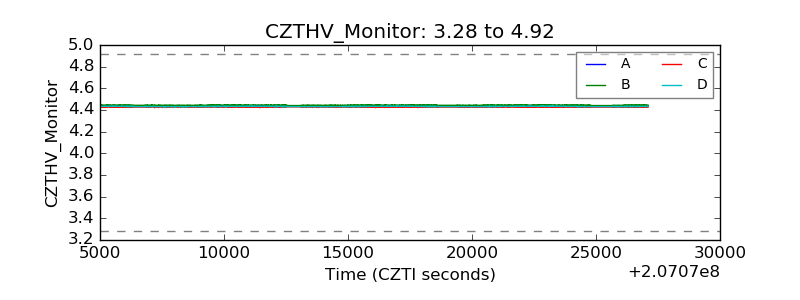 |
| D_VDD |  |
| Temperature 1 | 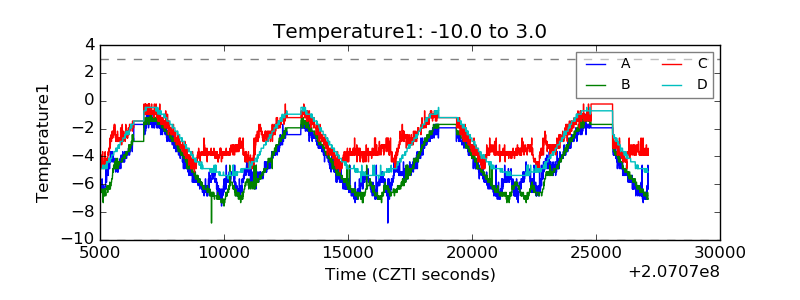 |
| Veto HV Monitor | 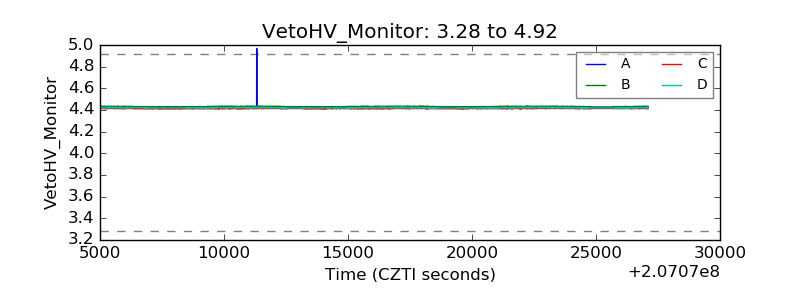 |
| Veto LLD | 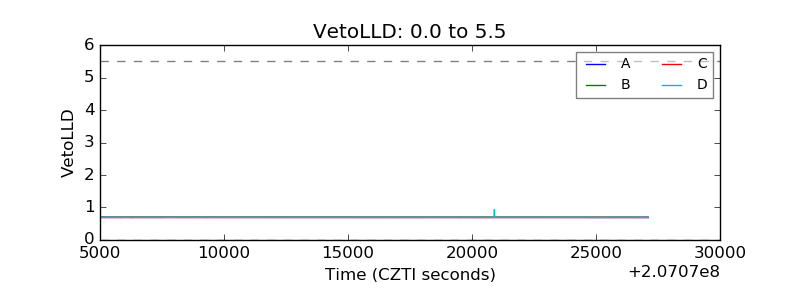 |
| Alpha Counter | 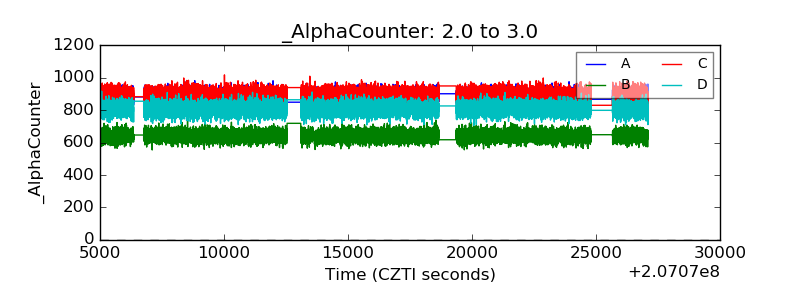 |
| _CPM_Rate | 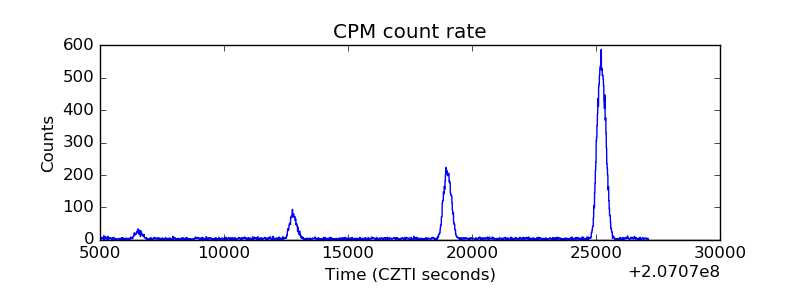 |
| CZT Counter | 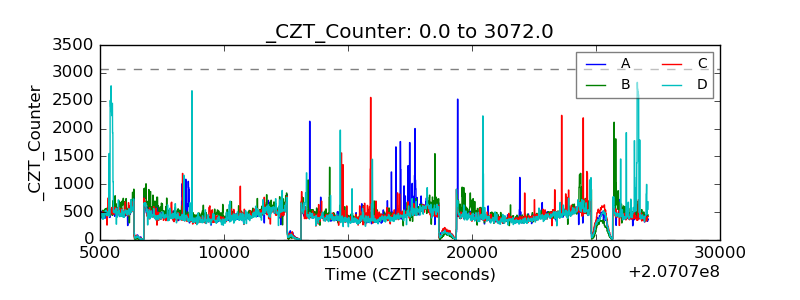 |
| +2.5 Volts monitor |  |
| +5 Volts monitor |  |
| _ROLL_ROT | 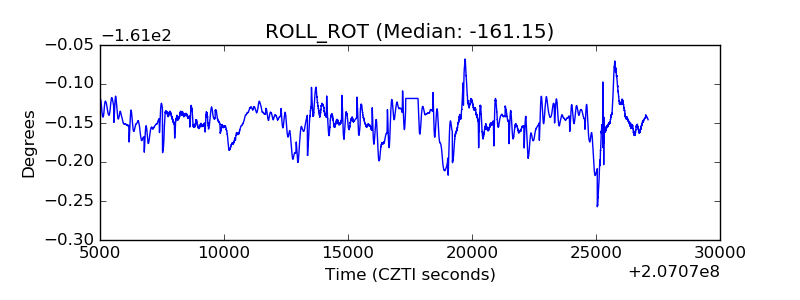 |
| _Roll_DEC | 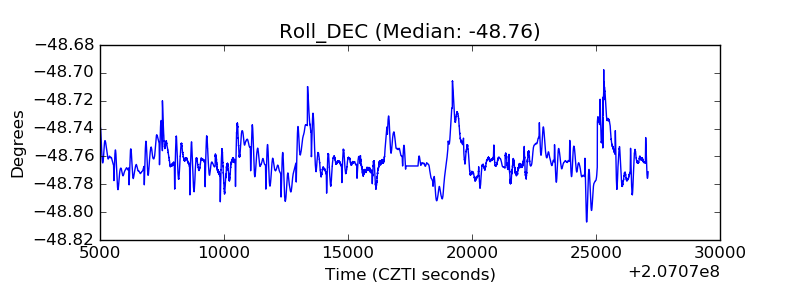 |
| _Roll_RA | 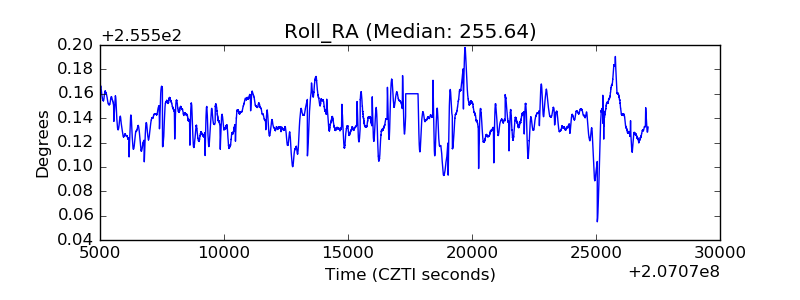 |
| Veto Counter | 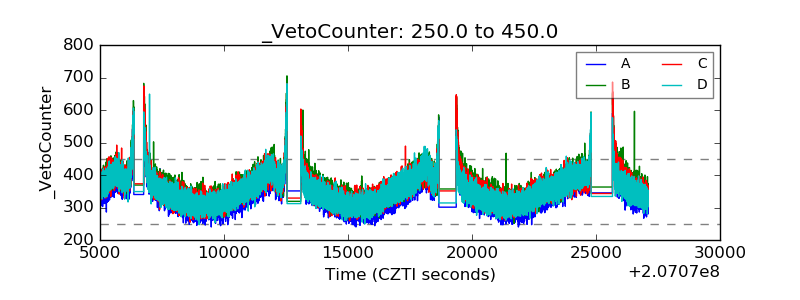 |