| Param | Original file | Final file |
|---|---|---|
| Filename | modeM0/AS1G05_253T01_9000000560_04453cztM0_level2.evt | modeM0/AS1G05_253T01_9000000560_04453cztM0_level2_quad_clean.evt |
| Size (bytes) | 473,022,720 | 83,024,640 |
| Size | 451.1 MB | 79.2 MB |
| Events in quadrant A | 3,206,551 | 521,950 |
| Events in quadrant B | 3,294,090 | 508,714 |
| Events in quadrant C | 3,088,775 | 513,326 |
| Events in quadrant D | 4,269,229 | 491,286 |
| Mode SS | |||
|---|---|---|---|
| Quadrant | BADHDUFLAG | Total packets | Discarded packets |
| A | 0 | 140 | 0 |
| B | 0 | 140 | 0 |
| C | 0 | 140 | 0 |
| D | 0 | 140 | 0 |
| Mode M9 | |||
|---|---|---|---|
| Quadrant | BADHDUFLAG | Total packets | Discarded packets |
| A | 0 | 13 | 0 |
| B | 0 | 13 | 0 |
| C | 0 | 13 | 0 |
| D | 0 | 14 | 0 |
| Mode M0 | |||
|---|---|---|---|
| Quadrant | BADHDUFLAG | Total packets | Discarded packets |
| A | 0 | 14548 | 3 |
| B | 0 | 14460 | 2 |
| C | 0 | 14182 | 2 |
| D | 0 | 17685 | 2 |
| Quadrant | Total seconds | Saturated seconds | Saturation percentage |
|---|---|---|---|
| A | 6869 | 25 | 0.363954% |
| B | 6869 | 28 | 0.407628% |
| C | 6869 | 13 | 0.189256% |
| D | 6869 | 292 | 4.250983% |
Noise dominated data is calculated using 1-second bins in cleaned event files. If a bin has >2000 counts, and if more than 50% of those come from <1% of pixels, then it is considered to be noise-dominated and hence unusable.
| Quadrant | # 1 sec bins | Bins with >0 counts | Bins with >2000 counts | High rate bins dominated by noise | Noise dominated (total time) | Noise dominated (detector-on time) | Marked lightcurve |
|---|---|---|---|---|---|---|---|
| A | 7889 | 6870 | 4 | 4 | 0.05% | 0.06% | 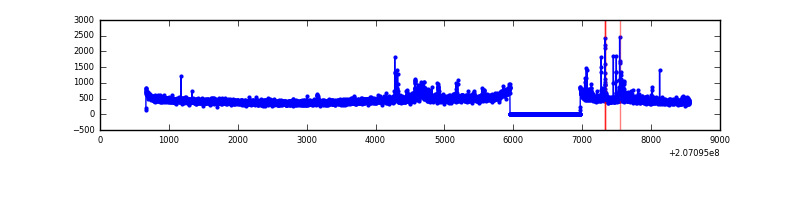 |
| B | 7889 | 6870 | 13 | 13 | 0.16% | 0.19% | 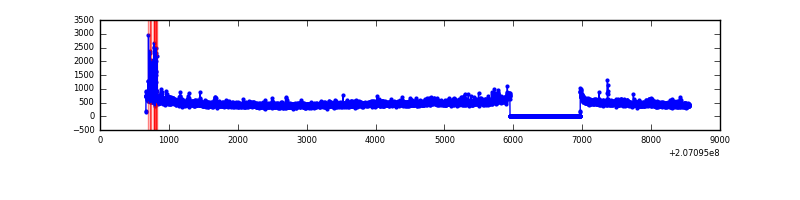 |
| C | 7889 | 6870 | 2 | 2 | 0.03% | 0.03% | 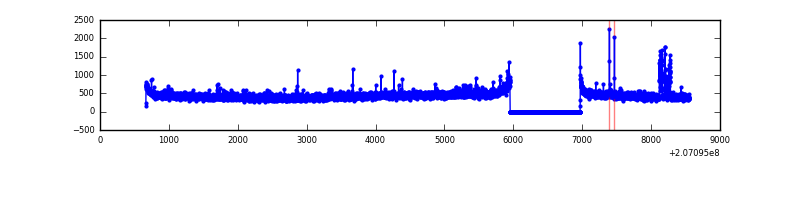 |
| D | 7889 | 6870 | 241 | 241 | 3.05% | 3.51% | 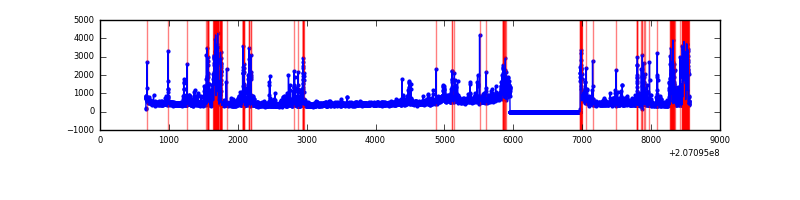 |
Top three noisy pixels from each quadrant. If the there are fewer than three noisy pixels in the level2.evt file, extra rows are filled as -1
| Pixel properties | Quadrant properties | ||||||
|---|---|---|---|---|---|---|---|
| Quadrant | DetID | PixID | Counts | Sigma | Mean | Median | Sigma |
| A | 8 | 15 | 92796 | 579.94 | 777 | 761 | 158.7 |
| A | 0 | 13 | 88755 | 554.48 | 777 | 761 | 158.7 |
| A | 0 | 50 | 13199 | 78.38 | 777 | 761 | 158.7 |
| B | 15 | 204 | 108226 | 710.97 | 787 | 767 | 151.1 |
| B | 10 | 246 | 47524 | 309.35 | 787 | 767 | 151.1 |
| B | 8 | 3 | 37344 | 242.0 | 787 | 767 | 151.1 |
| C | 14 | 48 | 103097 | 581.96 | 756 | 761 | 175.8 |
| C | 9 | 247 | 15331 | 82.86 | 756 | 761 | 175.8 |
| C | 9 | 54 | 11302 | 59.94 | 756 | 761 | 175.8 |
| D | 12 | 233 | 506918 | 2814.74 | 736 | 716 | 179.8 |
| D | 12 | 227 | 324991 | 1803.14 | 736 | 716 | 179.8 |
| D | 2 | 63 | 236351 | 1310.25 | 736 | 716 | 179.8 |
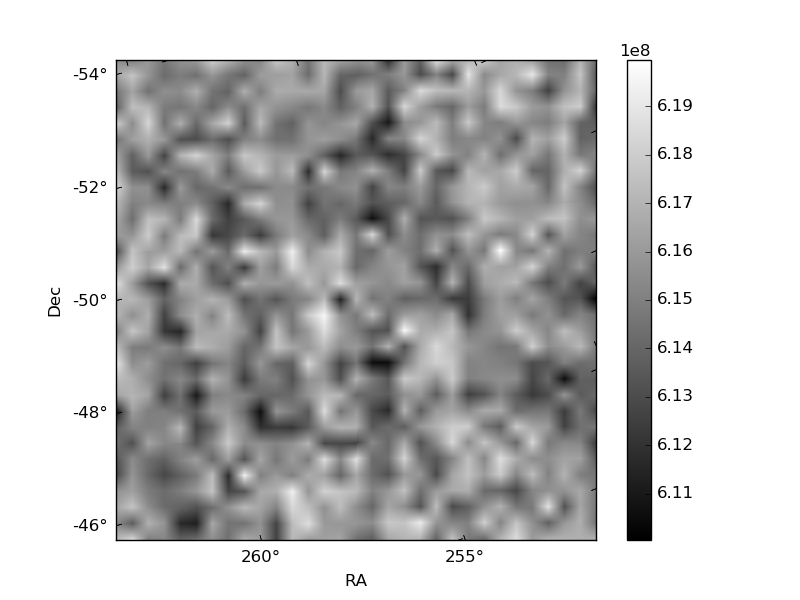
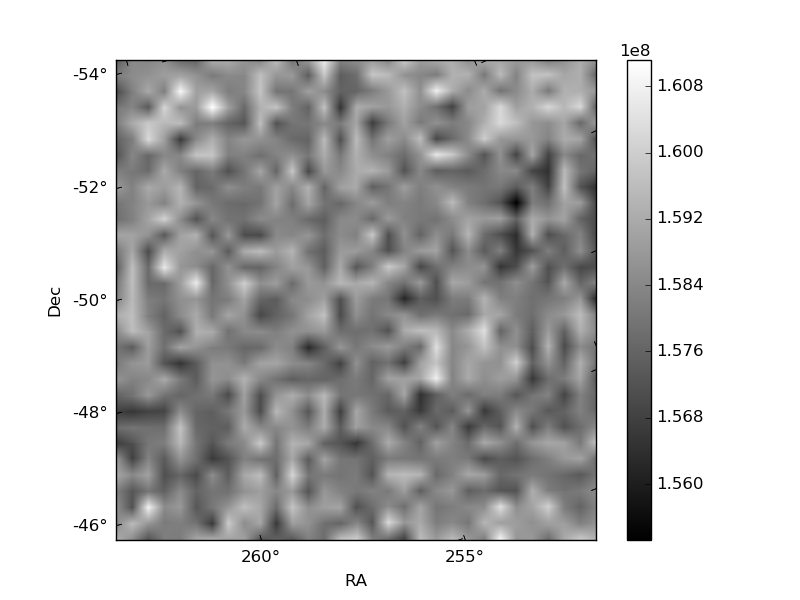
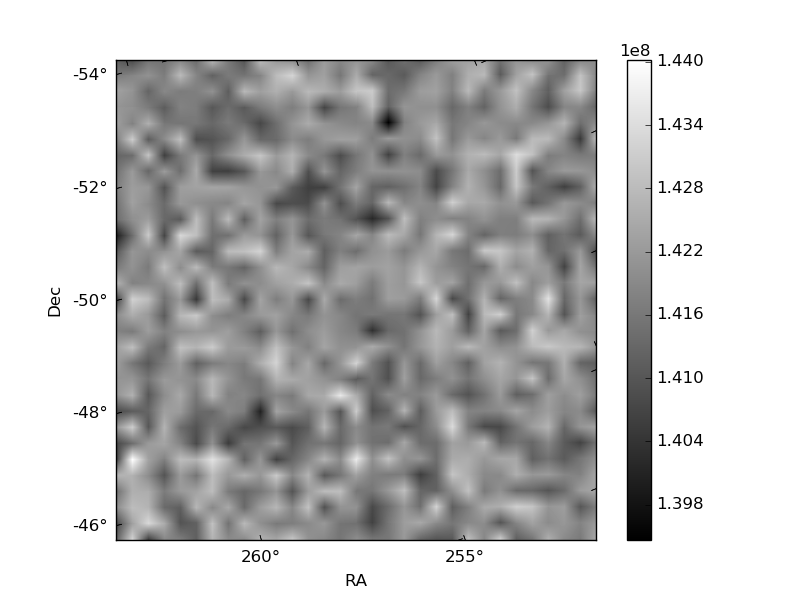
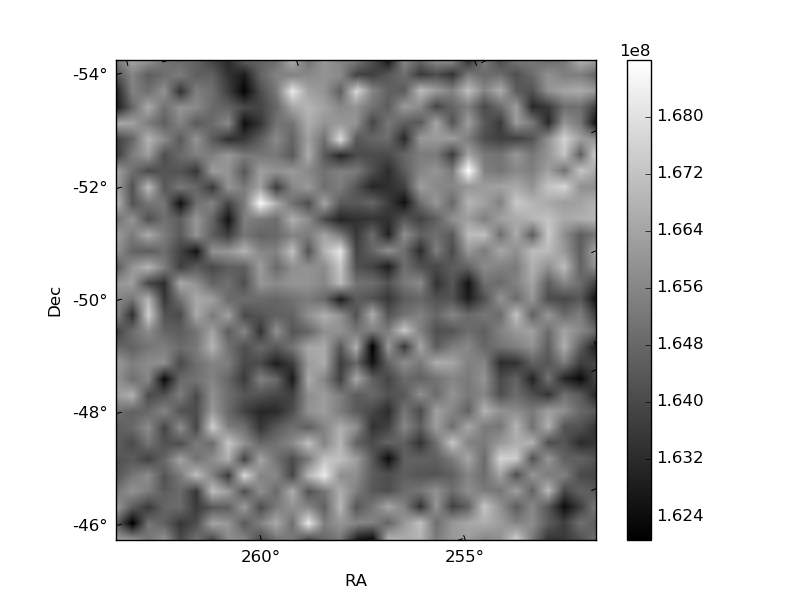
Histogram calculated using DETX and DETY for each event in the final _common_clean file
| Quadrant A | 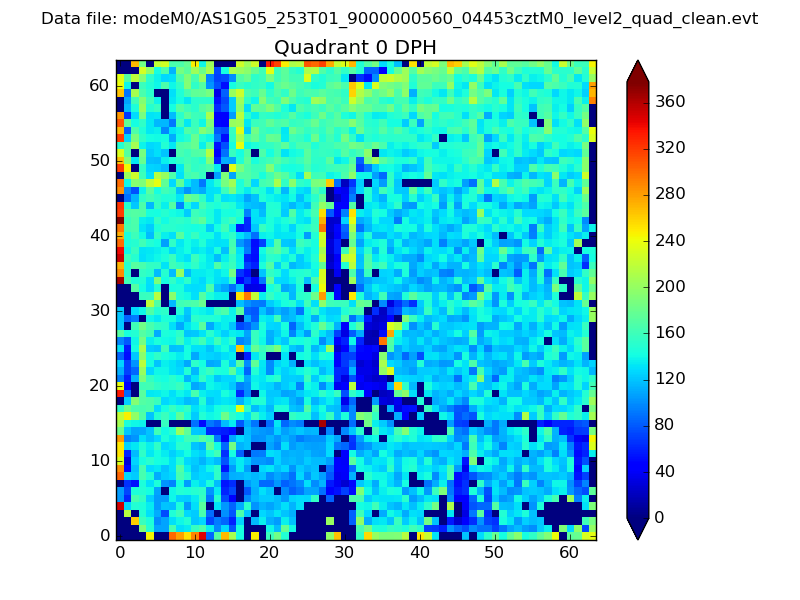 |
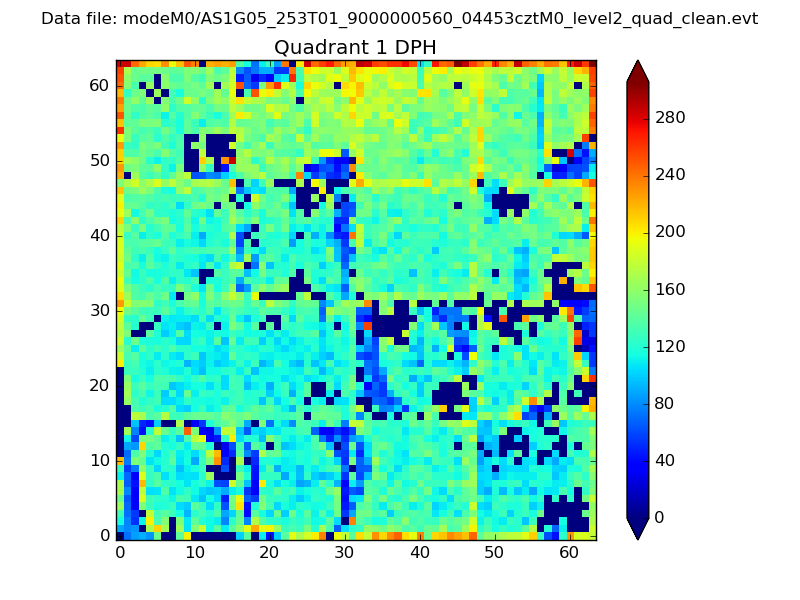 |
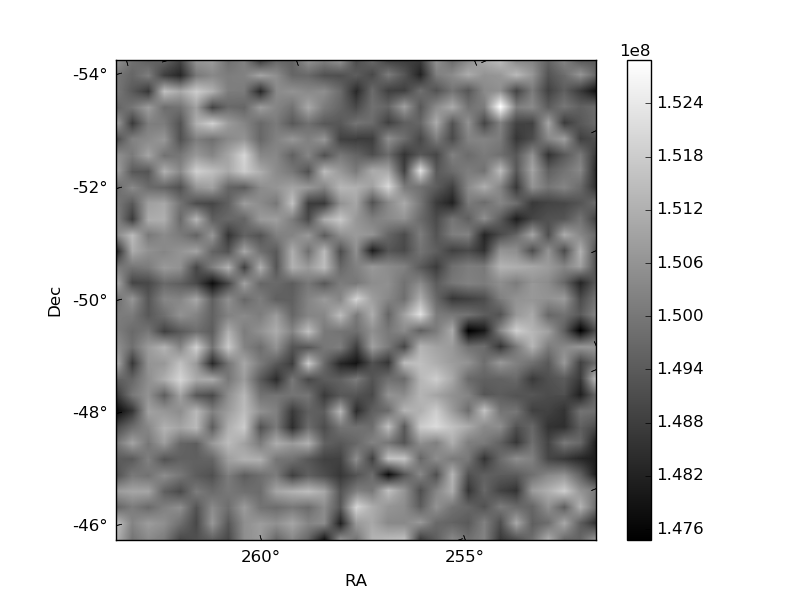
Quadrant B |
|---|---|---|---|
| Quadrant D | 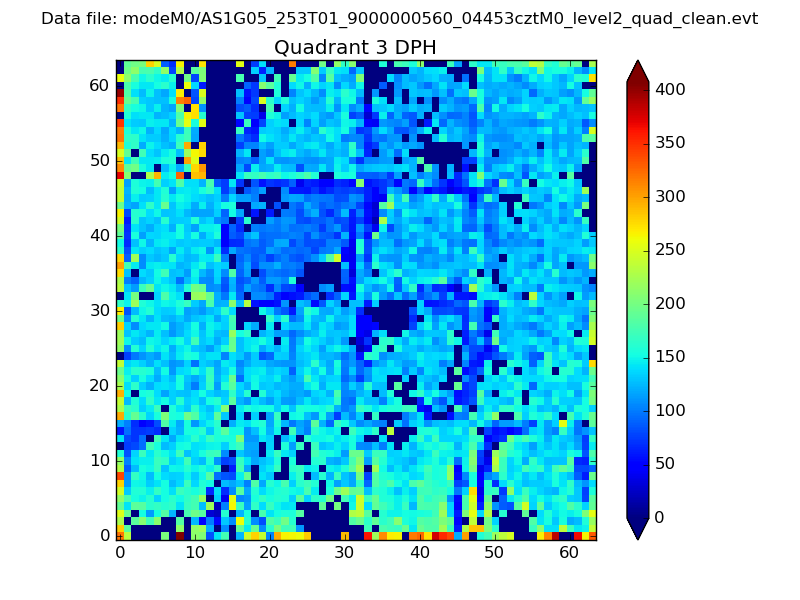 |
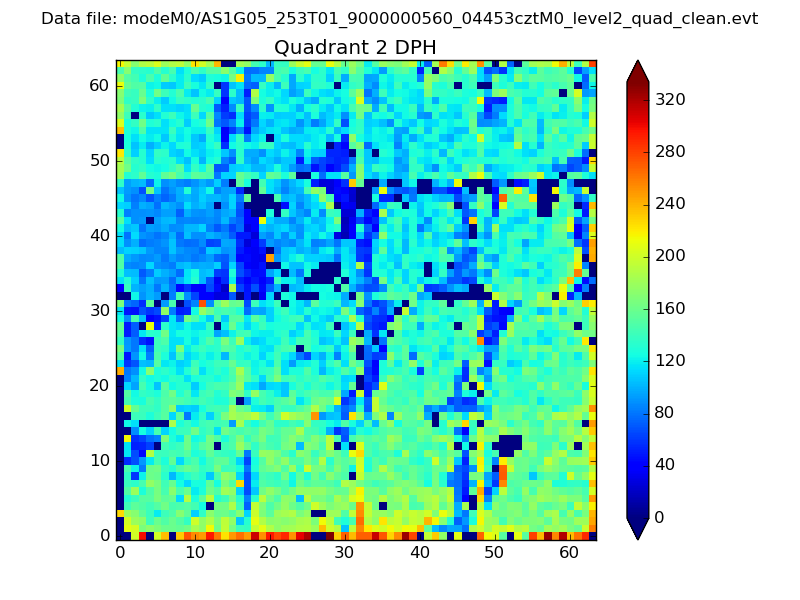 |
Quadrant C |
| Plot type | Count rate plots | Images |
|---|---|---|
| Comparison with Poisson distribution Blue bars denote a histogram of data divided into 1 sec bins. Red curve is a Poisson curve with rate = median count rate of data. |
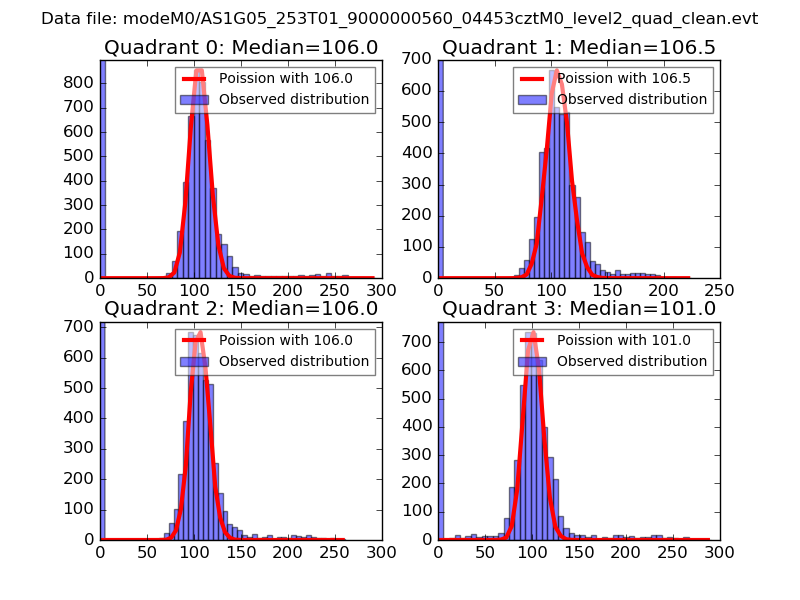 |
 |
| Quadrant-wise count rates Data is divided into 100 sec bins |
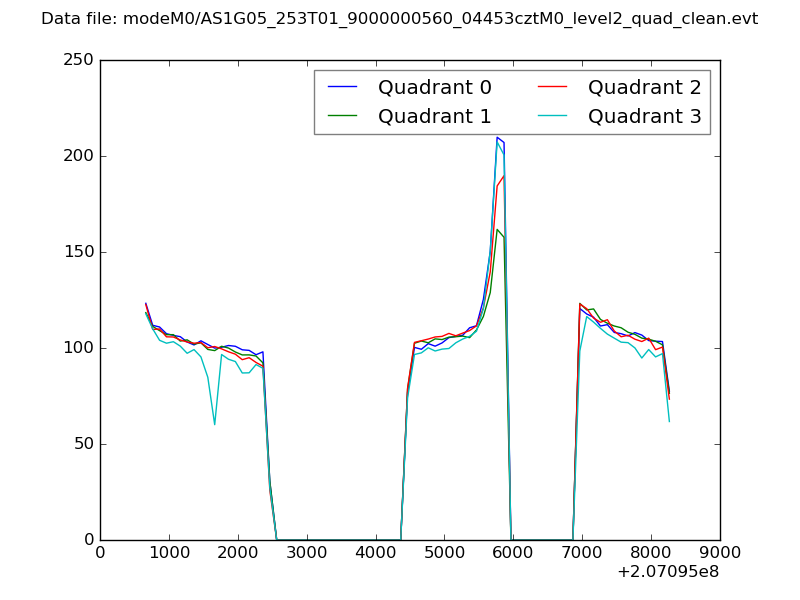 |
|
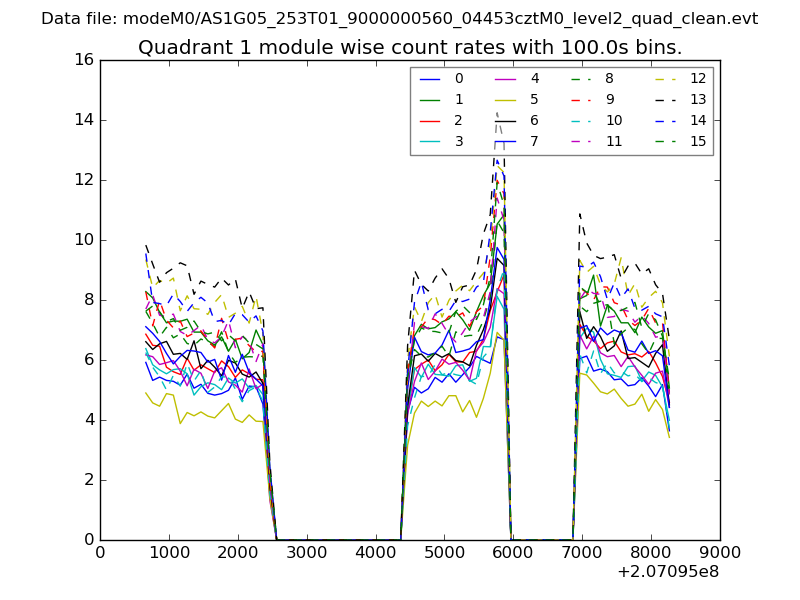
| Module-wise count rates for Quadrant A Data is divided into 100 sec bins |
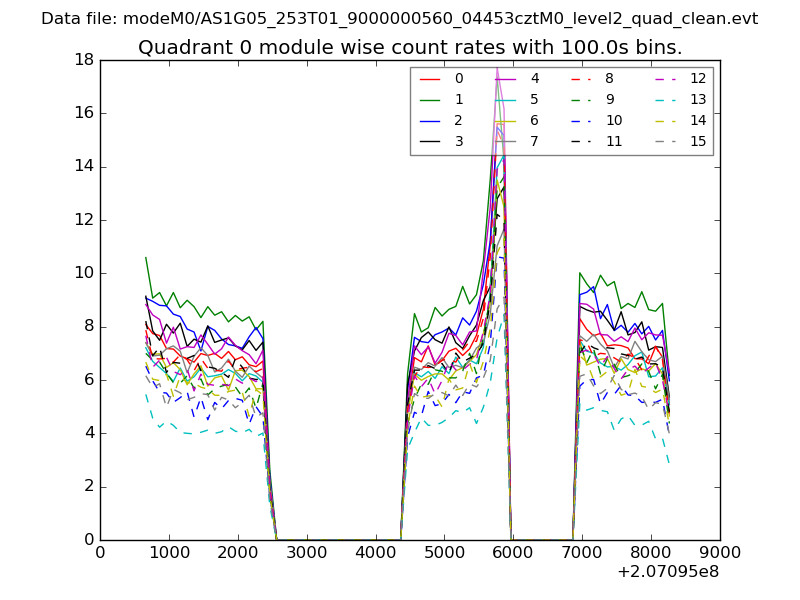 |
 |
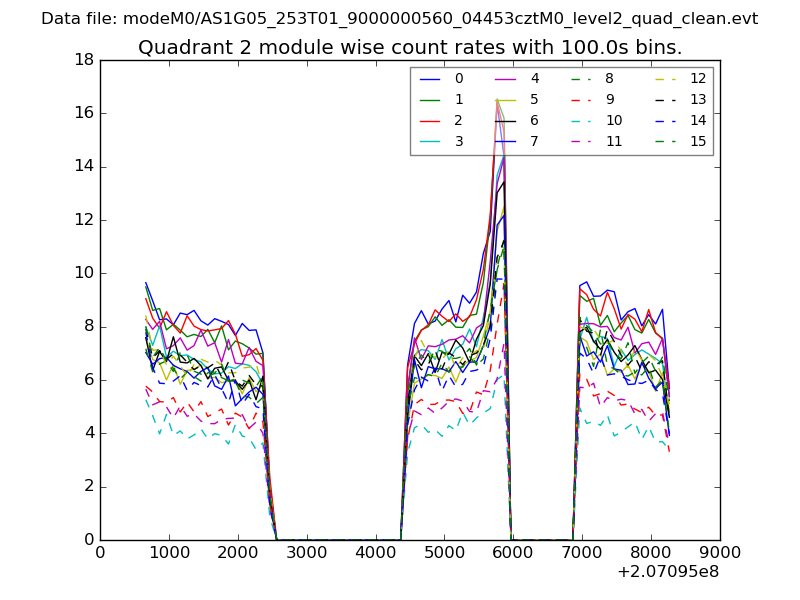
| Module-wise count rates for Quadrant B Data is divided into 100 sec bins |
 |
 |
| Module-wise count rates for Quadrant C Data is divided into 100 sec bins |
 |
 |
| Module-wise count rates for Quadrant D Data is divided into 100 sec bins |
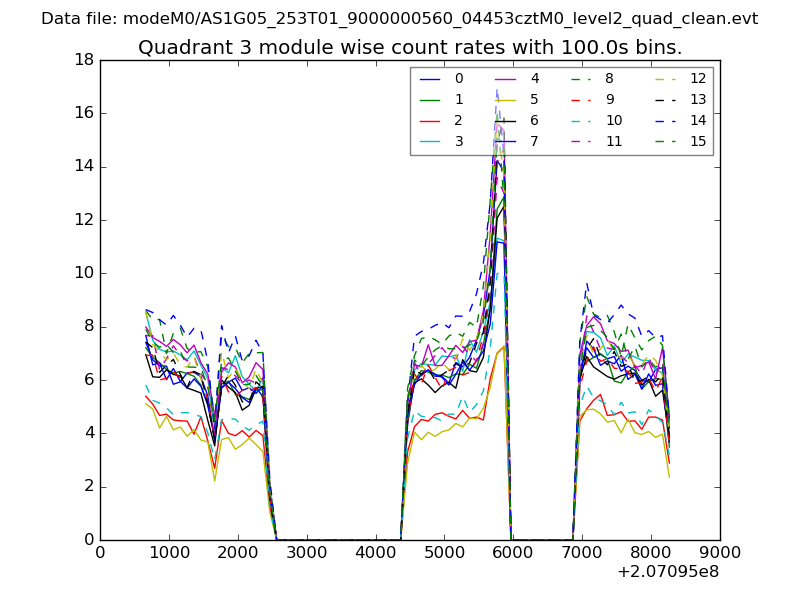 |
 |
| Parameter | Plot |
|---|---|
| CZT HV Monitor | 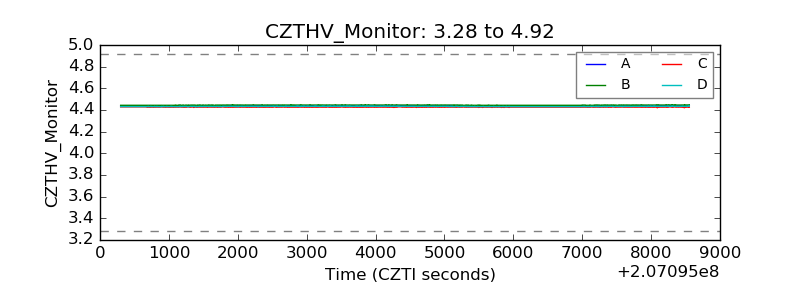 |
| D_VDD | 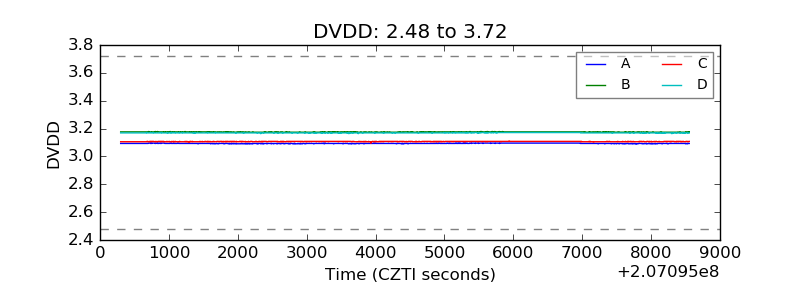 |
| Temperature 1 | 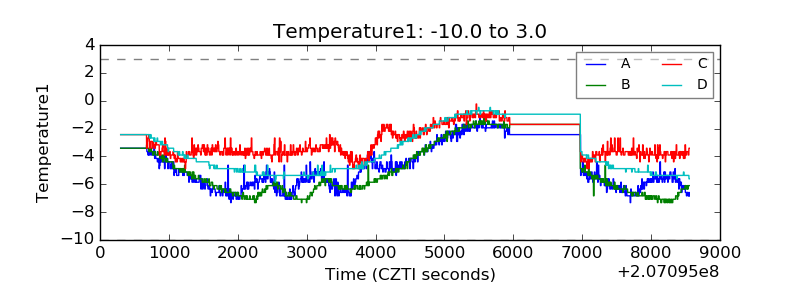 |
| Veto HV Monitor | 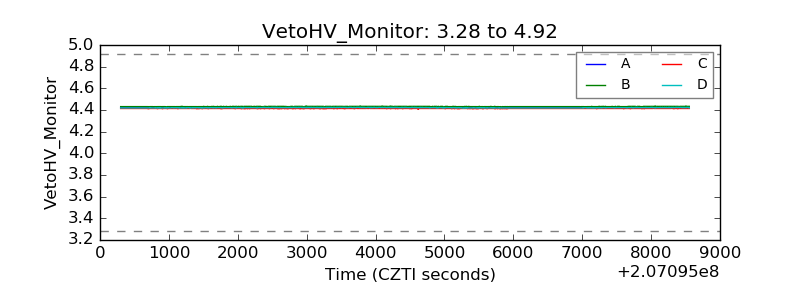 |
| Veto LLD | 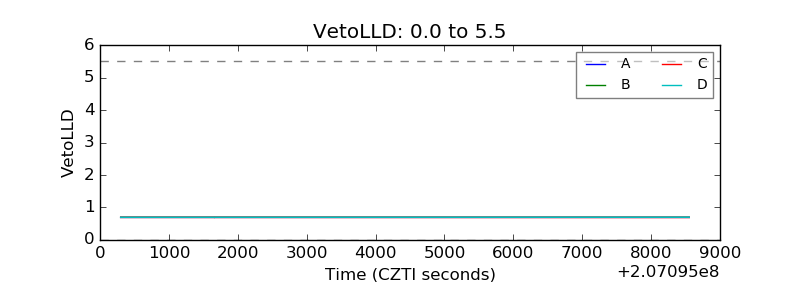 |
| Alpha Counter | 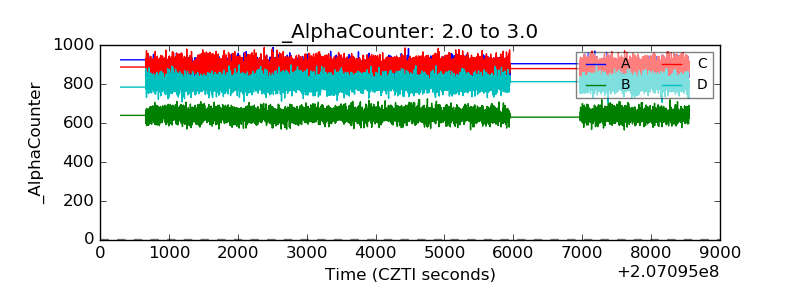 |
| _CPM_Rate | 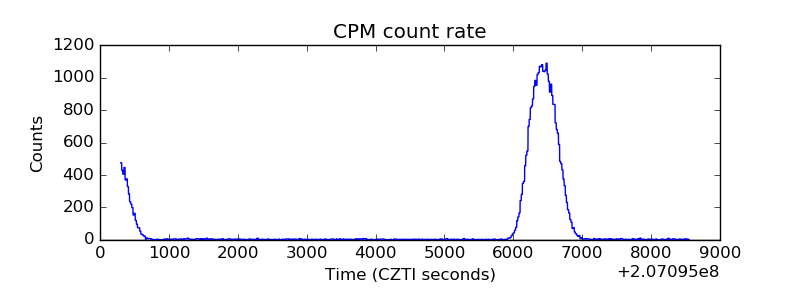 |
| CZT Counter | 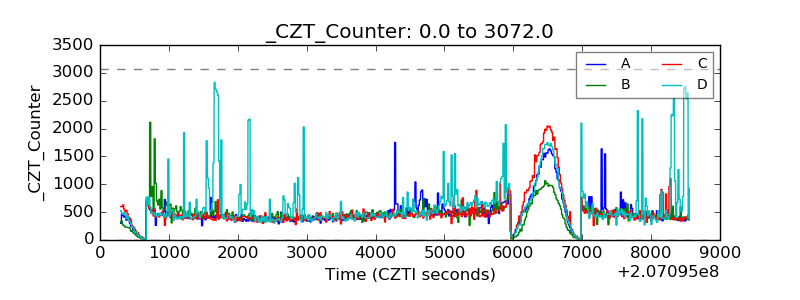 |
| +2.5 Volts monitor |  |
| +5 Volts monitor |  |
| _ROLL_ROT | 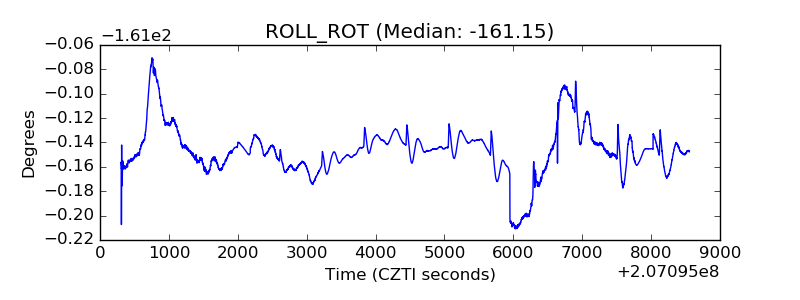 |
| _Roll_DEC | 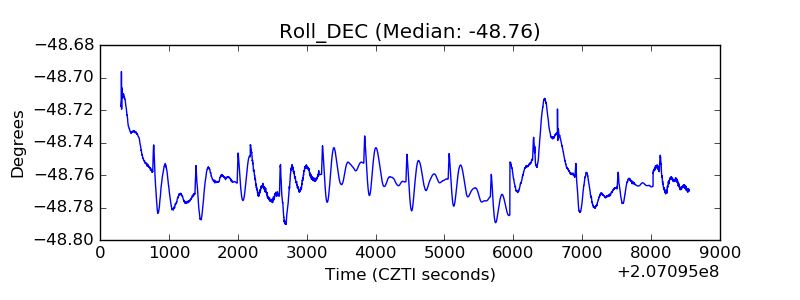 |
| _Roll_RA | 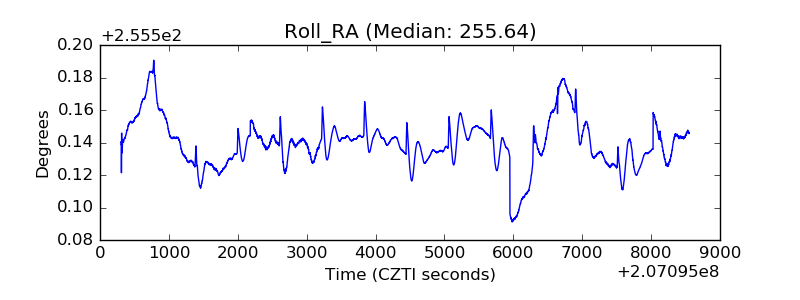 |
| Veto Counter | 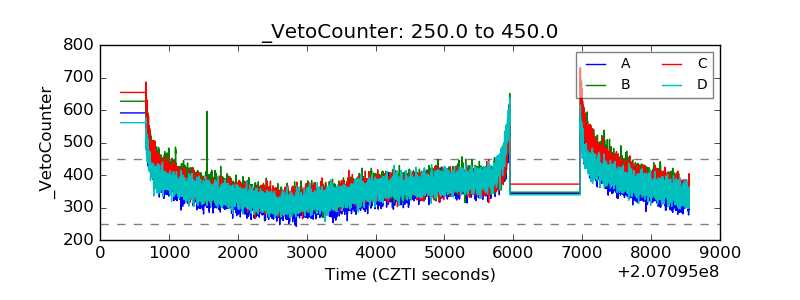 |