| Param | Original file | Final file |
|---|---|---|
| Filename | modeM0/AS1G05_253T01_9000000560_04455cztM0_level2.evt | modeM0/AS1G05_253T01_9000000560_04455cztM0_level2_quad_clean.evt |
| Size (bytes) | 2,467,388,160 | 410,575,680 |
| Size | 2.3 GB | 391.6 MB |
| Events in quadrant A | 16,838,777 | 2,521,136 |
| Events in quadrant B | 17,620,373 | 2,489,494 |
| Events in quadrant C | 16,445,068 | 2,506,429 |
| Events in quadrant D | 21,360,888 | 2,417,344 |
| Mode SS | |||
|---|---|---|---|
| Quadrant | BADHDUFLAG | Total packets | Discarded packets |
| A | 0 | 746 | 0 |
| B | 0 | 746 | 0 |
| C | 0 | 746 | 2 |
| D | 0 | 746 | 0 |
| Mode M9 | |||
|---|---|---|---|
| Quadrant | BADHDUFLAG | Total packets | Discarded packets |
| A | 0 | 42 | 0 |
| B | 0 | 42 | 0 |
| C | 0 | 42 | 0 |
| D | 0 | 42 | 0 |
| Mode M0 | |||
|---|---|---|---|
| Quadrant | BADHDUFLAG | Total packets | Discarded packets |
| A | 0 | 76374 | 60 |
| B | 0 | 77448 | 66 |
| C | 0 | 75442 | 49 |
| D | 0 | 91050 | 68 |
| Quadrant | Total seconds | Saturated seconds | Saturation percentage |
|---|---|---|---|
| A | 36396 | 387 | 1.063304% |
| B | 36395 | 380 | 1.044099% |
| C | 36402 | 206 | 0.565903% |
| D | 36393 | 1768 | 4.858077% |
Noise dominated data is calculated using 1-second bins in cleaned event files. If a bin has >2000 counts, and if more than 50% of those come from <1% of pixels, then it is considered to be noise-dominated and hence unusable.
| Quadrant | # 1 sec bins | Bins with >0 counts | Bins with >2000 counts | High rate bins dominated by noise | Noise dominated (total time) | Noise dominated (detector-on time) | Marked lightcurve |
|---|---|---|---|---|---|---|---|
| A | 51312 | 36430 | 42 | 42 | 0.08% | 0.12% | 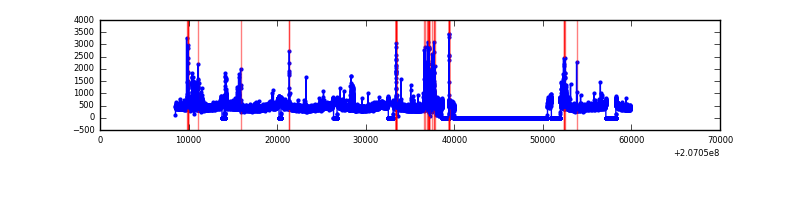 |
| B | 51312 | 36431 | 26 | 26 | 0.05% | 0.07% | 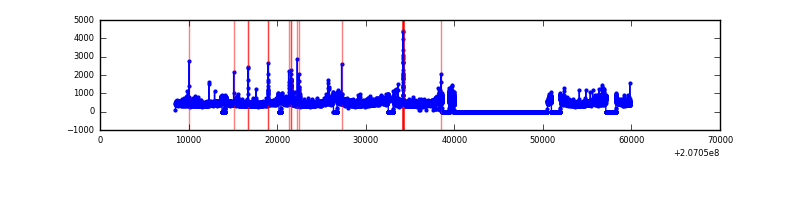 |
| C | 51312 | 36431 | 40 | 40 | 0.08% | 0.11% | 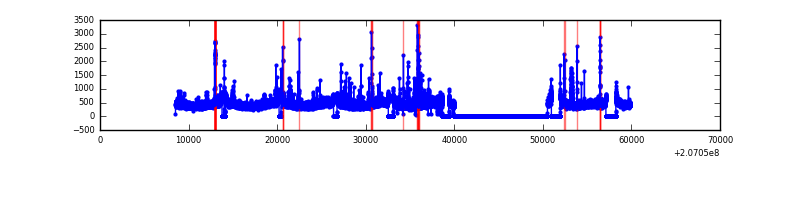 |
| D | 51312 | 36430 | 1412 | 1412 | 2.75% | 3.88% | 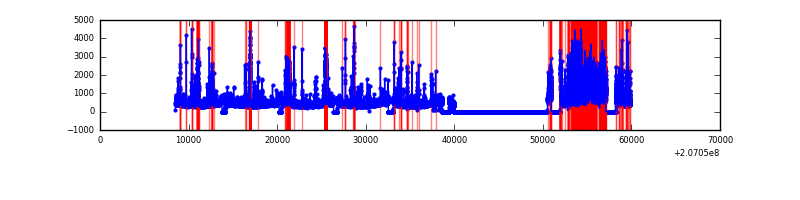 |
Top three noisy pixels from each quadrant. If the there are fewer than three noisy pixels in the level2.evt file, extra rows are filled as -1
| Pixel properties | Quadrant properties | ||||||
|---|---|---|---|---|---|---|---|
| Quadrant | DetID | PixID | Counts | Sigma | Mean | Median | Sigma |
| A | 0 | 13 | 396816 | 469.63 | 4141 | 4059 | 836.3 |
| A | 15 | 47 | 136127 | 157.92 | 4141 | 4059 | 836.3 |
| A | 0 | 118 | 130154 | 150.78 | 4141 | 4059 | 836.3 |
| B | 15 | 204 | 600874 | 748.2 | 4195 | 4098 | 797.6 |
| B | 15 | 185 | 389936 | 483.74 | 4195 | 4098 | 797.6 |
| B | 4 | 48 | 94568 | 113.42 | 4195 | 4098 | 797.6 |
| C | 14 | 48 | 291854 | 310.2 | 4029 | 4053 | 927.8 |
| C | 9 | 16 | 234956 | 248.87 | 4029 | 4053 | 927.8 |
| C | 9 | 247 | 99795 | 103.19 | 4029 | 4053 | 927.8 |
| D | 12 | 233 | 3938358 | 4145.31 | 3951 | 3831 | 949.2 |
| D | 12 | 227 | 431710 | 450.8 | 3951 | 3831 | 949.2 |
| D | 13 | 239 | 304193 | 316.45 | 3951 | 3831 | 949.2 |
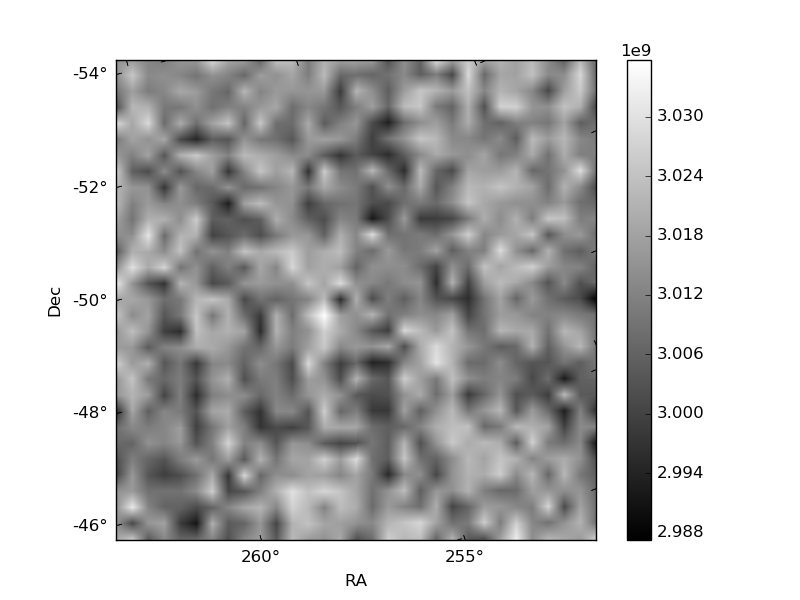
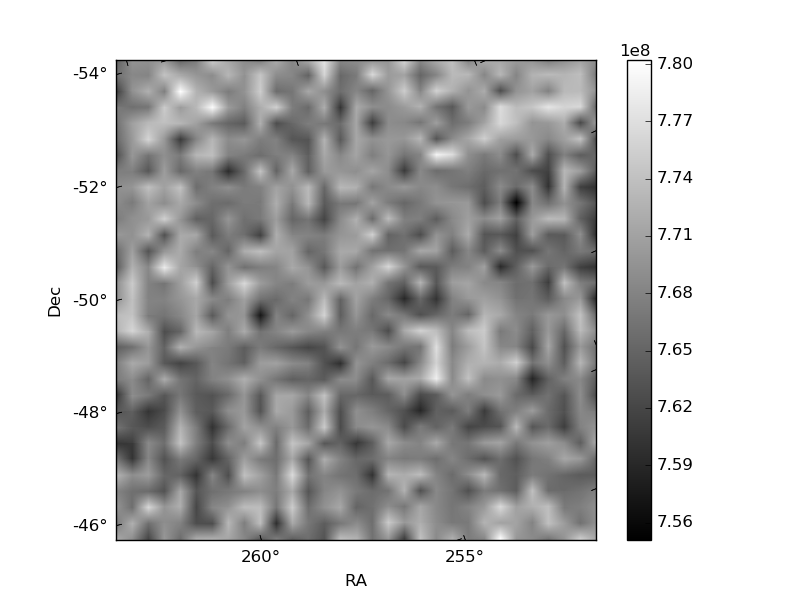
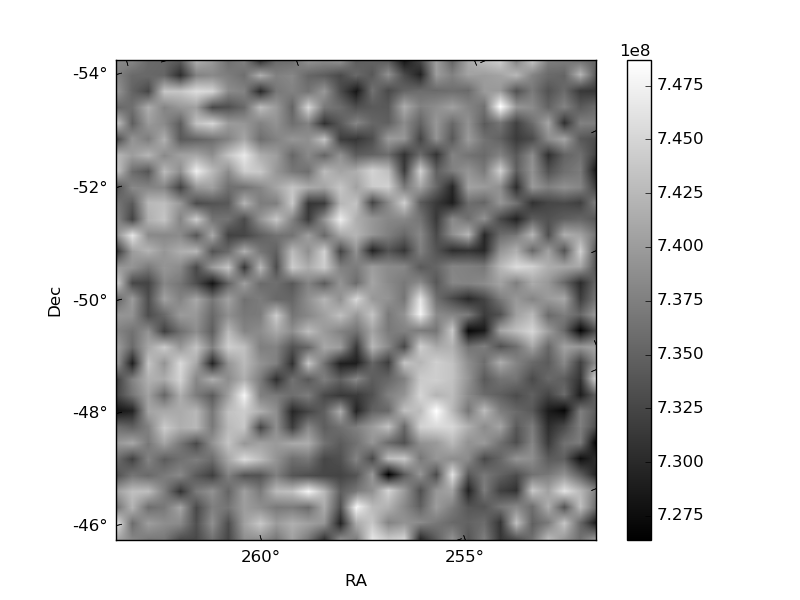
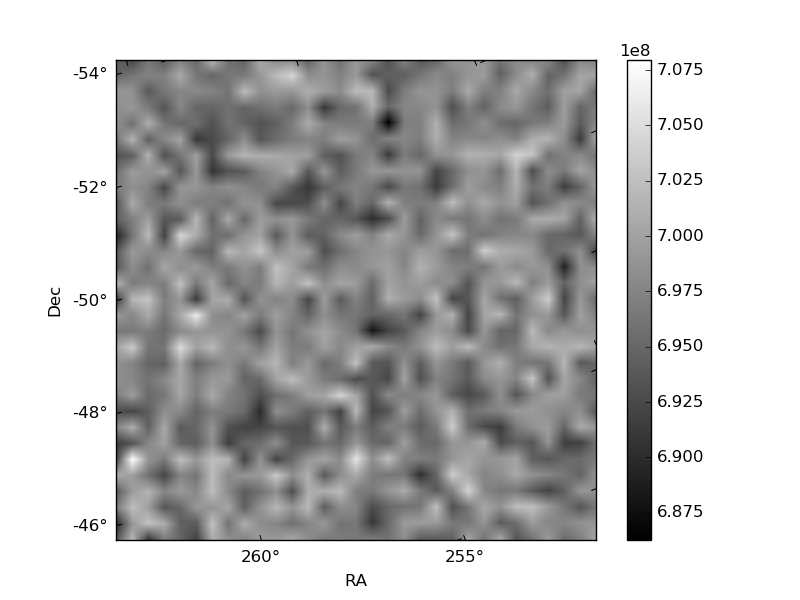
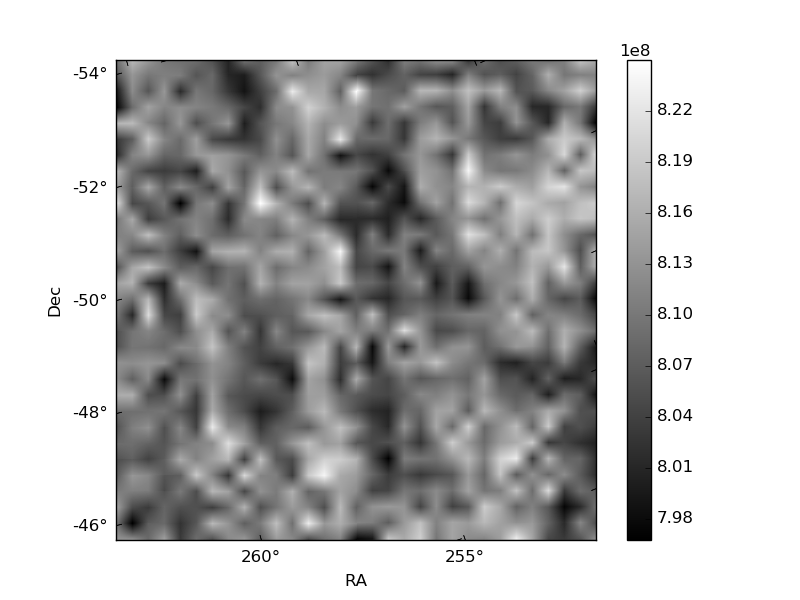
Histogram calculated using DETX and DETY for each event in the final _common_clean file
| Quadrant A | 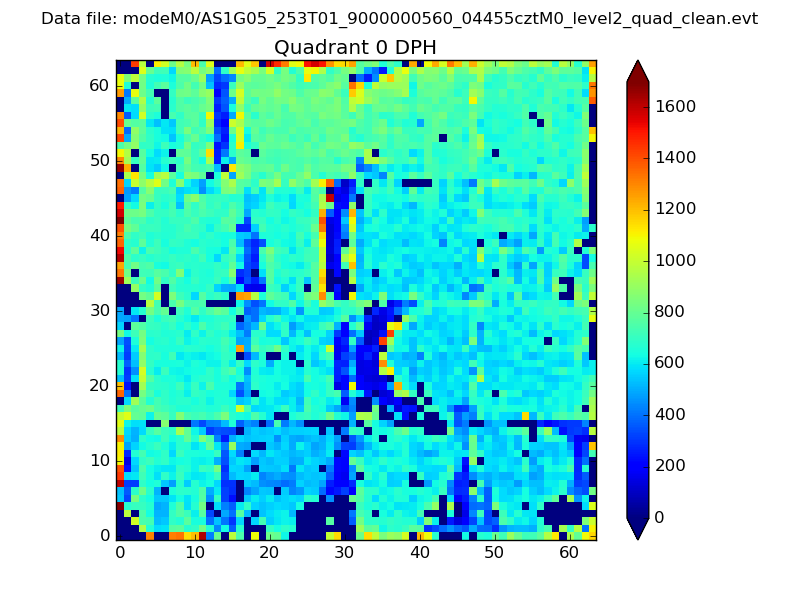 |
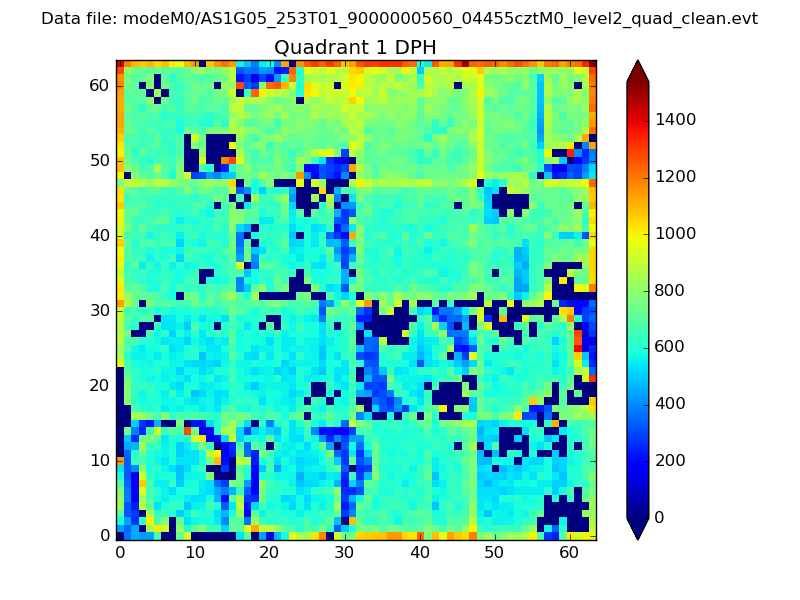 |
Quadrant B |
|---|---|---|---|
| Quadrant D | 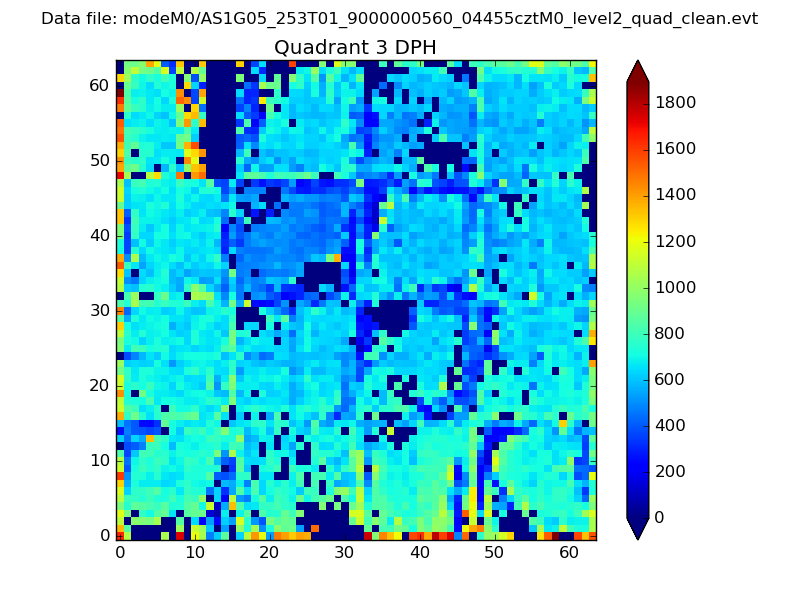 |
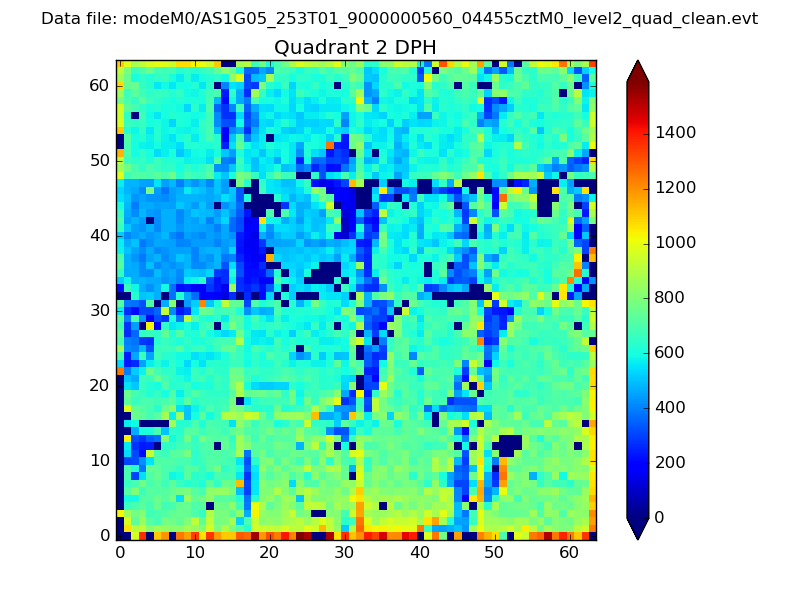 |
Quadrant C |
| Plot type | Count rate plots | Images |
|---|---|---|
| Comparison with Poisson distribution Blue bars denote a histogram of data divided into 1 sec bins. Red curve is a Poisson curve with rate = median count rate of data. |
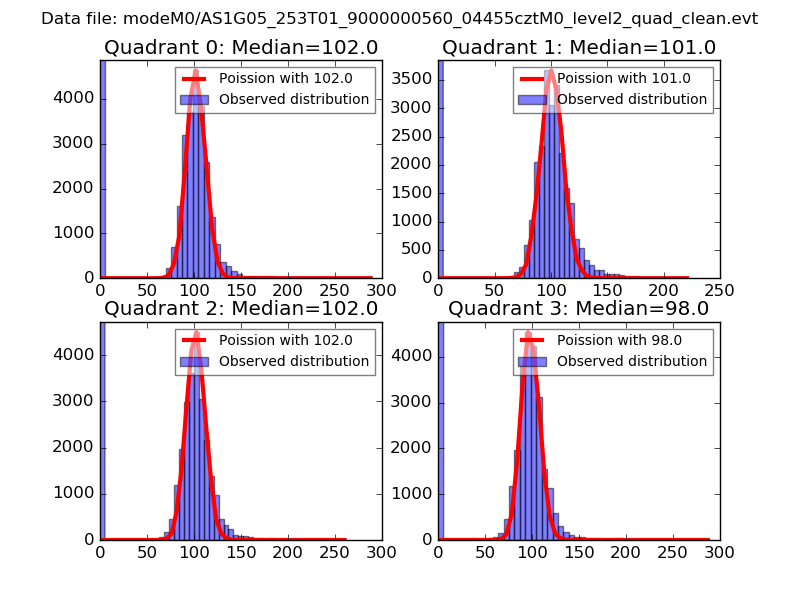 |
 |
| Quadrant-wise count rates Data is divided into 100 sec bins |
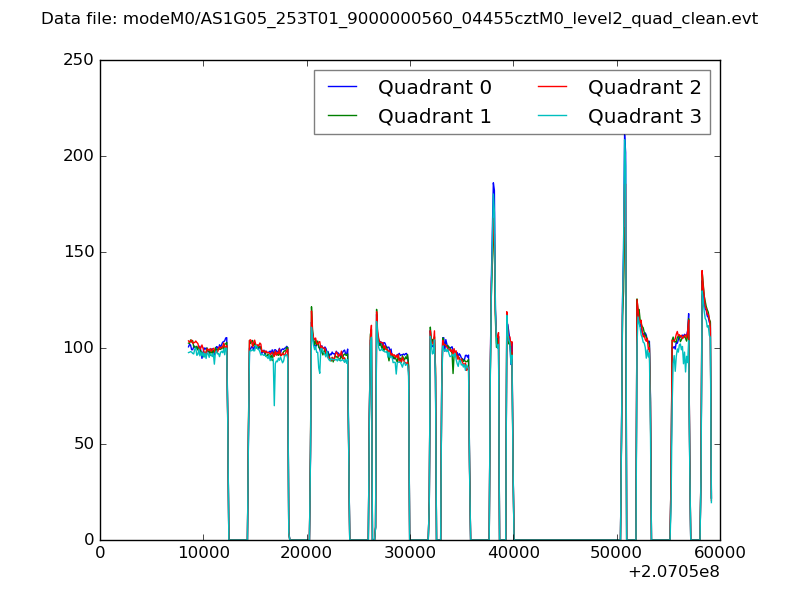 |
|
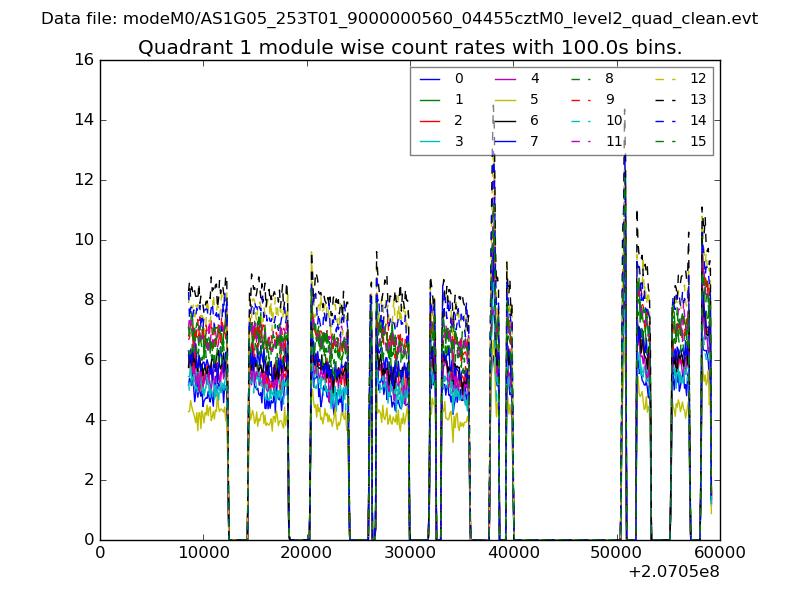
| Module-wise count rates for Quadrant A Data is divided into 100 sec bins |
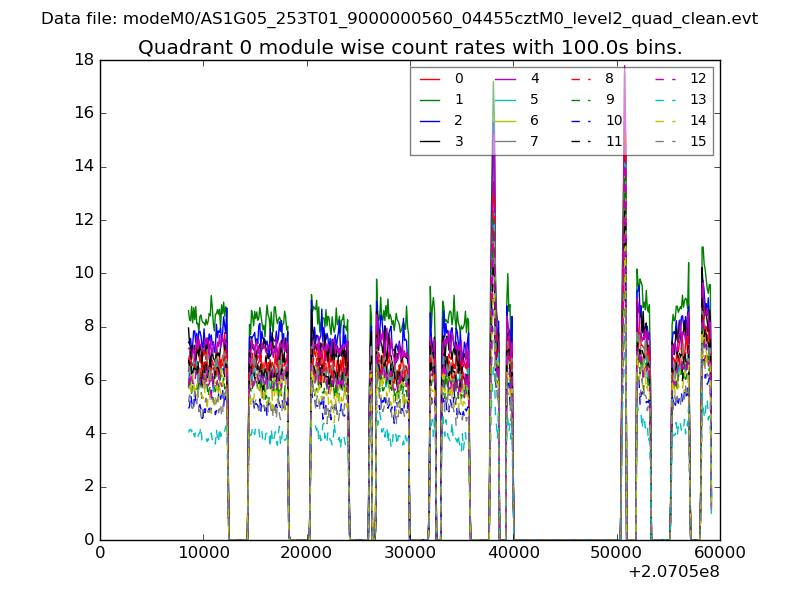 |
 |
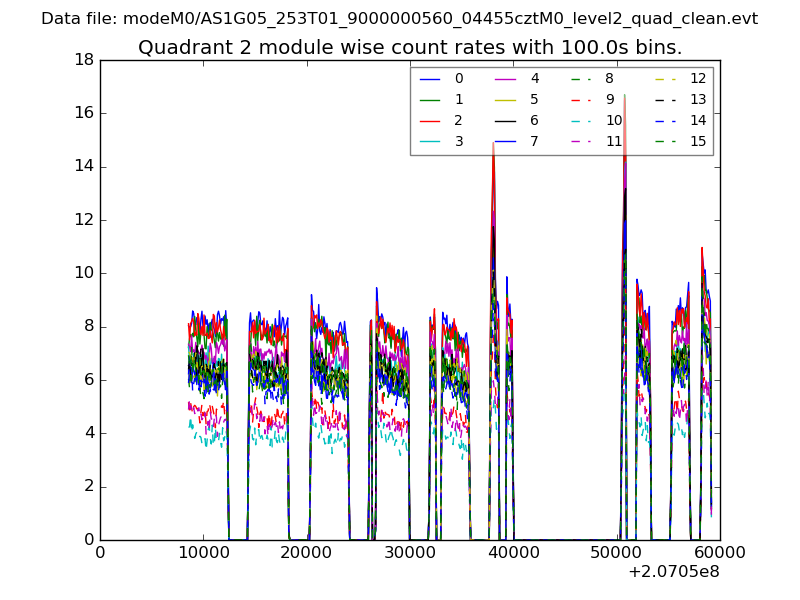
| Module-wise count rates for Quadrant B Data is divided into 100 sec bins |
 |
 |
| Module-wise count rates for Quadrant C Data is divided into 100 sec bins |
 |
 |
| Module-wise count rates for Quadrant D Data is divided into 100 sec bins |
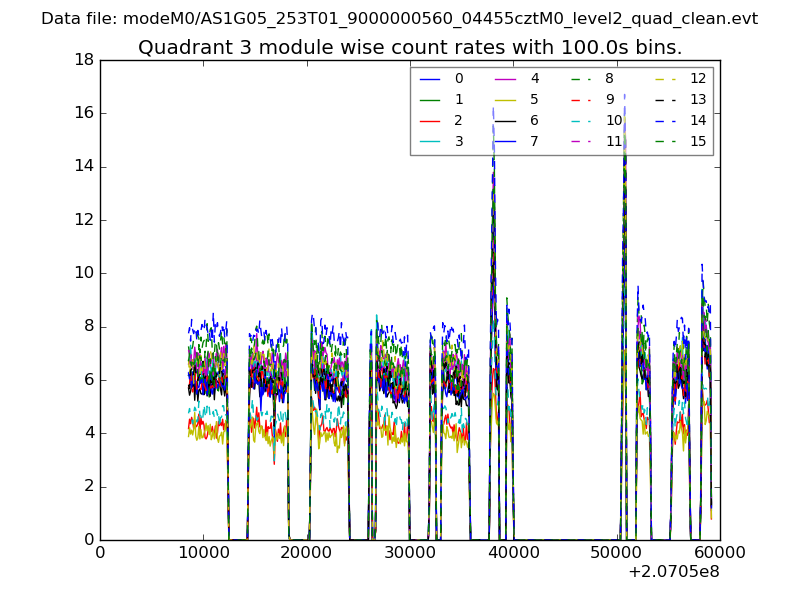 |
 |
| Parameter | Plot |
|---|---|
| CZT HV Monitor | 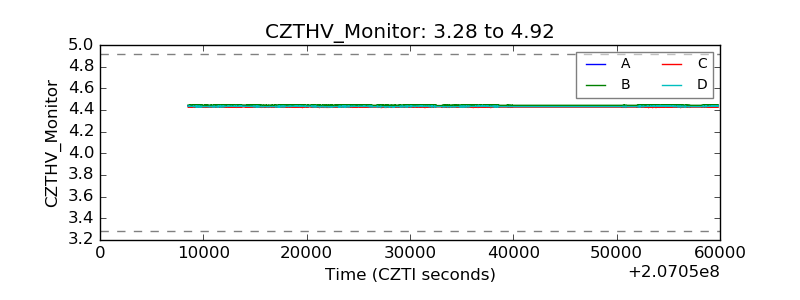 |
| D_VDD | 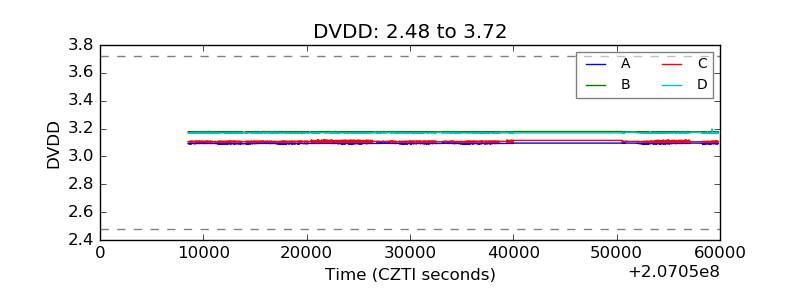 |
| Temperature 1 | 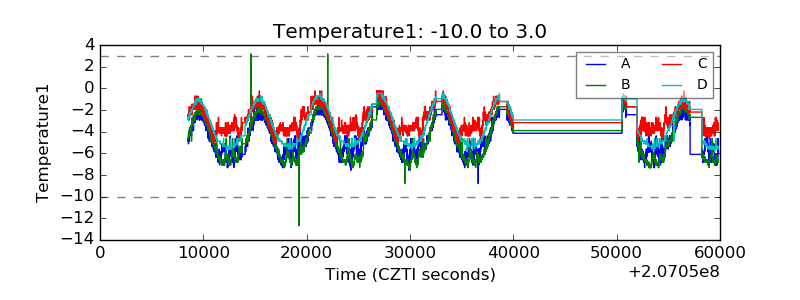 |
| Veto HV Monitor | 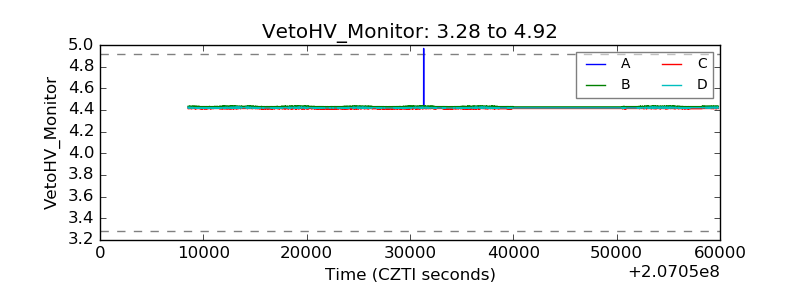 |
| Veto LLD | 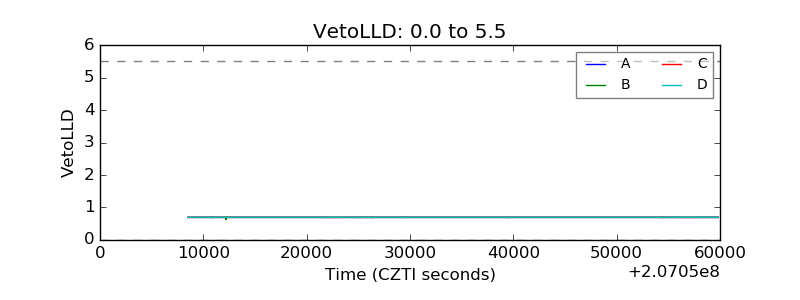 |
| Alpha Counter | 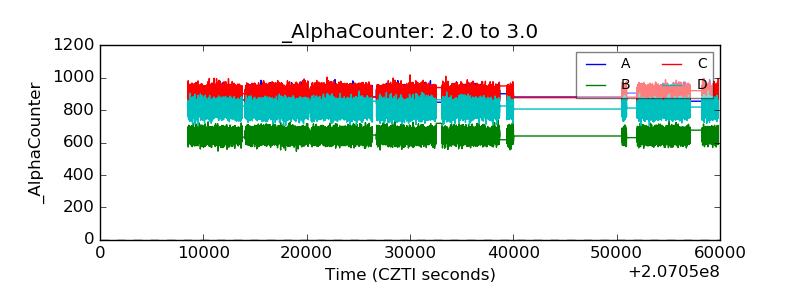 |
| _CPM_Rate | 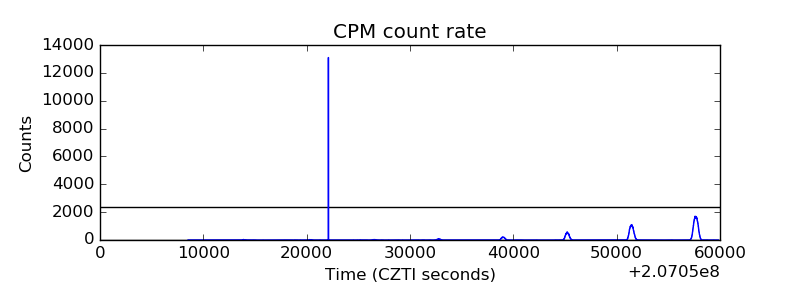 |
| CZT Counter | 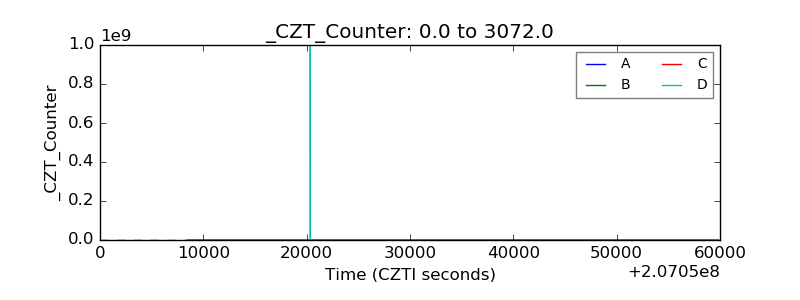 |
| +2.5 Volts monitor | 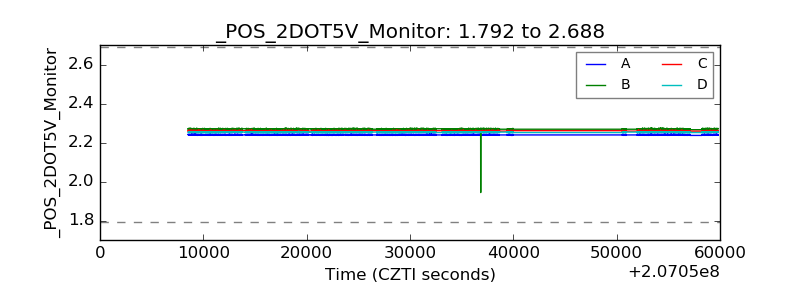 |
| +5 Volts monitor | 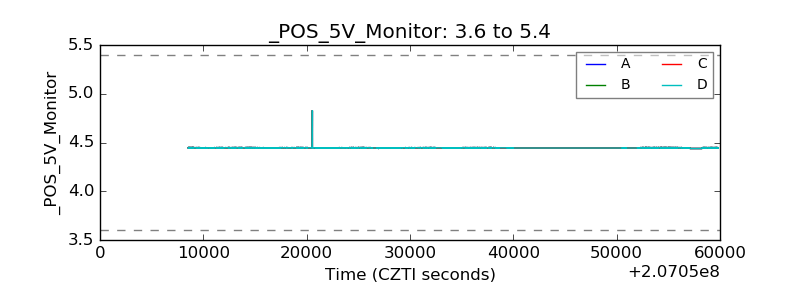 |
| _ROLL_ROT | 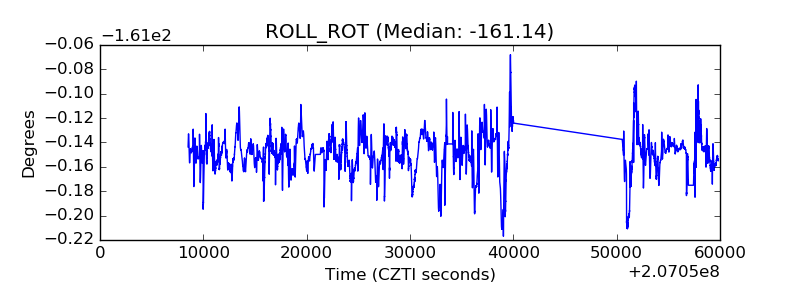 |
| _Roll_DEC | 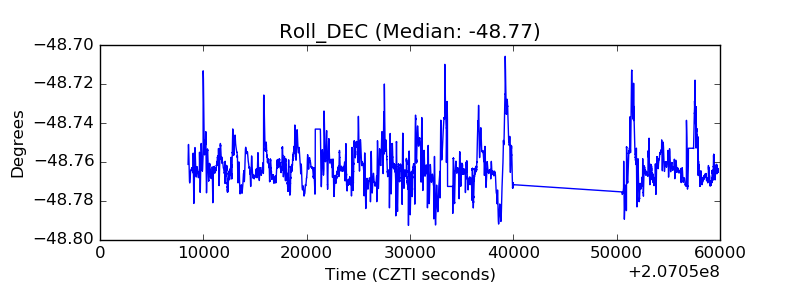 |
| _Roll_RA | 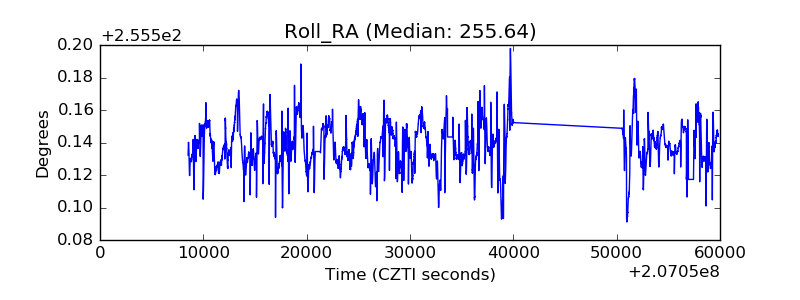 |
| Veto Counter | 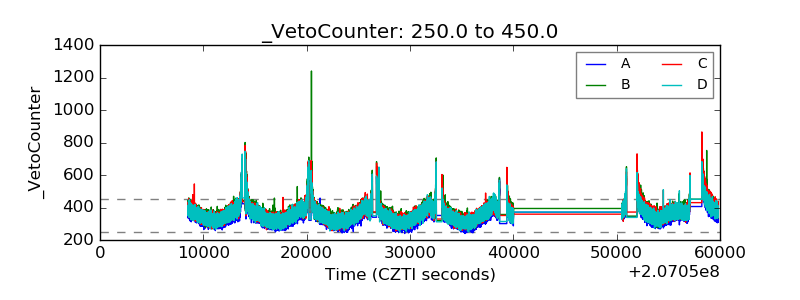 |