| Param | Original file | Final file |
|---|---|---|
| Filename | modeM0/AS1G05_253T01_9000000560_04456cztM0_level2.evt | modeM0/AS1G05_253T01_9000000560_04456cztM0_level2_quad_clean.evt |
| Size (bytes) | 453,562,560 | 67,213,440 |
| Size | 432.6 MB | 64.1 MB |
| Events in quadrant A | 2,915,830 | 400,979 |
| Events in quadrant B | 3,118,629 | 403,298 |
| Events in quadrant C | 2,969,997 | 405,008 |
| Events in quadrant D | 4,297,073 | 379,547 |
| Mode SS | |||
|---|---|---|---|
| Quadrant | BADHDUFLAG | Total packets | Discarded packets |
| A | 0 | 128 | 0 |
| B | 0 | 128 | 0 |
| C | 0 | 128 | 0 |
| D | 0 | 128 | 0 |
| Mode M9 | |||
|---|---|---|---|
| Quadrant | BADHDUFLAG | Total packets | Discarded packets |
| A | 0 | 13 | 0 |
| B | 0 | 13 | 0 |
| C | 0 | 13 | 0 |
| D | 0 | 13 | 0 |
| Mode M0 | |||
|---|---|---|---|
| Quadrant | BADHDUFLAG | Total packets | Discarded packets |
| A | 0 | 12986 | 2 |
| B | 0 | 13250 | 1 |
| C | 0 | 13073 | 1 |
| D | 0 | 17188 | 1 |
| Quadrant | Total seconds | Saturated seconds | Saturation percentage |
|---|---|---|---|
| A | 6400 | 18 | 0.281250% |
| B | 6400 | 25 | 0.390625% |
| C | 6400 | 20 | 0.312500% |
| D | 6400 | 297 | 4.640625% |
Noise dominated data is calculated using 1-second bins in cleaned event files. If a bin has >2000 counts, and if more than 50% of those come from <1% of pixels, then it is considered to be noise-dominated and hence unusable.
| Quadrant | # 1 sec bins | Bins with >0 counts | Bins with >2000 counts | High rate bins dominated by noise | Noise dominated (total time) | Noise dominated (detector-on time) | Marked lightcurve |
|---|---|---|---|---|---|---|---|
| A | 7640 | 6401 | 0 | 0 | 0.00% | 0.00% | 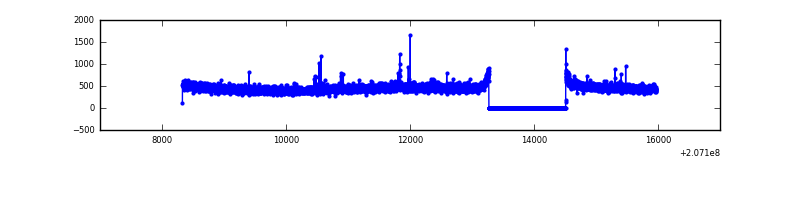 |
| B | 7640 | 6401 | 2 | 2 | 0.03% | 0.03% | 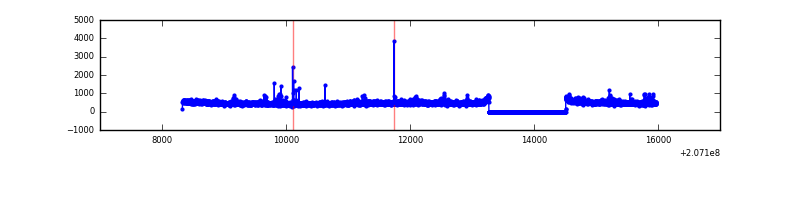 |
| C | 7640 | 6401 | 0 | 0 | 0.00% | 0.00% | 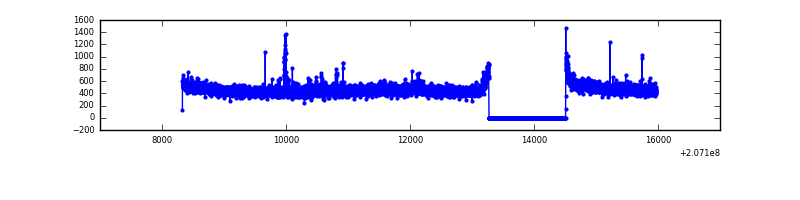 |
| D | 7640 | 6401 | 266 | 266 | 3.48% | 4.16% | 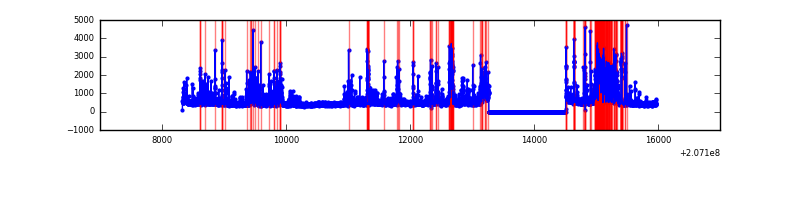 |
Top three noisy pixels from each quadrant. If the there are fewer than three noisy pixels in the level2.evt file, extra rows are filled as -1
| Pixel properties | Quadrant properties | ||||||
|---|---|---|---|---|---|---|---|
| Quadrant | DetID | PixID | Counts | Sigma | Mean | Median | Sigma |
| A | 0 | 13 | 16582 | 105.0 | 750 | 733 | 150.9 |
| A | 0 | 226 | 7745 | 46.45 | 750 | 733 | 150.9 |
| A | 12 | 194 | 7441 | 44.44 | 750 | 733 | 150.9 |
| B | 15 | 204 | 64088 | 440.93 | 765 | 747 | 143.7 |
| B | 4 | 48 | 52952 | 363.41 | 765 | 747 | 143.7 |
| B | 4 | 170 | 19155 | 128.14 | 765 | 747 | 143.7 |
| C | 14 | 48 | 42203 | 243.96 | 741 | 745 | 169.9 |
| C | 9 | 54 | 16641 | 93.54 | 741 | 745 | 169.9 |
| C | 9 | 247 | 16178 | 90.82 | 741 | 745 | 169.9 |
| D | 12 | 227 | 823305 | 4736.37 | 716 | 694 | 173.7 |
| D | 2 | 63 | 170895 | 979.97 | 716 | 694 | 173.7 |
| D | 13 | 235 | 153926 | 882.27 | 716 | 694 | 173.7 |
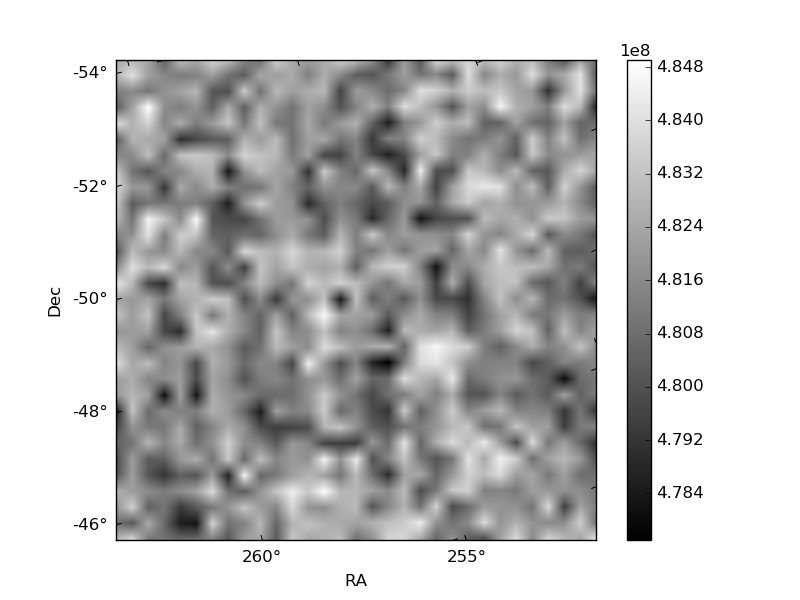
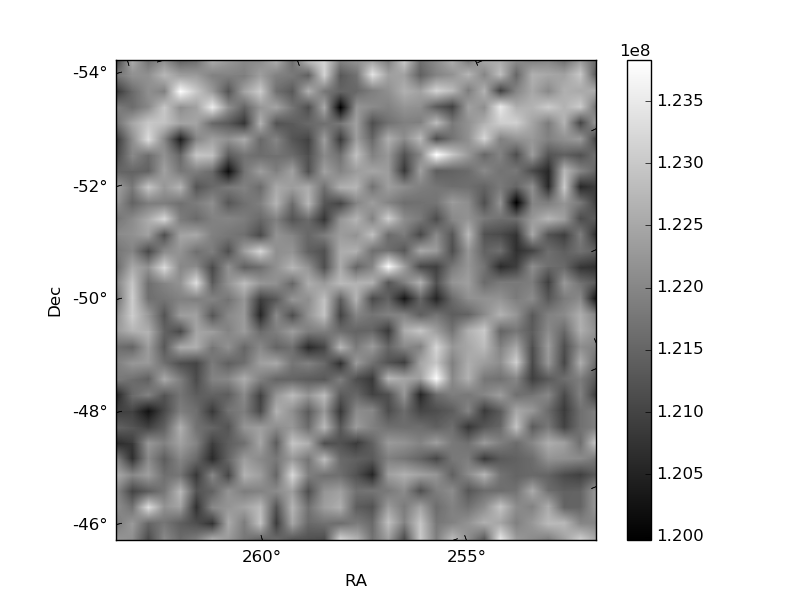
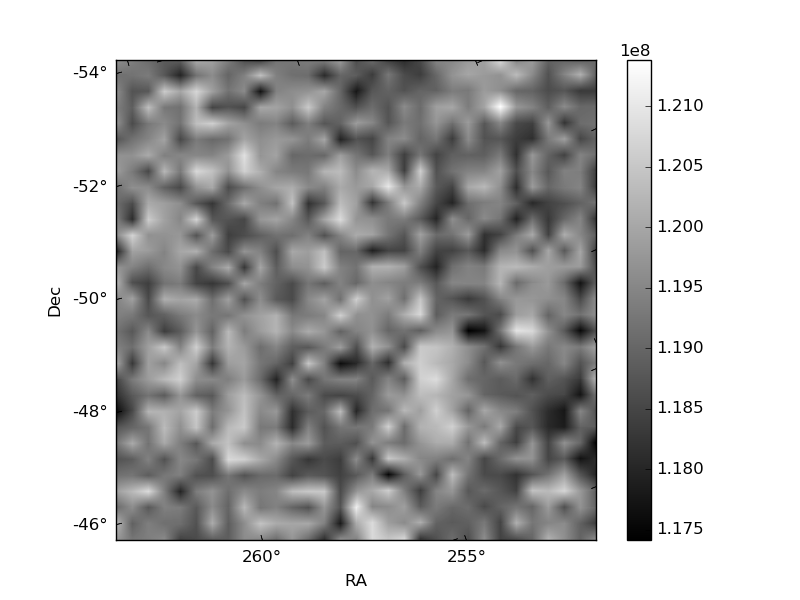
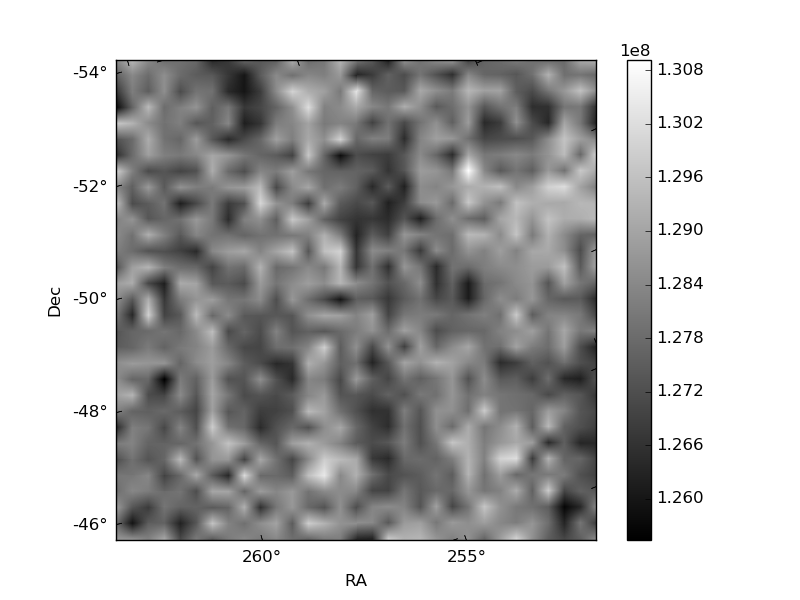
Histogram calculated using DETX and DETY for each event in the final _common_clean file
| Quadrant A | 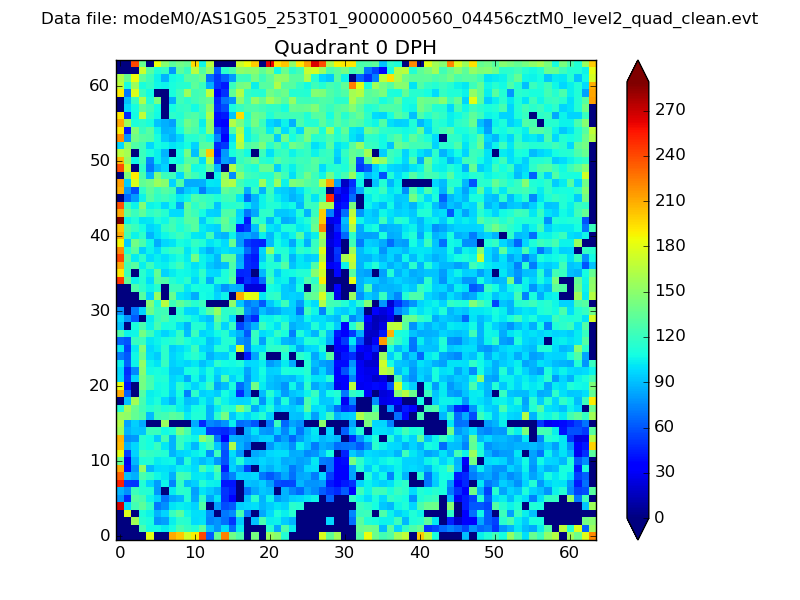 |
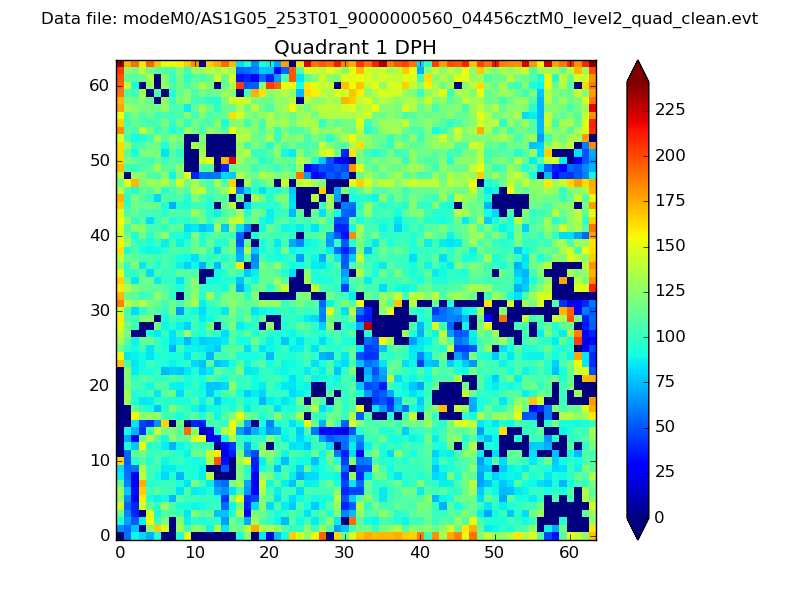 |
Quadrant B |
|---|---|---|---|
| Quadrant D | 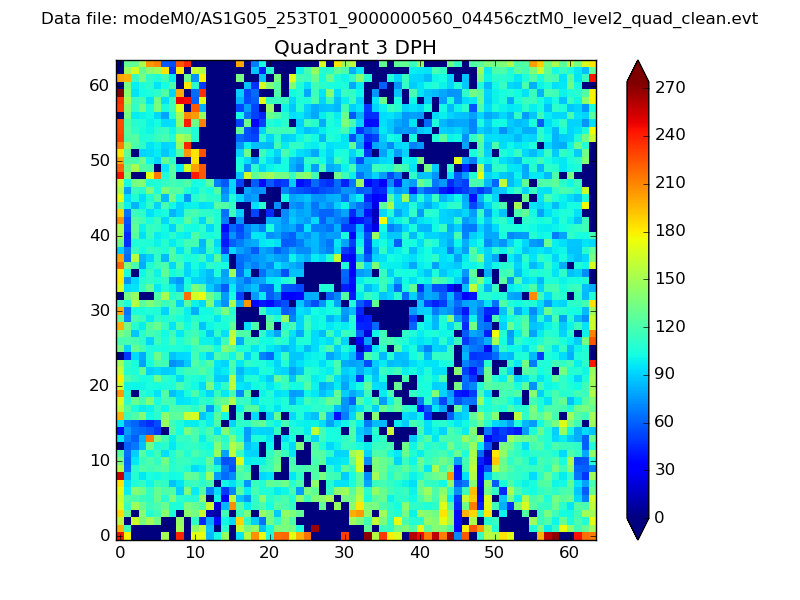 |
 |
Quadrant C |
| Plot type | Count rate plots | Images |
|---|---|---|
| Comparison with Poisson distribution Blue bars denote a histogram of data divided into 1 sec bins. Red curve is a Poisson curve with rate = median count rate of data. |
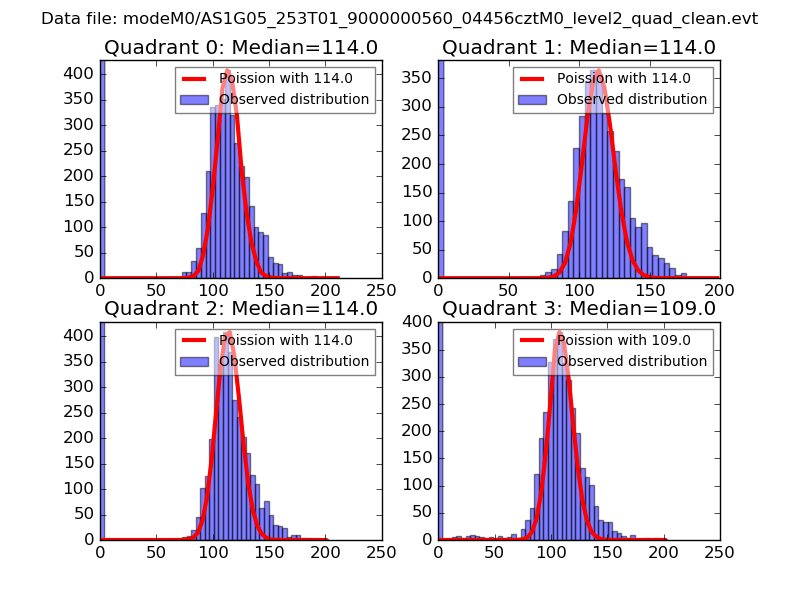 |
 |
| Quadrant-wise count rates Data is divided into 100 sec bins |
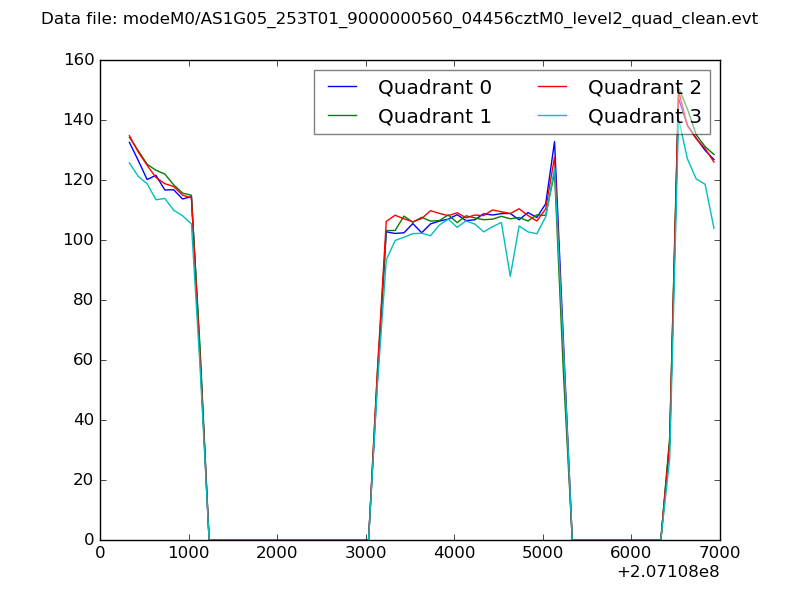 |
|
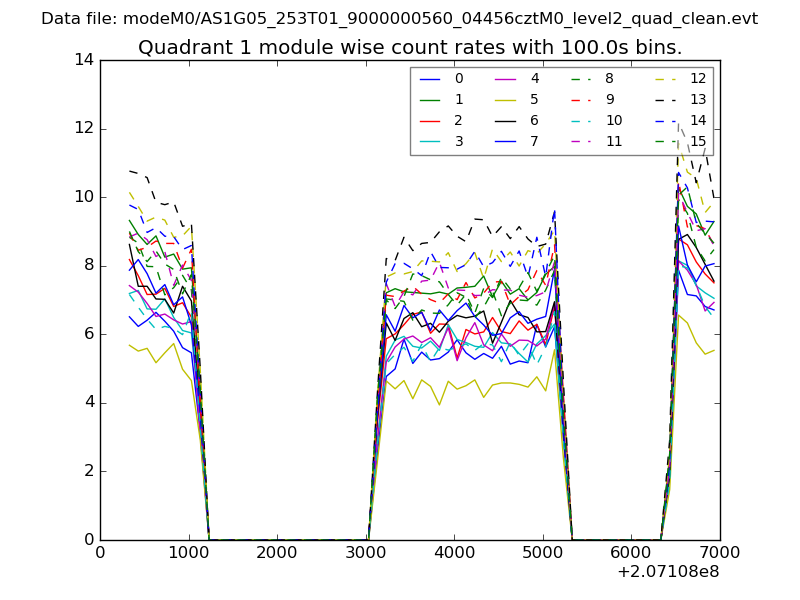
| Module-wise count rates for Quadrant A Data is divided into 100 sec bins |
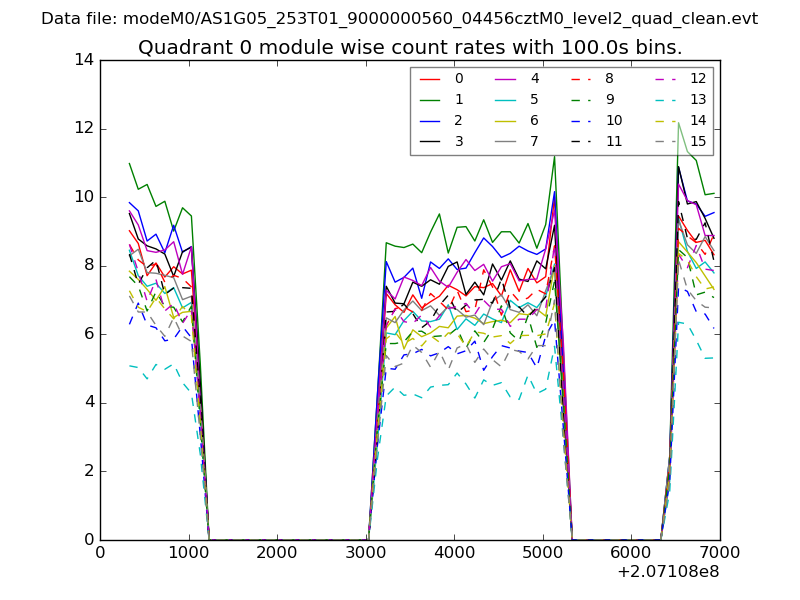 |
 |
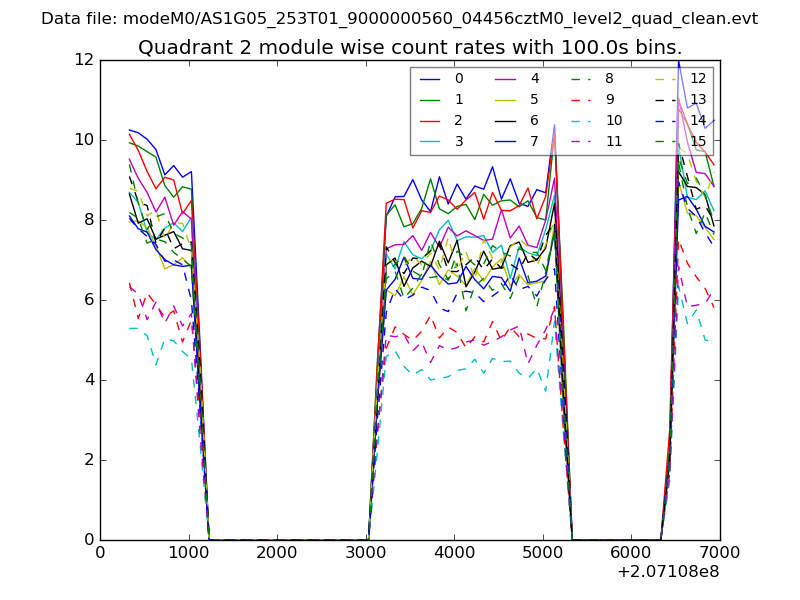
| Module-wise count rates for Quadrant B Data is divided into 100 sec bins |
 |
 |
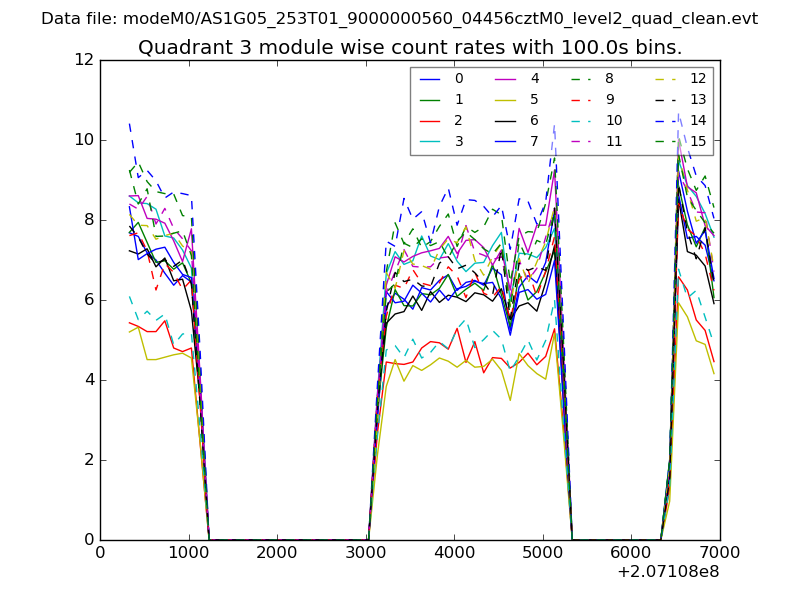
| Module-wise count rates for Quadrant C Data is divided into 100 sec bins |
 |
 |
| Module-wise count rates for Quadrant D Data is divided into 100 sec bins |
 |
 |
| Parameter | Plot |
|---|---|
| CZT HV Monitor | 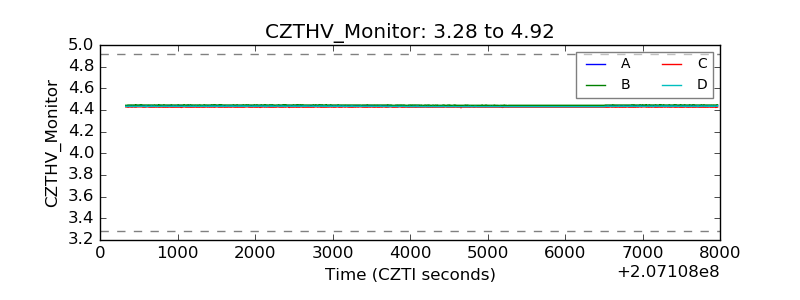 |
| D_VDD | 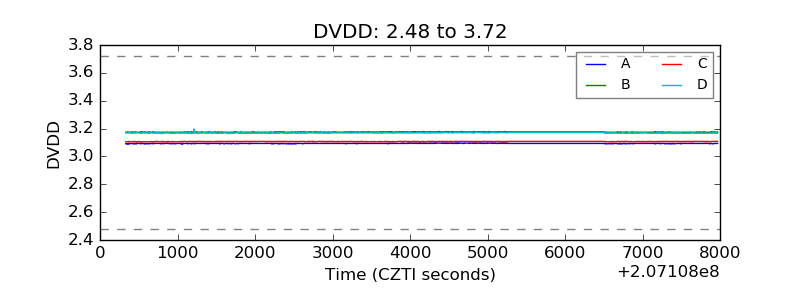 |
| Temperature 1 | 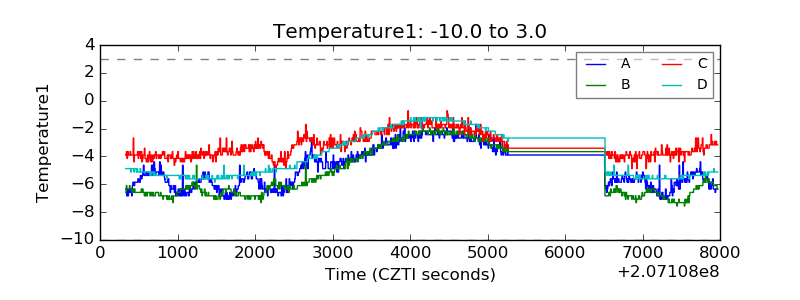 |
| Veto HV Monitor | 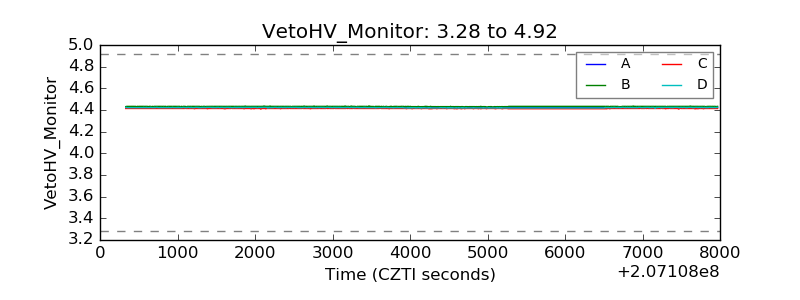 |
| Veto LLD | 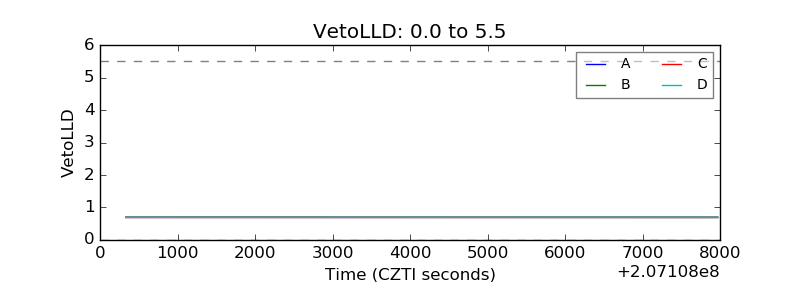 |
| Alpha Counter | 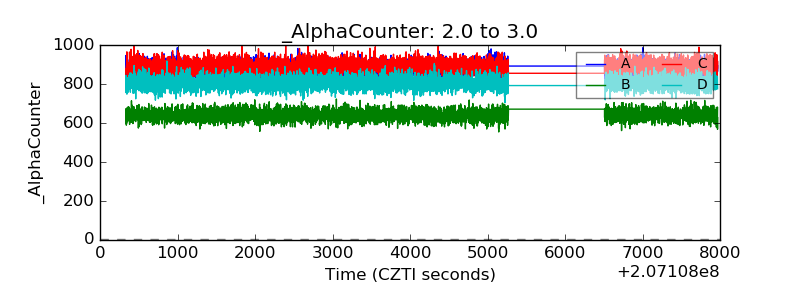 |
| _CPM_Rate | 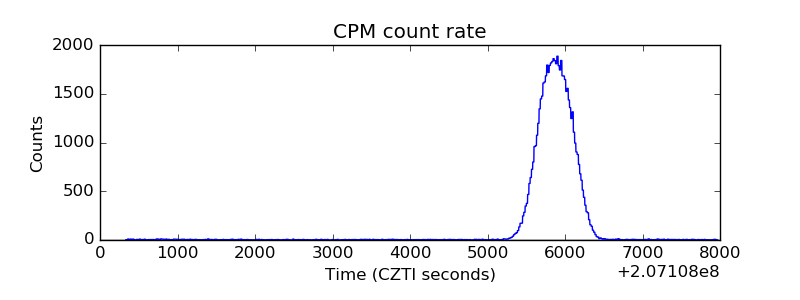 |
| CZT Counter | 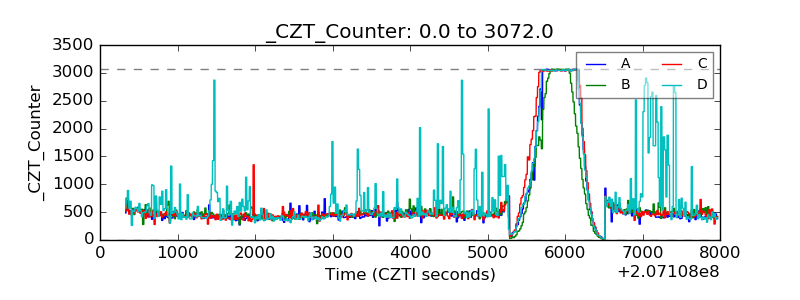 |
| +2.5 Volts monitor |  |
| +5 Volts monitor |  |
| _ROLL_ROT | 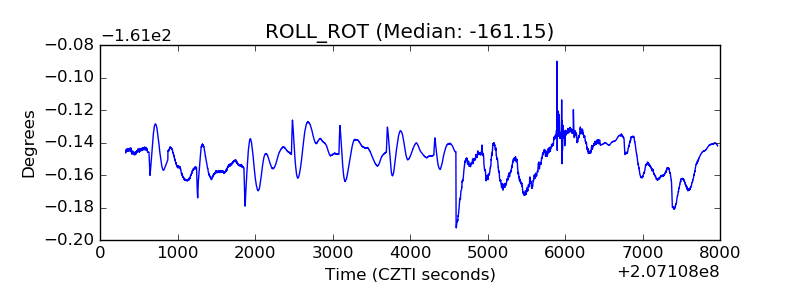 |
| _Roll_DEC | 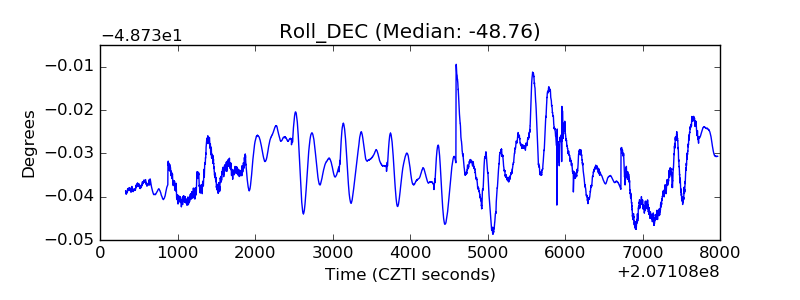 |
| _Roll_RA | 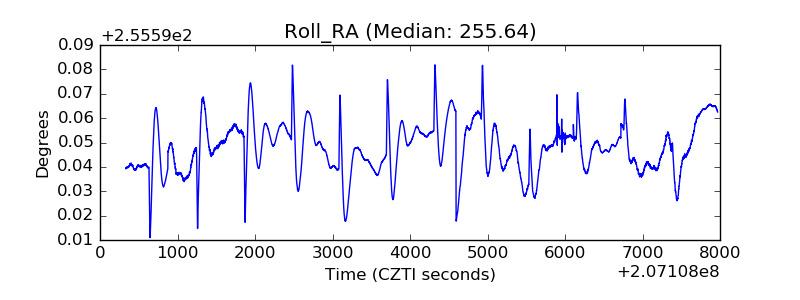 |
| Veto Counter | 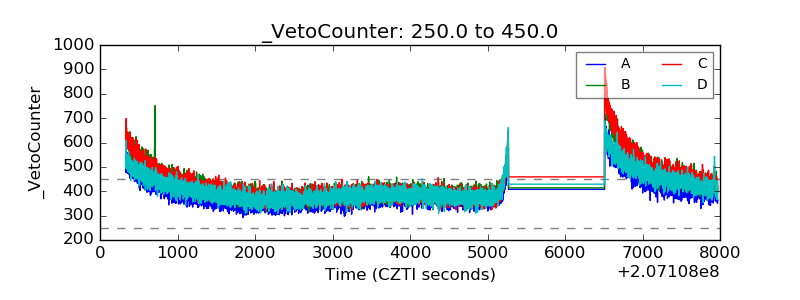 |