| Param | Original file | Final file |
|---|---|---|
| Filename | modeM0/AS1G05_253T01_9000000560_04457cztM0_level2.evt | modeM0/AS1G05_253T01_9000000560_04457cztM0_level2_quad_clean.evt |
| Size (bytes) | 335,903,040 | 48,634,560 |
| Size | 320.3 MB | 46.4 MB |
| Events in quadrant A | 2,278,402 | 284,885 |
| Events in quadrant B | 2,441,227 | 285,967 |
| Events in quadrant C | 2,302,804 | 289,693 |
| Events in quadrant D | 2,821,662 | 273,191 |
| Mode SS | |||
|---|---|---|---|
| Quadrant | BADHDUFLAG | Total packets | Discarded packets |
| A | 0 | 100 | 0 |
| B | 0 | 101 | 1 |
| C | 0 | 101 | 1 |
| D | 0 | 101 | 3 |
| Mode M9 | |||
|---|---|---|---|
| Quadrant | BADHDUFLAG | Total packets | Discarded packets |
| A | 0 | 13 | 0 |
| B | 0 | 13 | 0 |
| C | 0 | 13 | 0 |
| D | 0 | 13 | 0 |
| Mode M0 | |||
|---|---|---|---|
| Quadrant | BADHDUFLAG | Total packets | Discarded packets |
| A | 0 | 10059 | 167 |
| B | 0 | 10412 | 176 |
| C | 0 | 10151 | 188 |
| D | 0 | 11827 | 189 |
| Quadrant | Total seconds | Saturated seconds | Saturation percentage |
|---|---|---|---|
| A | 4822 | 40 | 0.829531% |
| B | 4821 | 37 | 0.767476% |
| C | 4813 | 39 | 0.810305% |
| D | 4817 | 143 | 2.968653% |
Noise dominated data is calculated using 1-second bins in cleaned event files. If a bin has >2000 counts, and if more than 50% of those come from <1% of pixels, then it is considered to be noise-dominated and hence unusable.
| Quadrant | # 1 sec bins | Bins with >0 counts | Bins with >2000 counts | High rate bins dominated by noise | Noise dominated (total time) | Noise dominated (detector-on time) | Marked lightcurve |
|---|---|---|---|---|---|---|---|
| A | 6128 | 4837 | 5 | 5 | 0.08% | 0.10% |  |
| B | 6125 | 4837 | 0 | 0 | 0.00% | 0.00% |  |
| C | 6135 | 4834 | 2 | 2 | 0.03% | 0.04% | 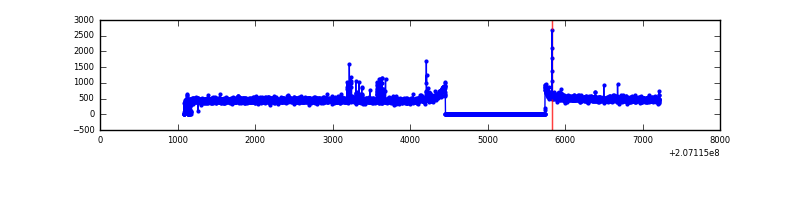 |
| D | 6130 | 4835 | 107 | 107 | 1.75% | 2.21% |  |
Top three noisy pixels from each quadrant. If the there are fewer than three noisy pixels in the level2.evt file, extra rows are filled as -1
| Pixel properties | Quadrant properties | ||||||
|---|---|---|---|---|---|---|---|
| Quadrant | DetID | PixID | Counts | Sigma | Mean | Median | Sigma |
| A | 8 | 16 | 23898 | 197.14 | 581 | 568 | 118.3 |
| A | 12 | 194 | 6010 | 45.98 | 581 | 568 | 118.3 |
| A | 0 | 226 | 5887 | 44.95 | 581 | 568 | 118.3 |
| B | 15 | 204 | 125080 | 1108.09 | 589 | 575 | 112.4 |
| B | 0 | 172 | 14754 | 126.19 | 589 | 575 | 112.4 |
| B | 12 | 111 | 9468 | 79.14 | 589 | 575 | 112.4 |
| C | 14 | 48 | 33079 | 245.54 | 571 | 574 | 132.4 |
| C | 1 | 3 | 16516 | 120.43 | 571 | 574 | 132.4 |
| C | 14 | 191 | 11958 | 86.0 | 571 | 574 | 132.4 |
| D | 2 | 136 | 231756 | 1698.36 | 562 | 545 | 136.1 |
| D | 7 | 39 | 147967 | 1082.89 | 562 | 545 | 136.1 |
| D | 12 | 227 | 98724 | 721.17 | 562 | 545 | 136.1 |
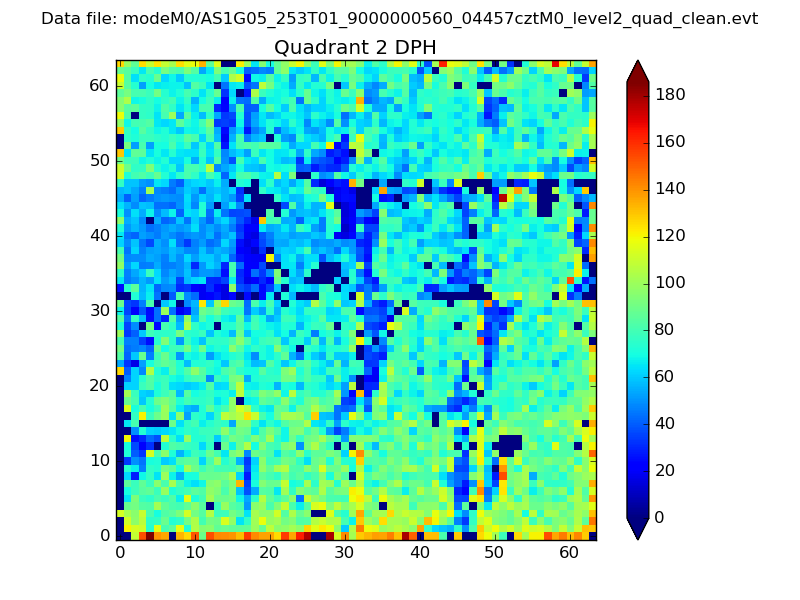
Histogram calculated using DETX and DETY for each event in the final _common_clean file
| Quadrant A | 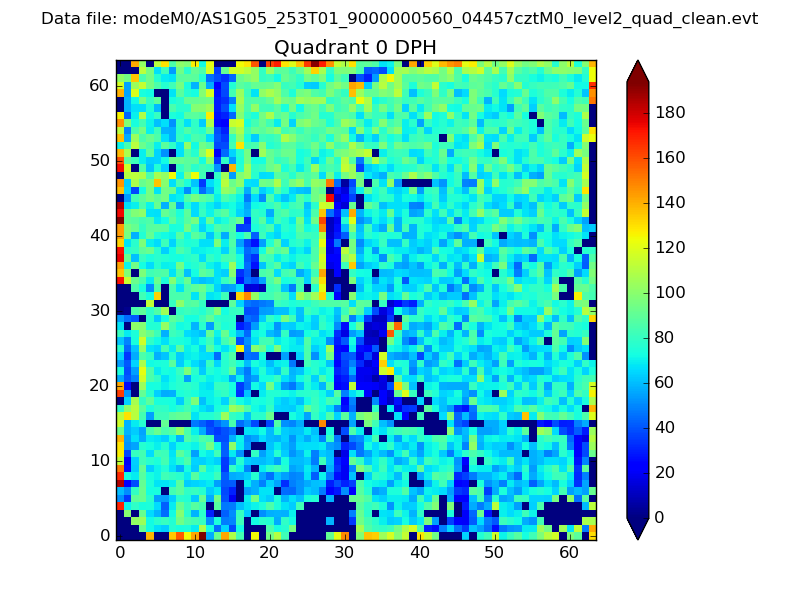 |
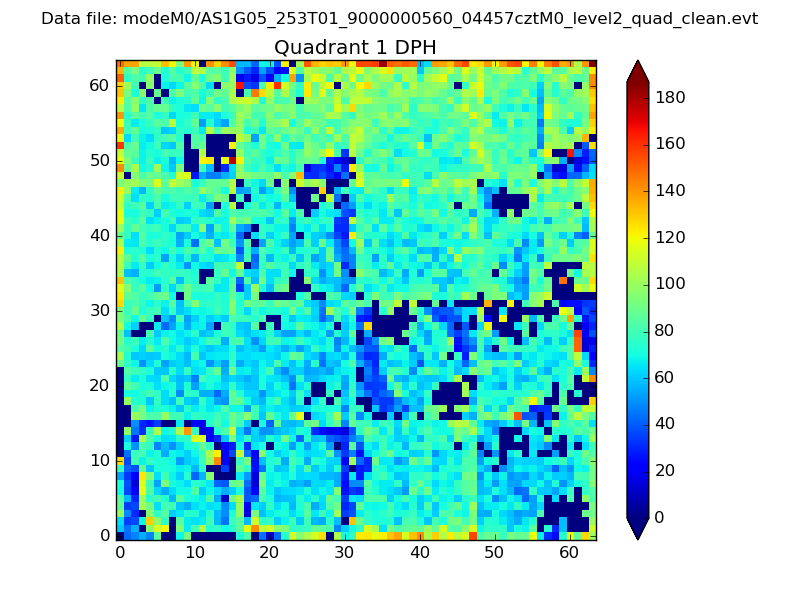 |
Quadrant B |
|---|---|---|---|
| Quadrant D | 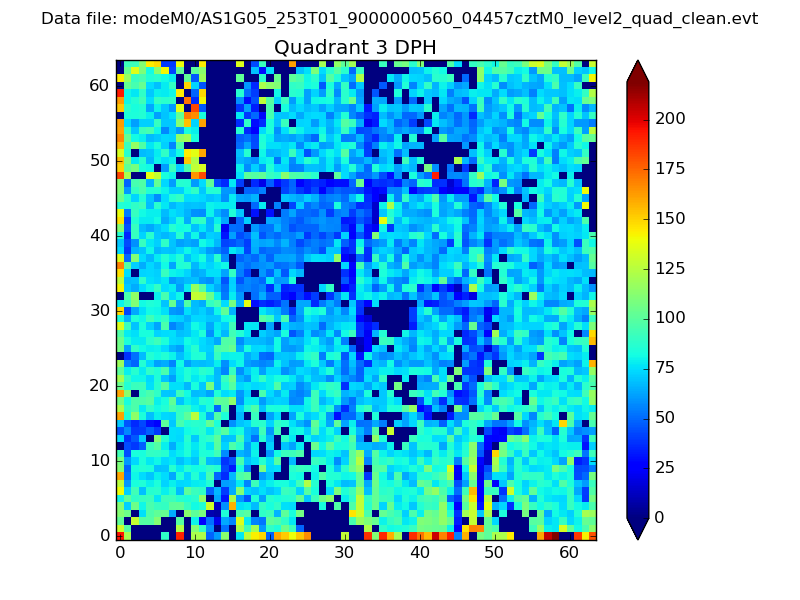 |
 |
Quadrant C |
| Plot type | Count rate plots | Images |
|---|---|---|
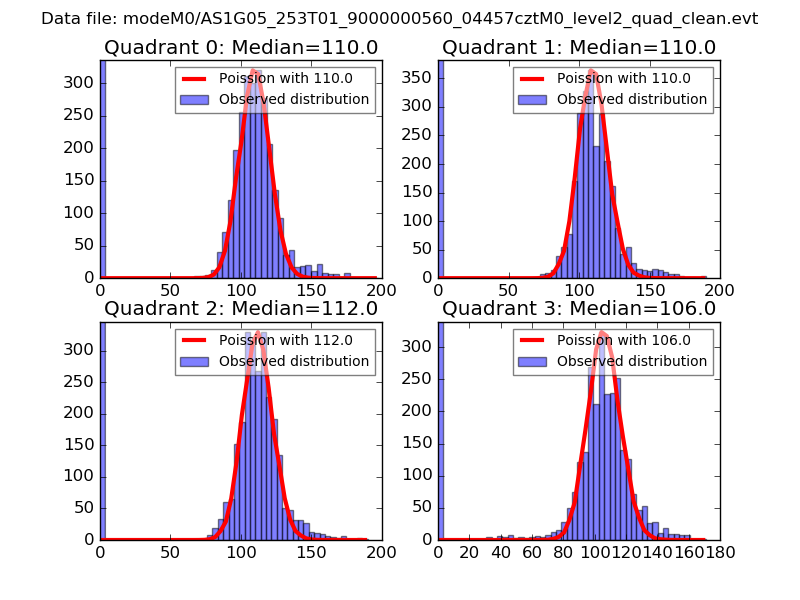
| Comparison with Poisson distribution Blue bars denote a histogram of data divided into 1 sec bins. Red curve is a Poisson curve with rate = median count rate of data. |
 |
 |
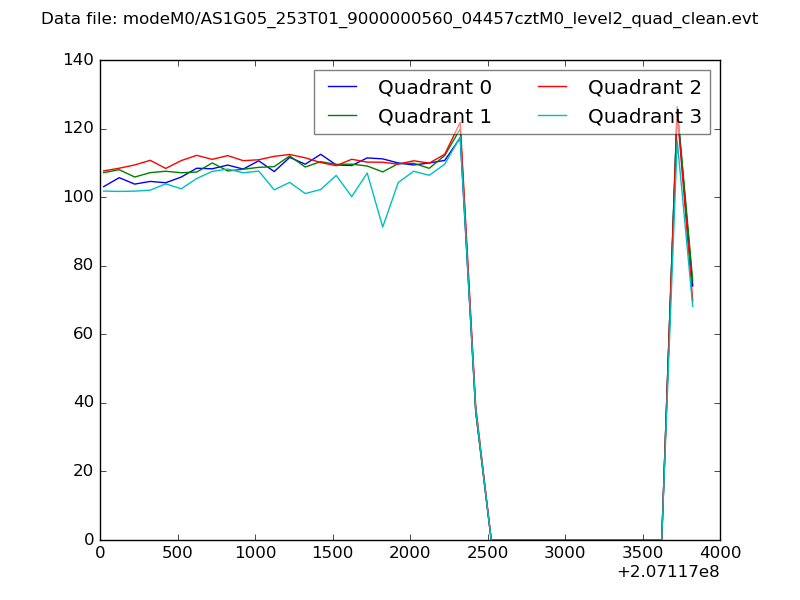
| Quadrant-wise count rates Data is divided into 100 sec bins |
 |
|
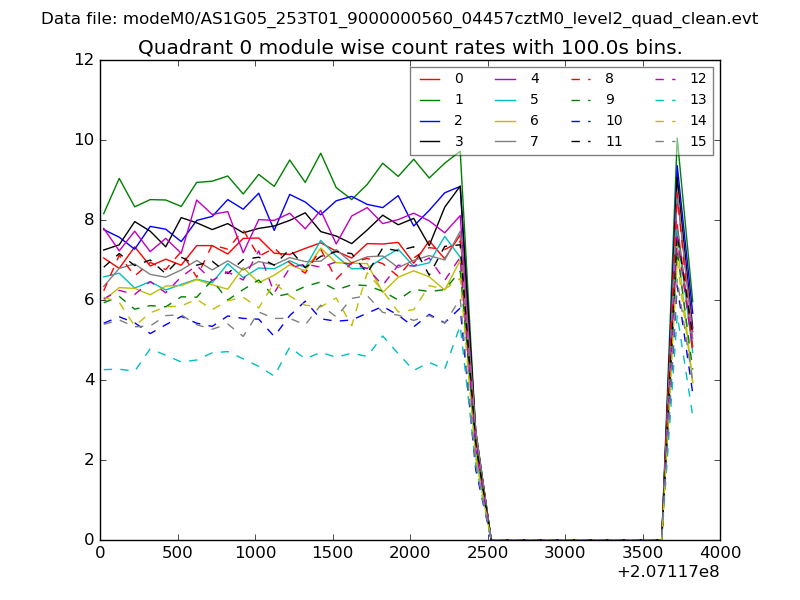
| Module-wise count rates for Quadrant A Data is divided into 100 sec bins |
 |
 |
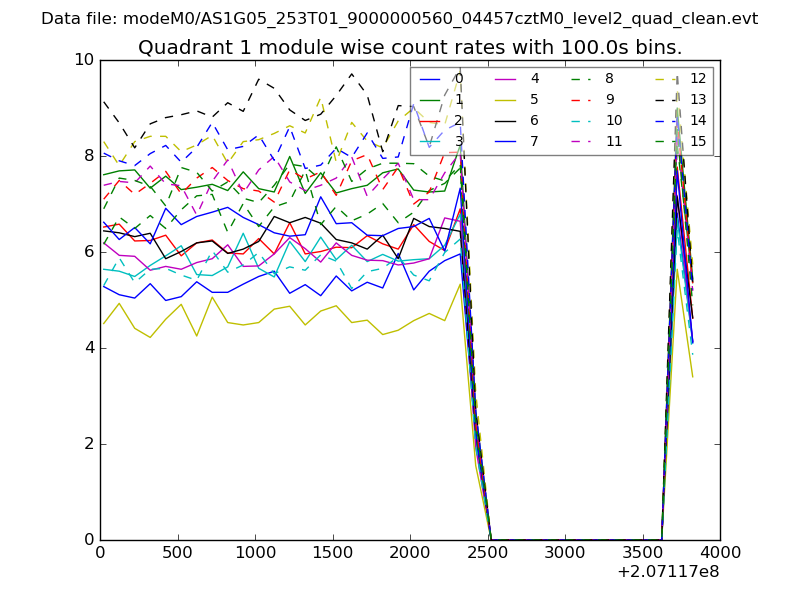
| Module-wise count rates for Quadrant B Data is divided into 100 sec bins |
 |
 |
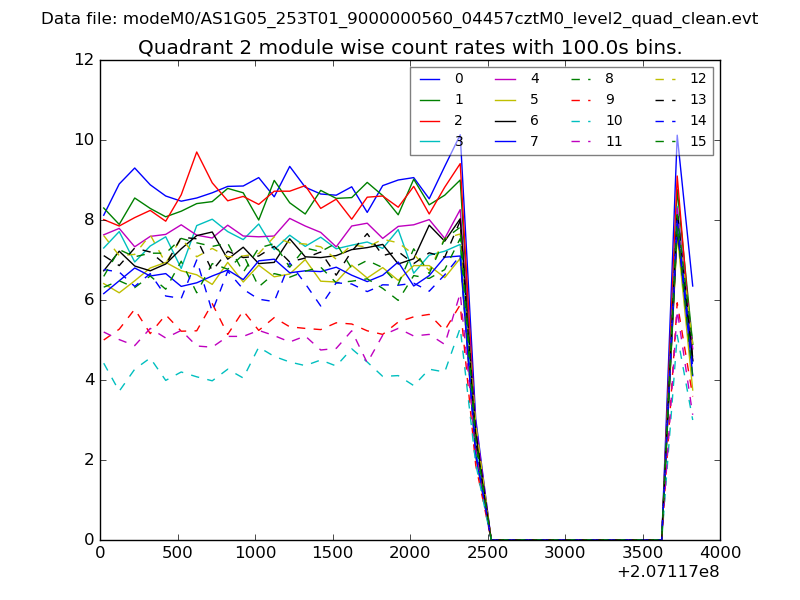
| Module-wise count rates for Quadrant C Data is divided into 100 sec bins |
 |
 |
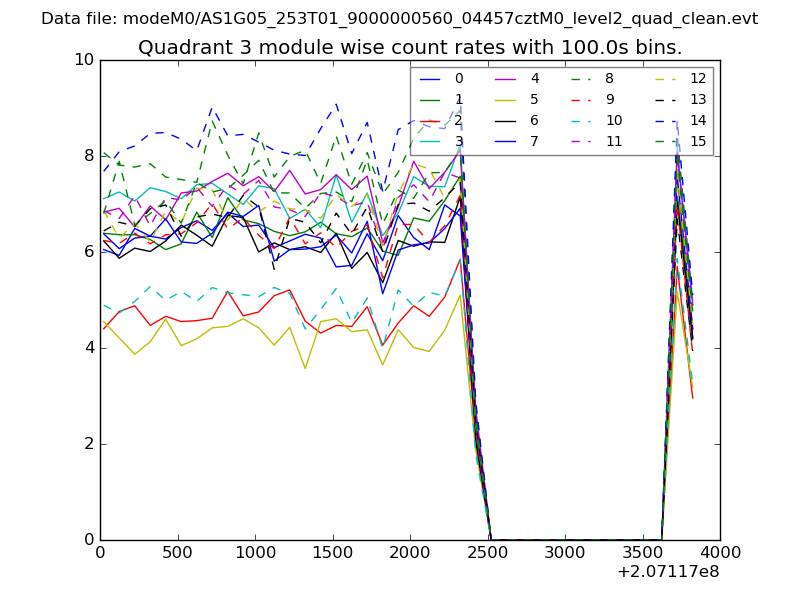
| Module-wise count rates for Quadrant D Data is divided into 100 sec bins |
 |
 |
| Parameter | Plot |
|---|---|
| CZT HV Monitor | 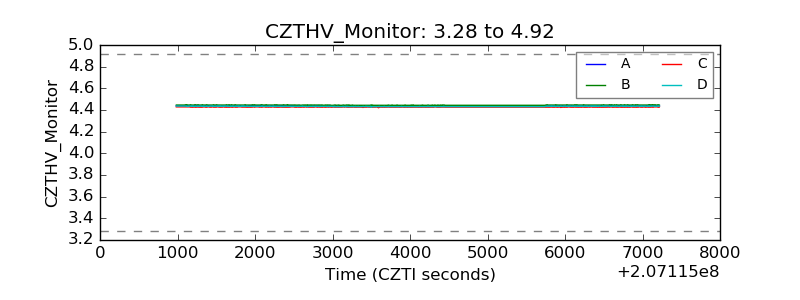 |
| D_VDD | 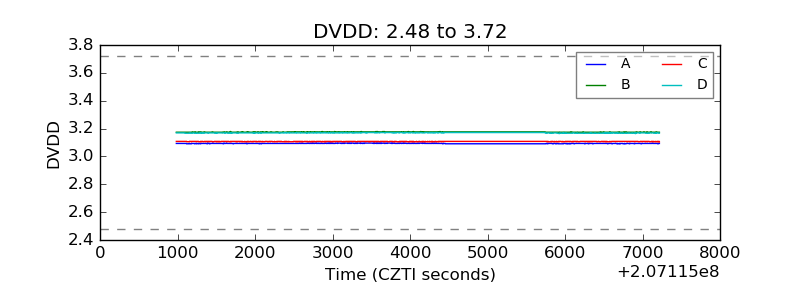 |
| Temperature 1 | 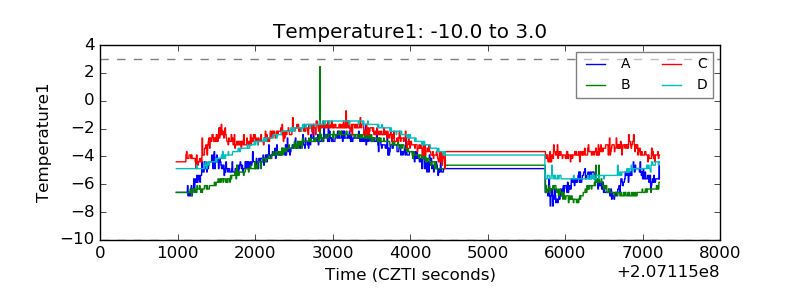 |
| Veto HV Monitor | 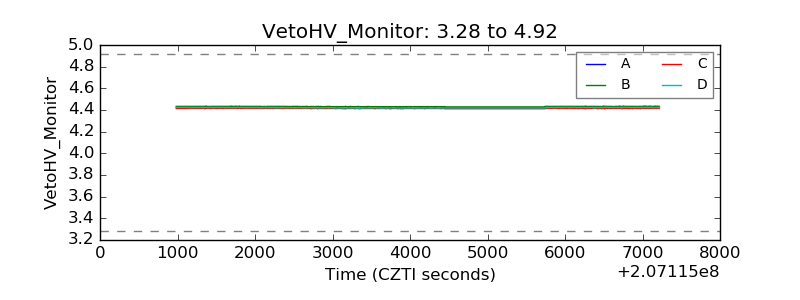 |
| Veto LLD | 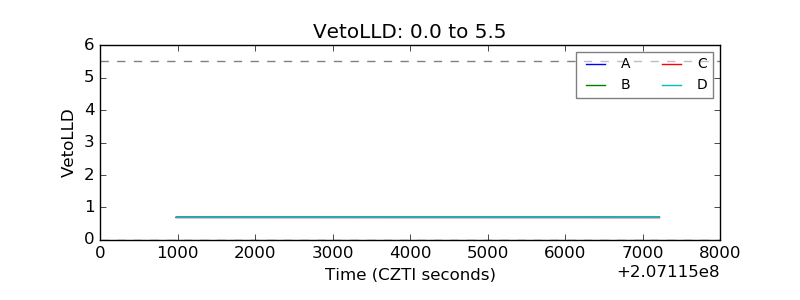 |
| Alpha Counter | 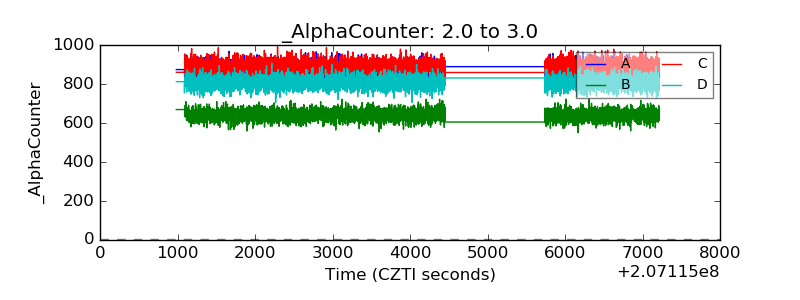 |
| _CPM_Rate | 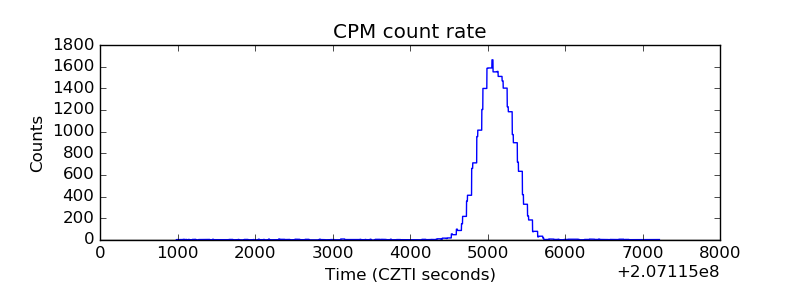 |
| CZT Counter | 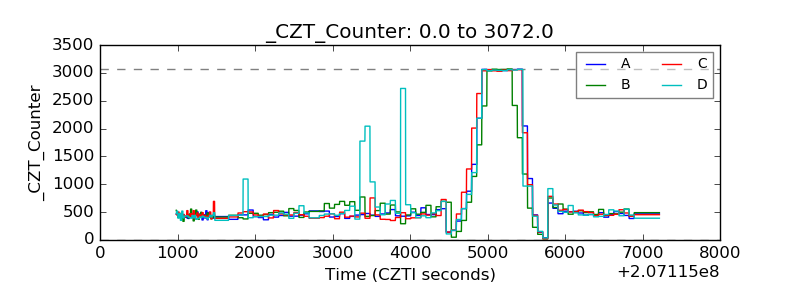 |
| +2.5 Volts monitor |  |
| +5 Volts monitor |  |
| _ROLL_ROT | 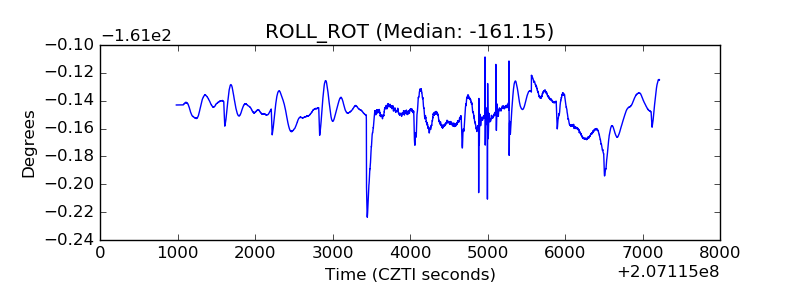 |
| _Roll_DEC | 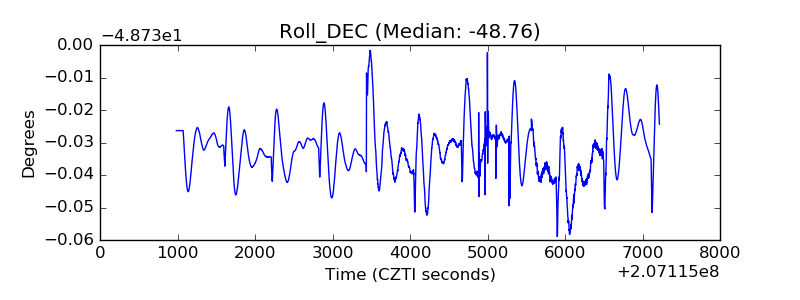 |
| _Roll_RA | 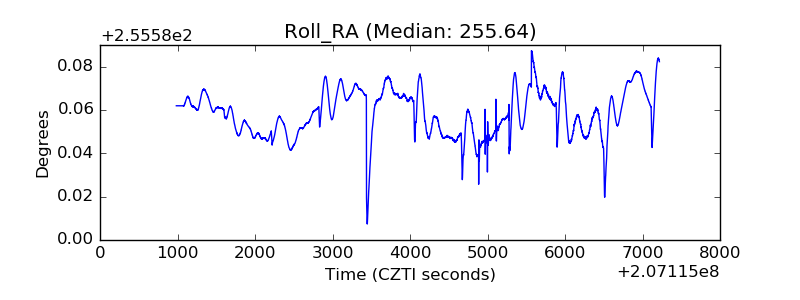 |
| Veto Counter | 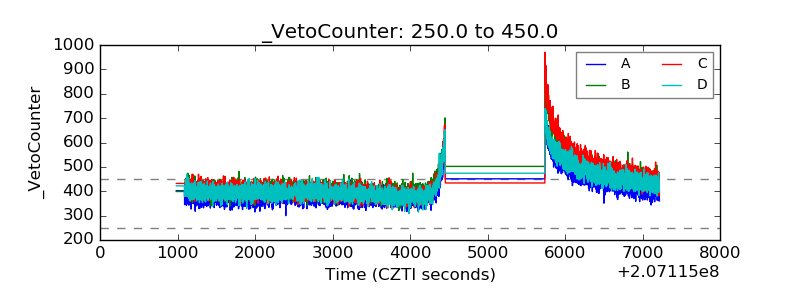 |