| Param | Original file | Final file |
|---|---|---|
| Filename | modeM0/AS1G05_253T01_9000000560_04458cztM0_level2.evt | modeM0/AS1G05_253T01_9000000560_04458cztM0_level2_quad_clean.evt |
| Size (bytes) | 433,955,520 | 53,916,480 |
| Size | 413.9 MB | 51.4 MB |
| Events in quadrant A | 2,896,772 | 308,896 |
| Events in quadrant B | 2,923,164 | 313,458 |
| Events in quadrant C | 2,848,069 | 318,799 |
| Events in quadrant D | 4,070,732 | 276,163 |
| Mode SS | |||
|---|---|---|---|
| Quadrant | BADHDUFLAG | Total packets | Discarded packets |
| A | 0 | 120 | 0 |
| B | 0 | 120 | 0 |
| C | 0 | 120 | 0 |
| D | 0 | 120 | 0 |
| Mode M9 | |||
|---|---|---|---|
| Quadrant | BADHDUFLAG | Total packets | Discarded packets |
| A | 0 | 13 | 0 |
| B | 0 | 13 | 0 |
| C | 0 | 13 | 0 |
| D | 0 | 13 | 0 |
| Mode M0 | |||
|---|---|---|---|
| Quadrant | BADHDUFLAG | Total packets | Discarded packets |
| A | 0 | 12454 | 2 |
| B | 0 | 12331 | 1 |
| C | 0 | 12330 | 1 |
| D | 0 | 16128 | 1 |
| Quadrant | Total seconds | Saturated seconds | Saturation percentage |
|---|---|---|---|
| A | 5937 | 90 | 1.515917% |
| B | 5937 | 82 | 1.381169% |
| C | 5937 | 56 | 0.943237% |
| D | 5937 | 472 | 7.950143% |
Noise dominated data is calculated using 1-second bins in cleaned event files. If a bin has >2000 counts, and if more than 50% of those come from <1% of pixels, then it is considered to be noise-dominated and hence unusable.
| Quadrant | # 1 sec bins | Bins with >0 counts | Bins with >2000 counts | High rate bins dominated by noise | Noise dominated (total time) | Noise dominated (detector-on time) | Marked lightcurve |
|---|---|---|---|---|---|---|---|
| A | 7187 | 5938 | 13 | 13 | 0.18% | 0.22% |  |
| B | 7187 | 5938 | 0 | 0 | 0.00% | 0.00% |  |
| C | 7187 | 5938 | 0 | 0 | 0.00% | 0.00% | 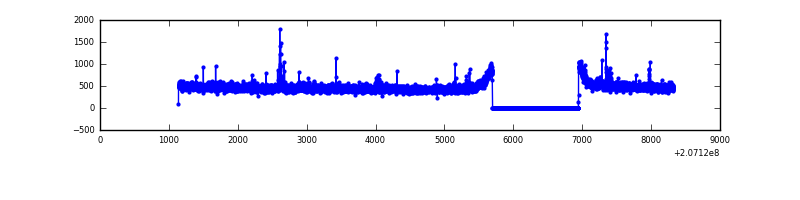 |
| D | 7187 | 5938 | 359 | 359 | 5.00% | 6.05% |  |
Top three noisy pixels from each quadrant. If the there are fewer than three noisy pixels in the level2.evt file, extra rows are filled as -1
| Pixel properties | Quadrant properties | ||||||
|---|---|---|---|---|---|---|---|
| Quadrant | DetID | PixID | Counts | Sigma | Mean | Median | Sigma |
| A | 0 | 118 | 59770 | 405.51 | 719 | 703 | 145.7 |
| A | 0 | 13 | 40093 | 270.42 | 719 | 703 | 145.7 |
| A | 0 | 226 | 12543 | 81.28 | 719 | 703 | 145.7 |
| B | 15 | 204 | 55320 | 398.64 | 729 | 713 | 137.0 |
| B | 4 | 48 | 16990 | 118.82 | 729 | 713 | 137.0 |
| B | 15 | 54 | 12989 | 89.62 | 729 | 713 | 137.0 |
| C | 9 | 16 | 40160 | 241.47 | 709 | 714 | 163.4 |
| C | 9 | 54 | 16166 | 94.59 | 709 | 714 | 163.4 |
| C | 14 | 48 | 15385 | 89.81 | 709 | 714 | 163.4 |
| D | 2 | 136 | 1115311 | 6779.55 | 679 | 661 | 164.4 |
| D | 13 | 235 | 205958 | 1248.66 | 679 | 661 | 164.4 |
| D | 12 | 227 | 51116 | 306.88 | 679 | 661 | 164.4 |
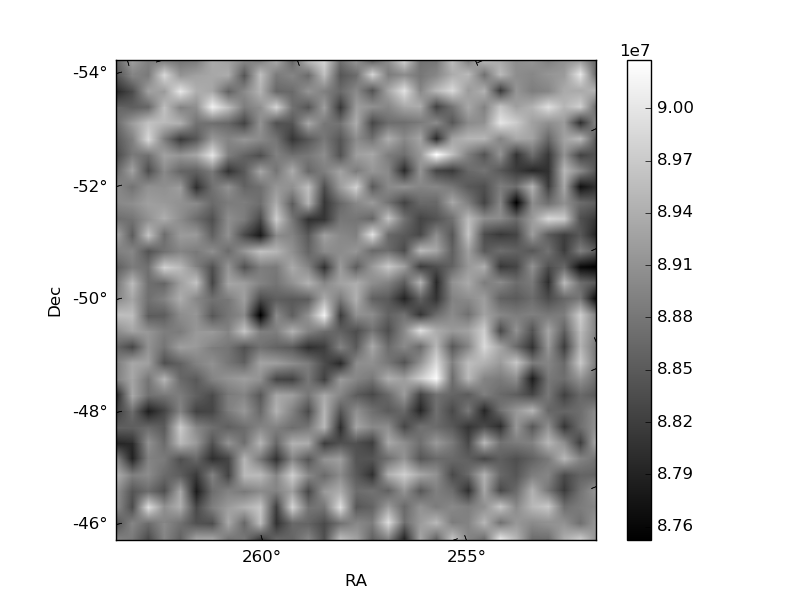
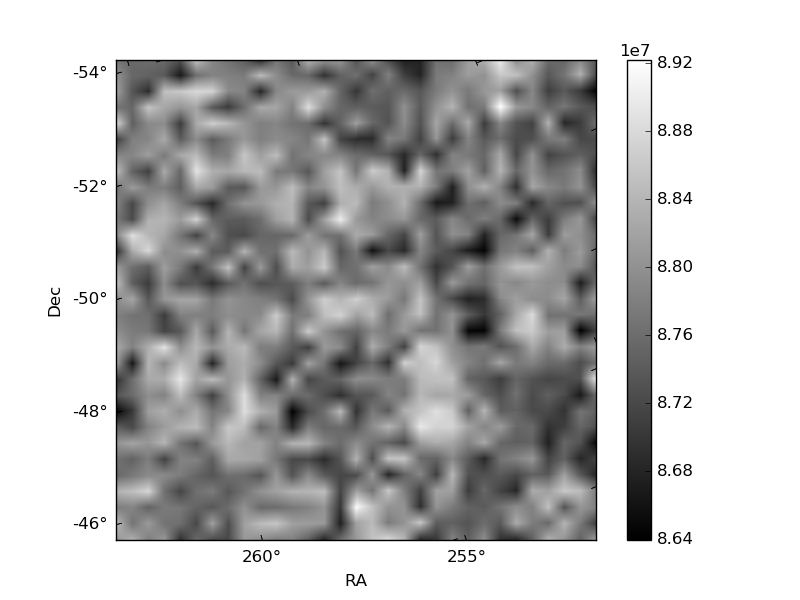
Histogram calculated using DETX and DETY for each event in the final _common_clean file
| Quadrant A | 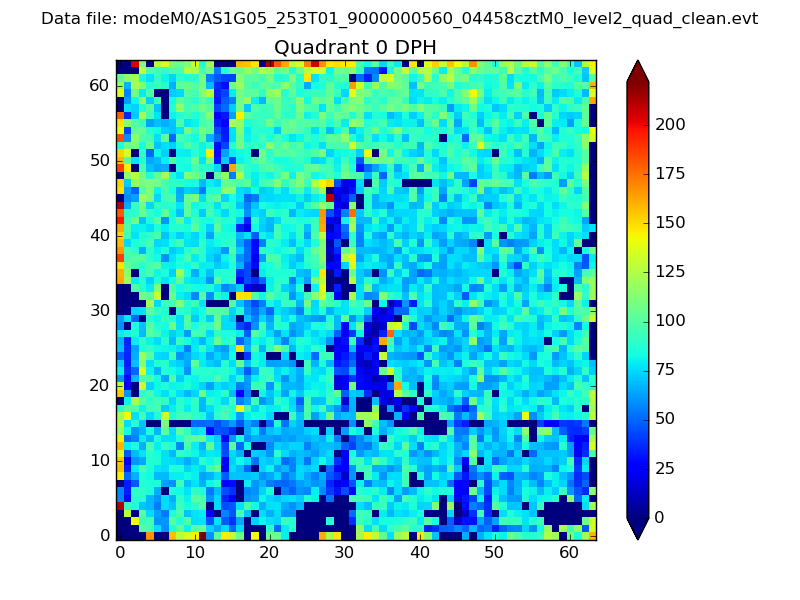 |
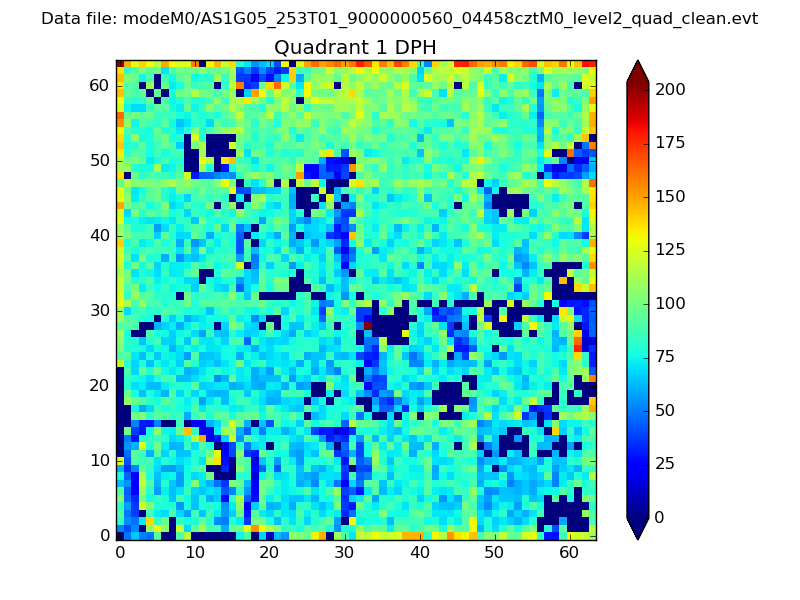 |
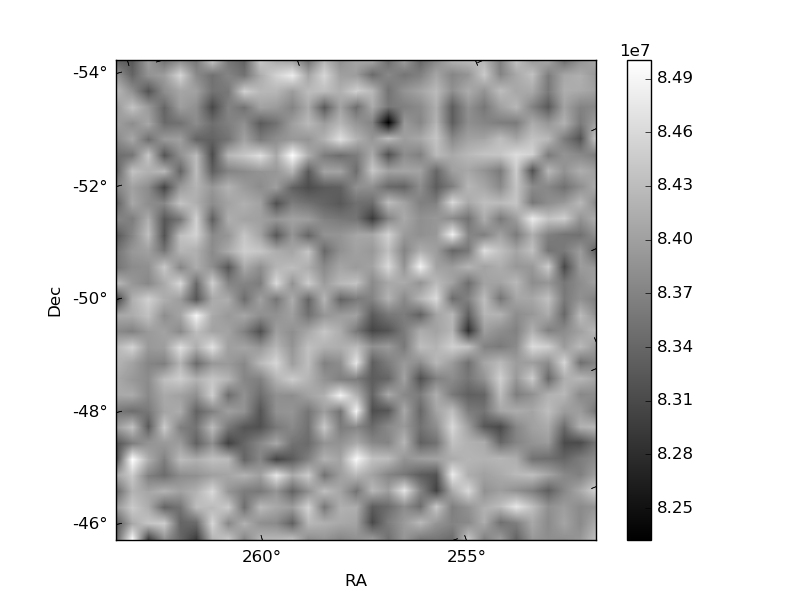
Quadrant B |
|---|---|---|---|
| Quadrant D | 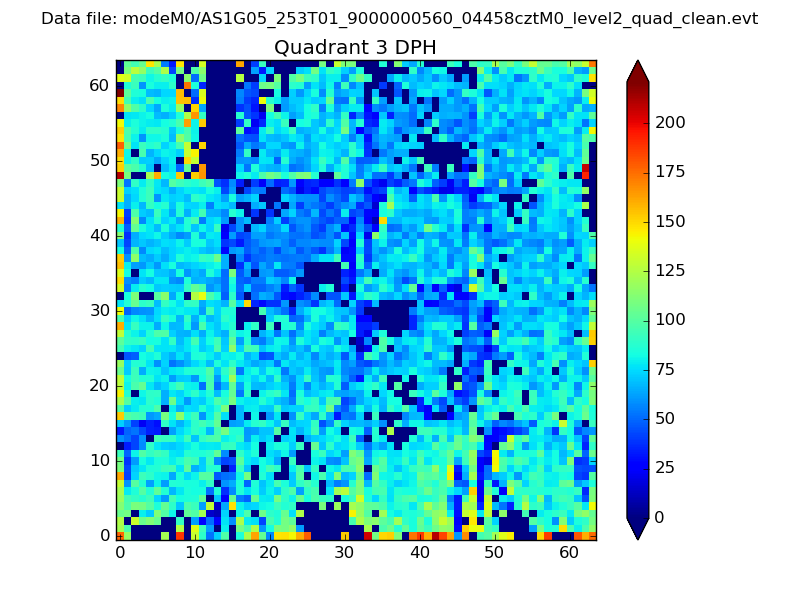 |
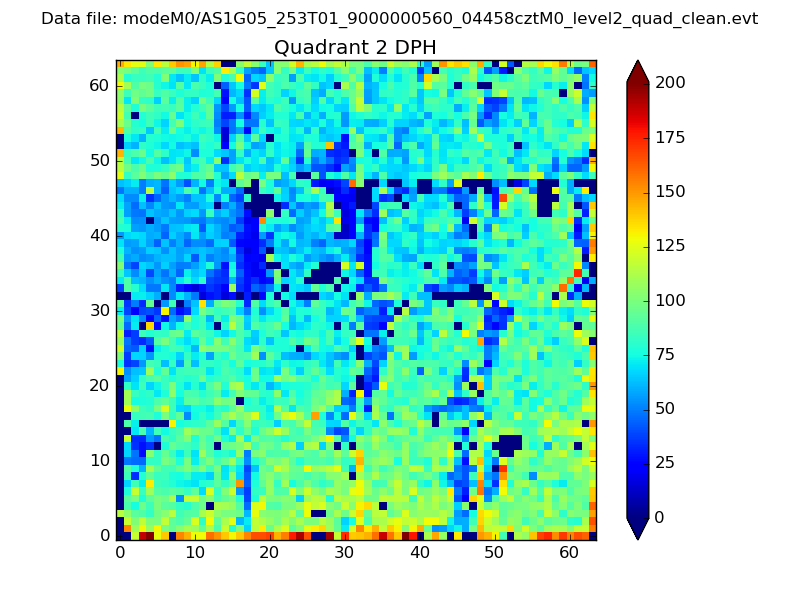 |
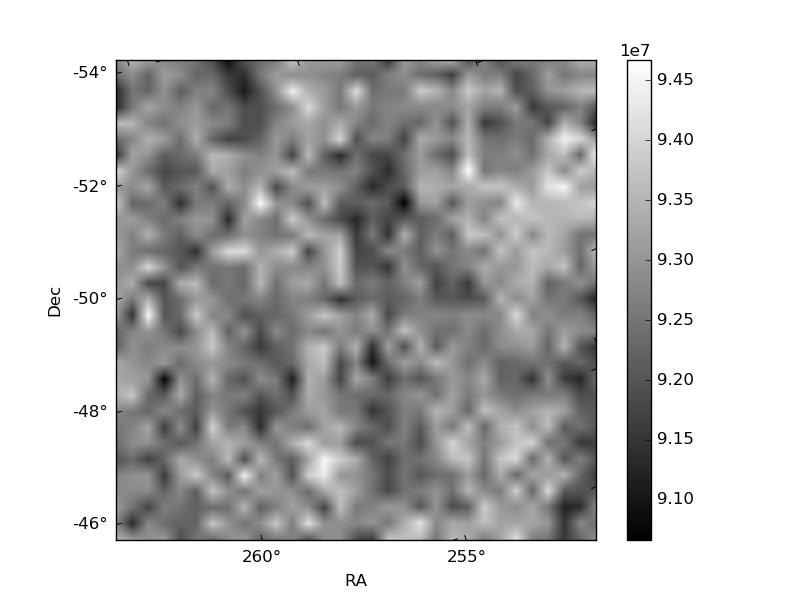
Quadrant C |
| Plot type | Count rate plots | Images |
|---|---|---|
| Comparison with Poisson distribution Blue bars denote a histogram of data divided into 1 sec bins. Red curve is a Poisson curve with rate = median count rate of data. |
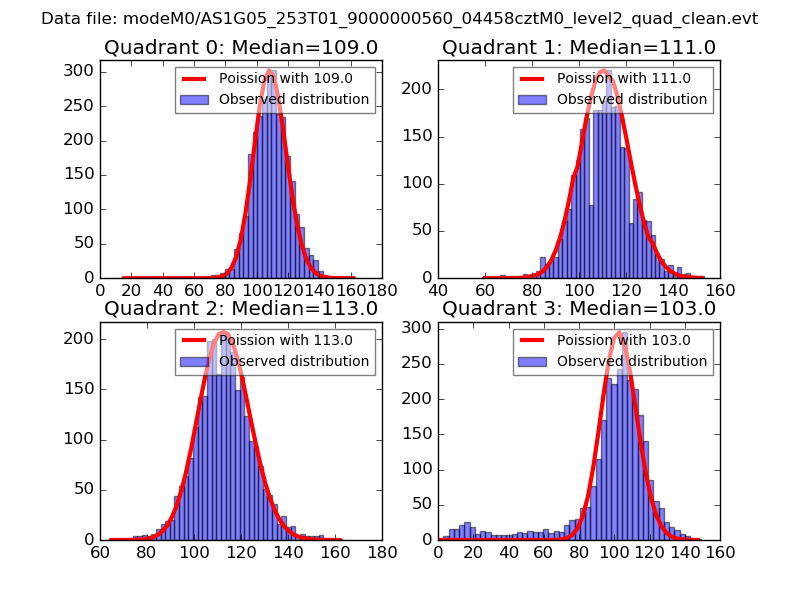 |
 |
| Quadrant-wise count rates Data is divided into 100 sec bins |
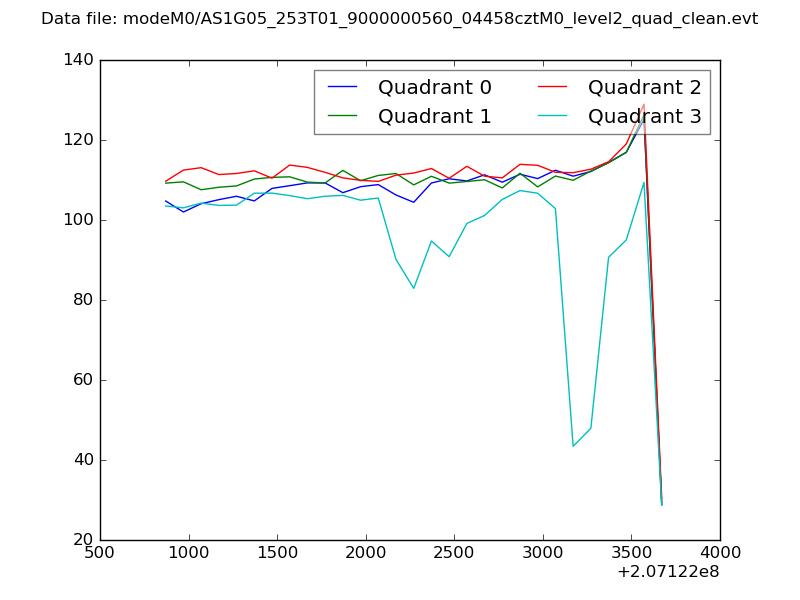 |
|
| Module-wise count rates for Quadrant A Data is divided into 100 sec bins |
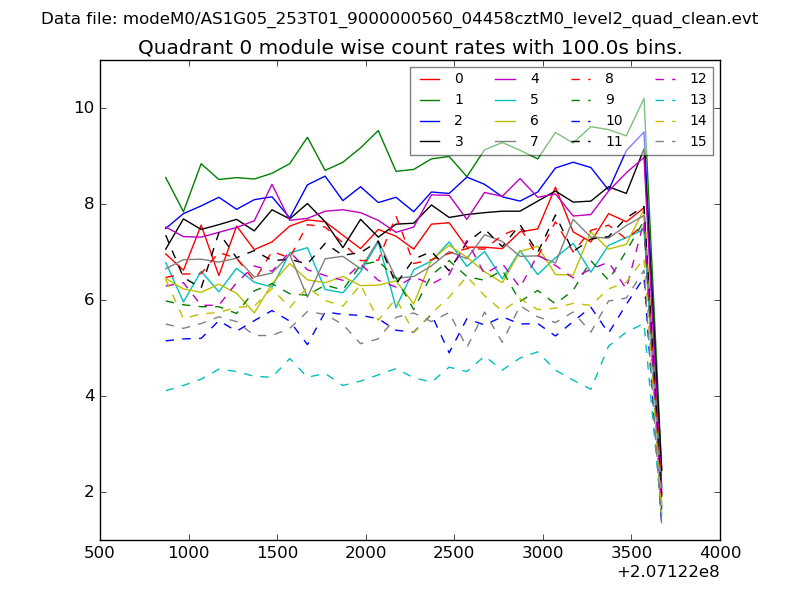 |
 |
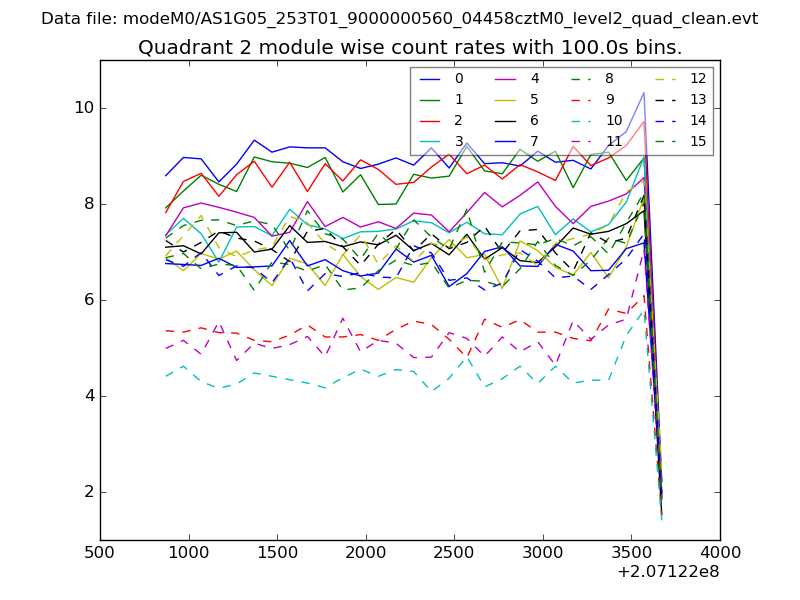
| Module-wise count rates for Quadrant B Data is divided into 100 sec bins |
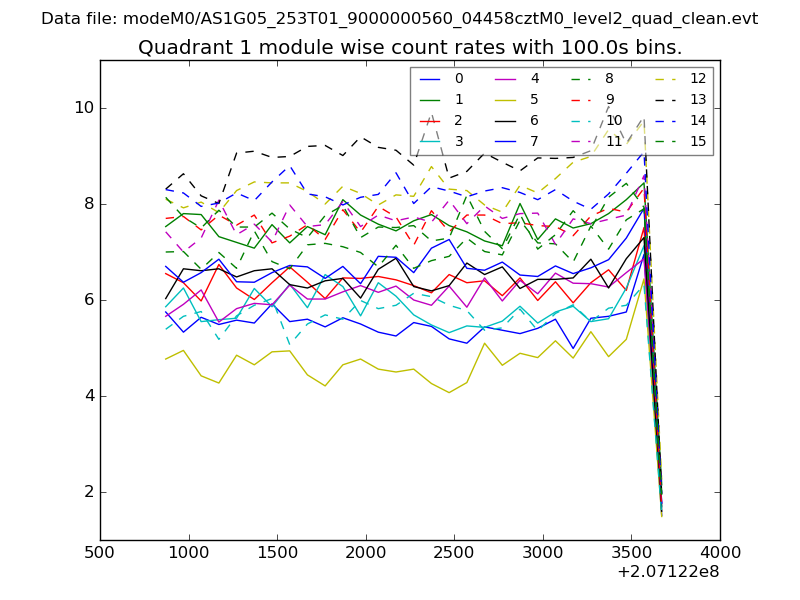 |
 |
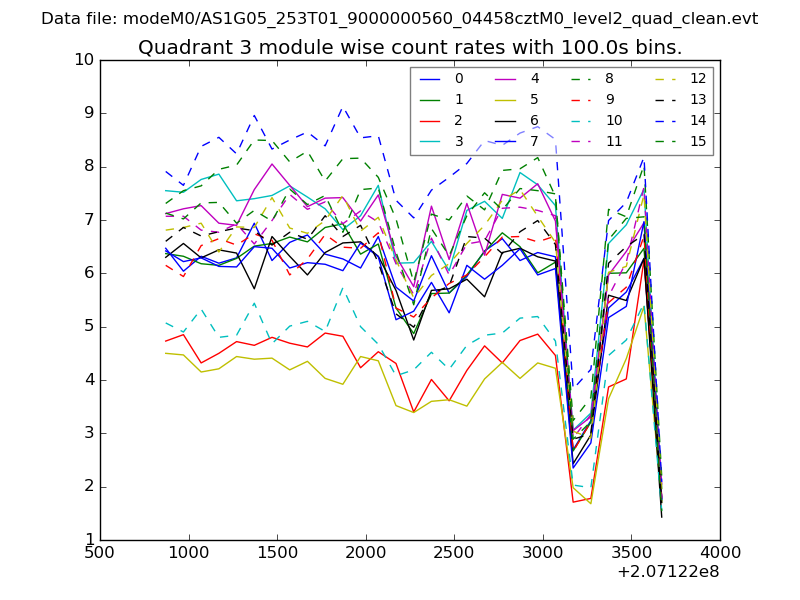
| Module-wise count rates for Quadrant C Data is divided into 100 sec bins |
 |
 |
| Module-wise count rates for Quadrant D Data is divided into 100 sec bins |
 |
 |
| Parameter | Plot |
|---|---|
| CZT HV Monitor | 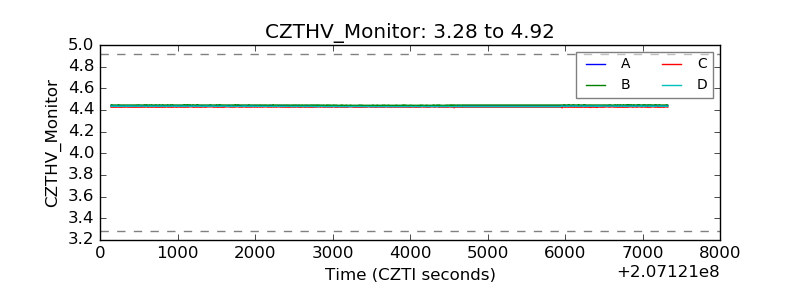 |
| D_VDD | 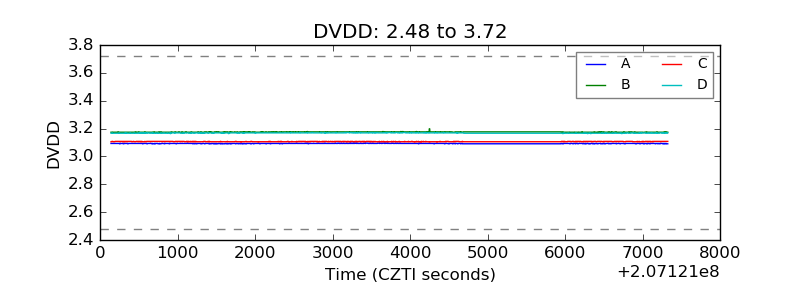 |
| Temperature 1 | 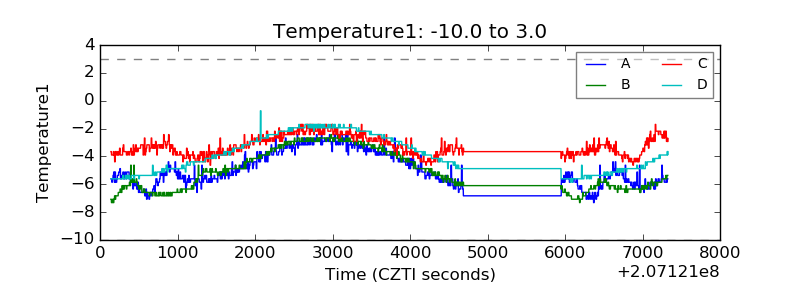 |
| Veto HV Monitor | 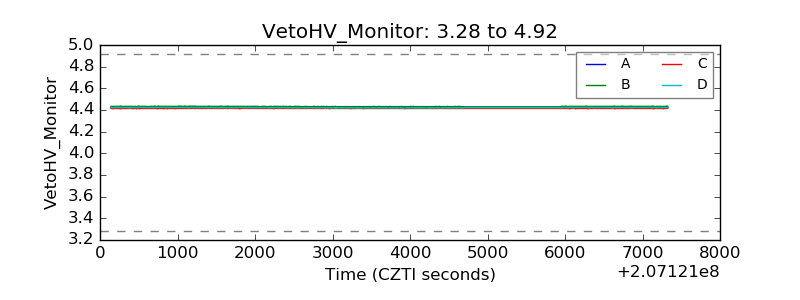 |
| Veto LLD | 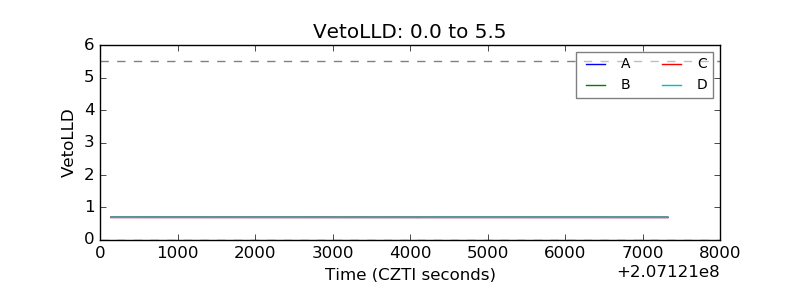 |
| Alpha Counter | 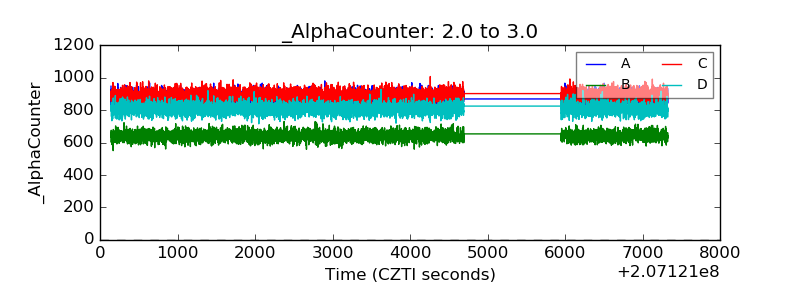 |
| _CPM_Rate | 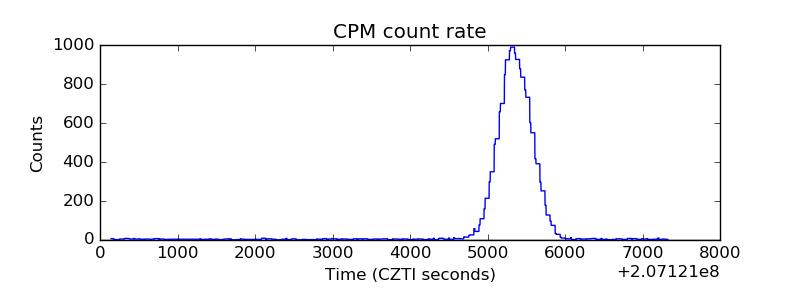 |
| CZT Counter | 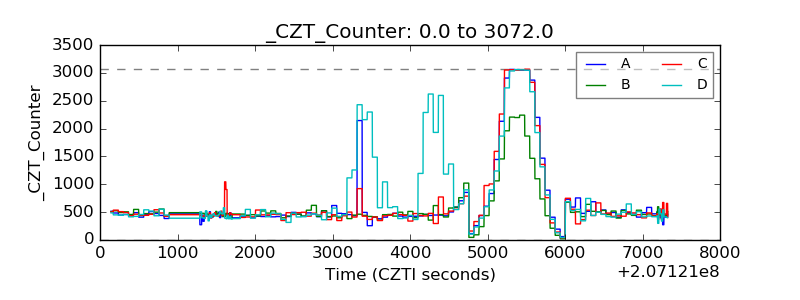 |
| +2.5 Volts monitor |  |
| +5 Volts monitor |  |
| _ROLL_ROT | 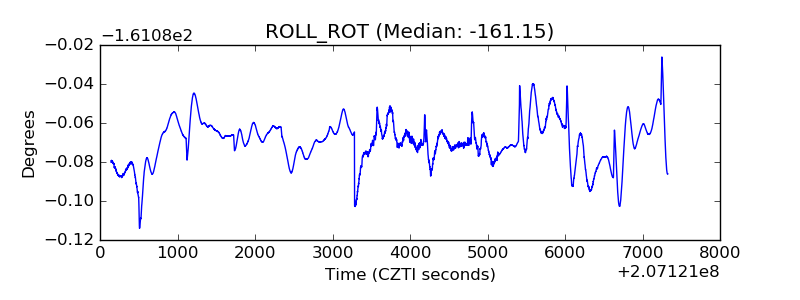 |
| _Roll_DEC | 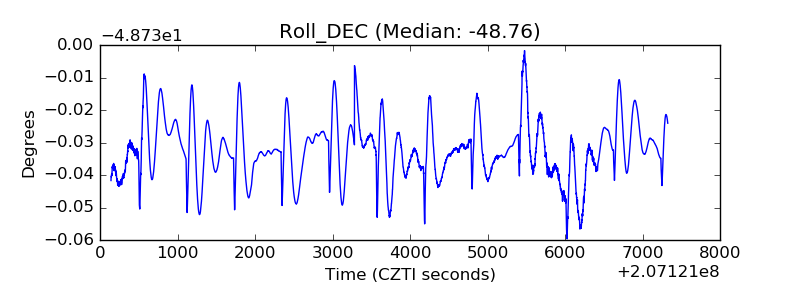 |
| _Roll_RA | 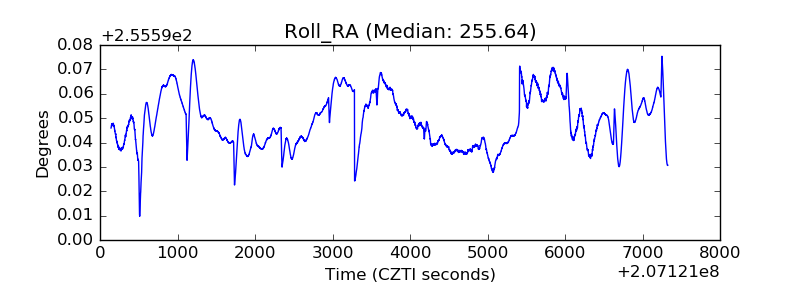 |
| Veto Counter | 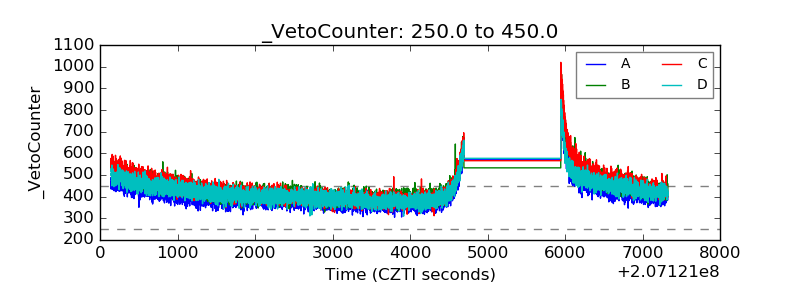 |