| Param | Original file | Final file |
|---|---|---|
| Filename | modeM0/AS1G05_253T01_9000000560_04459cztM0_level2.evt | modeM0/AS1G05_253T01_9000000560_04459cztM0_level2_quad_clean.evt |
| Size (bytes) | 401,872,320 | 61,496,640 |
| Size | 383.3 MB | 58.6 MB |
| Events in quadrant A | 2,959,312 | 360,352 |
| Events in quadrant B | 2,935,027 | 362,089 |
| Events in quadrant C | 2,823,776 | 367,199 |
| Events in quadrant D | 3,041,521 | 350,304 |
| Mode SS | |||
|---|---|---|---|
| Quadrant | BADHDUFLAG | Total packets | Discarded packets |
| A | 0 | 122 | 0 |
| B | 0 | 122 | 0 |
| C | 0 | 122 | 0 |
| D | 0 | 122 | 0 |
| Mode M9 | |||
|---|---|---|---|
| Quadrant | BADHDUFLAG | Total packets | Discarded packets |
| A | 0 | 12 | 0 |
| B | 0 | 12 | 0 |
| C | 0 | 12 | 0 |
| D | 0 | 12 | 0 |
| Mode M0 | |||
|---|---|---|---|
| Quadrant | BADHDUFLAG | Total packets | Discarded packets |
| A | 0 | 12841 | 2 |
| B | 0 | 12560 | 1 |
| C | 0 | 12491 | 1 |
| D | 0 | 13265 | 3 |
| Quadrant | Total seconds | Saturated seconds | Saturation percentage |
|---|---|---|---|
| A | 6044 | 99 | 1.637988% |
| B | 6044 | 89 | 1.472535% |
| C | 6044 | 76 | 1.257445% |
| D | 6043 | 131 | 2.167797% |
Noise dominated data is calculated using 1-second bins in cleaned event files. If a bin has >2000 counts, and if more than 50% of those come from <1% of pixels, then it is considered to be noise-dominated and hence unusable.
| Quadrant | # 1 sec bins | Bins with >0 counts | Bins with >2000 counts | High rate bins dominated by noise | Noise dominated (total time) | Noise dominated (detector-on time) | Marked lightcurve |
|---|---|---|---|---|---|---|---|
| A | 7199 | 6045 | 16 | 16 | 0.22% | 0.26% | 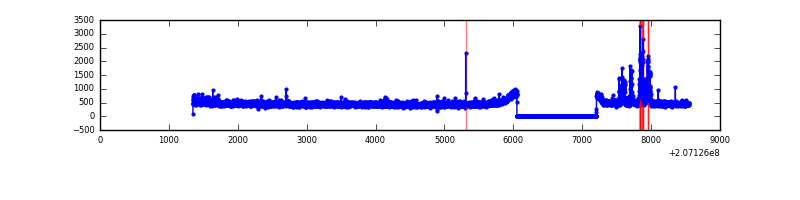 |
| B | 7199 | 6045 | 0 | 0 | 0.00% | 0.00% | 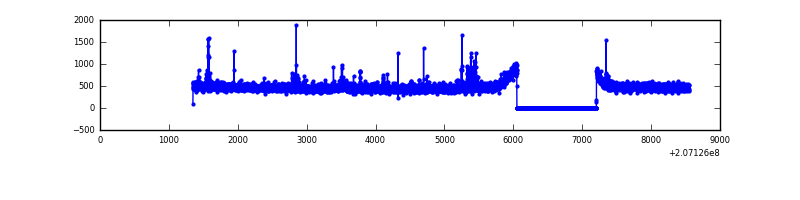 |
| C | 7199 | 6045 | 0 | 0 | 0.00% | 0.00% | 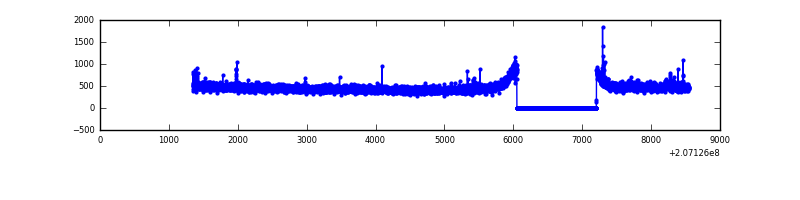 |
| D | 7199 | 6045 | 59 | 59 | 0.82% | 0.98% | 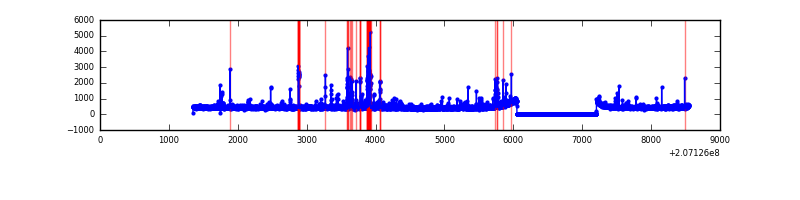 |
Top three noisy pixels from each quadrant. If the there are fewer than three noisy pixels in the level2.evt file, extra rows are filled as -1
| Pixel properties | Quadrant properties | ||||||
|---|---|---|---|---|---|---|---|
| Quadrant | DetID | PixID | Counts | Sigma | Mean | Median | Sigma |
| A | 0 | 50 | 151061 | 1009.53 | 722 | 706 | 148.9 |
| A | 0 | 13 | 24358 | 158.81 | 722 | 706 | 148.9 |
| A | 0 | 226 | 7744 | 47.26 | 722 | 706 | 148.9 |
| B | 4 | 48 | 34661 | 244.22 | 729 | 711 | 139.0 |
| B | 15 | 204 | 20772 | 144.31 | 729 | 711 | 139.0 |
| B | 4 | 170 | 19538 | 135.43 | 729 | 711 | 139.0 |
| C | 14 | 48 | 19528 | 114.9 | 709 | 711 | 163.8 |
| C | 9 | 16 | 12326 | 70.92 | 709 | 711 | 163.8 |
| C | 9 | 54 | 11415 | 65.36 | 709 | 711 | 163.8 |
| D | 13 | 235 | 192457 | 1153.88 | 700 | 680 | 166.2 |
| D | 8 | 112 | 42413 | 251.1 | 700 | 680 | 166.2 |
| D | 2 | 136 | 41025 | 242.75 | 700 | 680 | 166.2 |
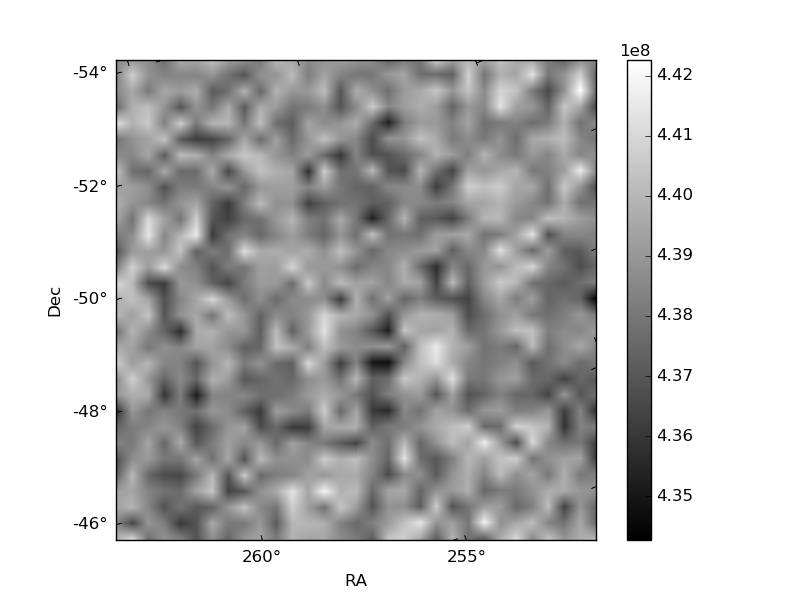
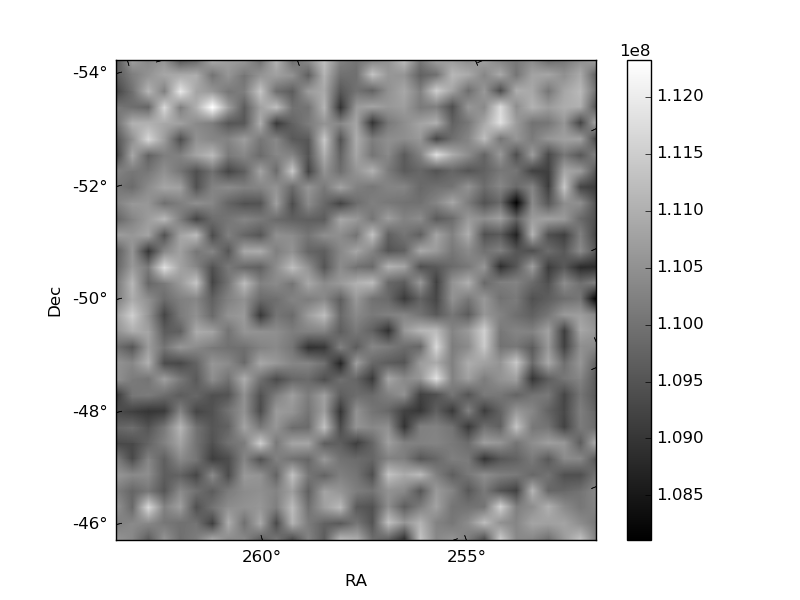
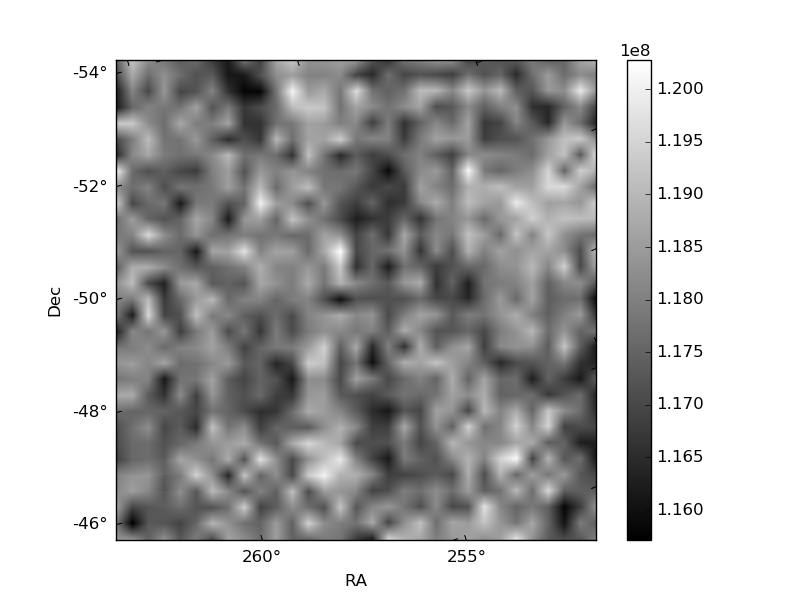
Histogram calculated using DETX and DETY for each event in the final _common_clean file
| Quadrant A | 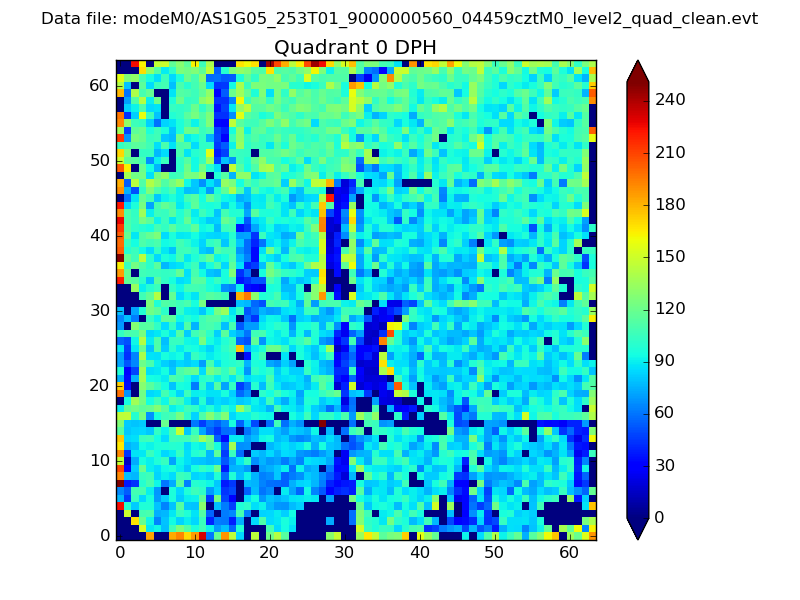 |
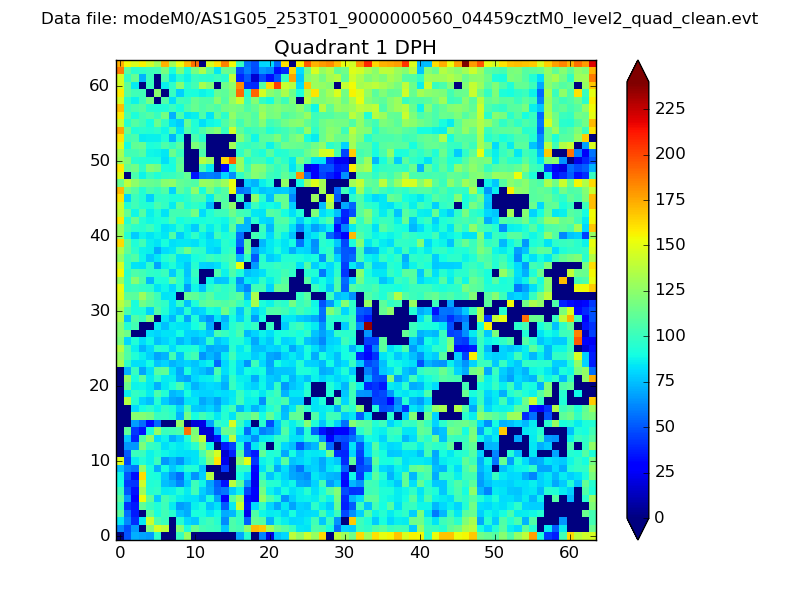 |
Quadrant B |
|---|---|---|---|
| Quadrant D | 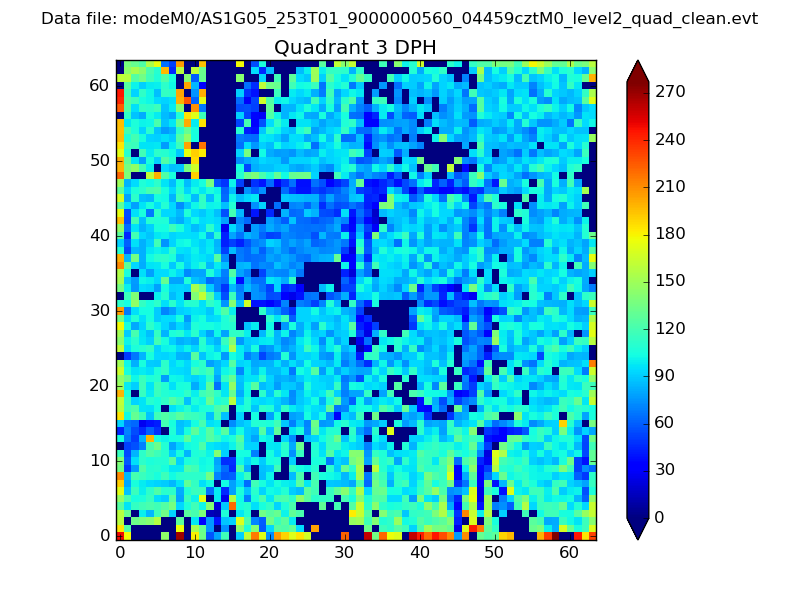 |
 |
Quadrant C |
| Plot type | Count rate plots | Images |
|---|---|---|
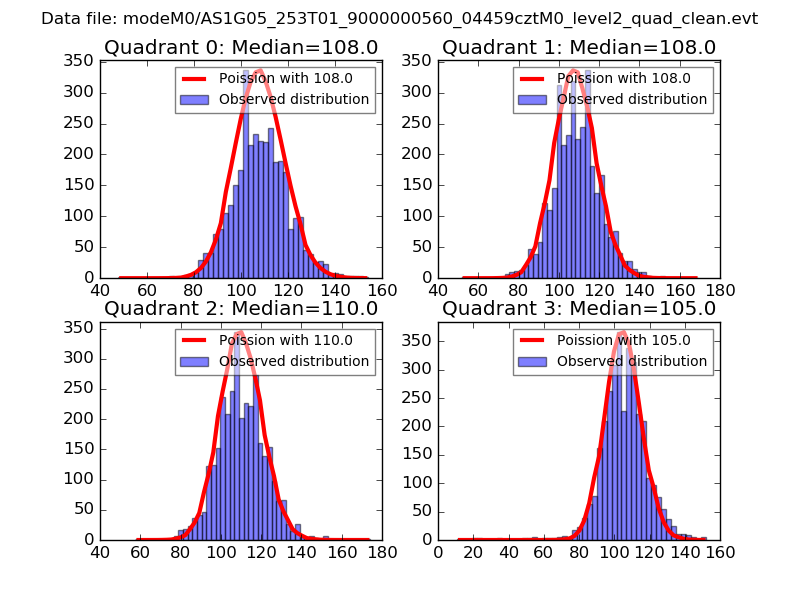
| Comparison with Poisson distribution Blue bars denote a histogram of data divided into 1 sec bins. Red curve is a Poisson curve with rate = median count rate of data. |
 |
 |
| Quadrant-wise count rates Data is divided into 100 sec bins |
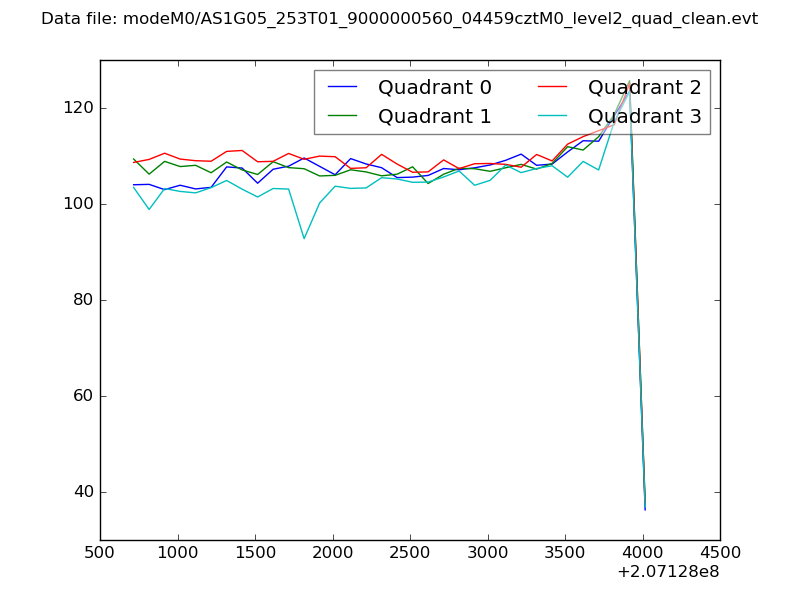 |
|
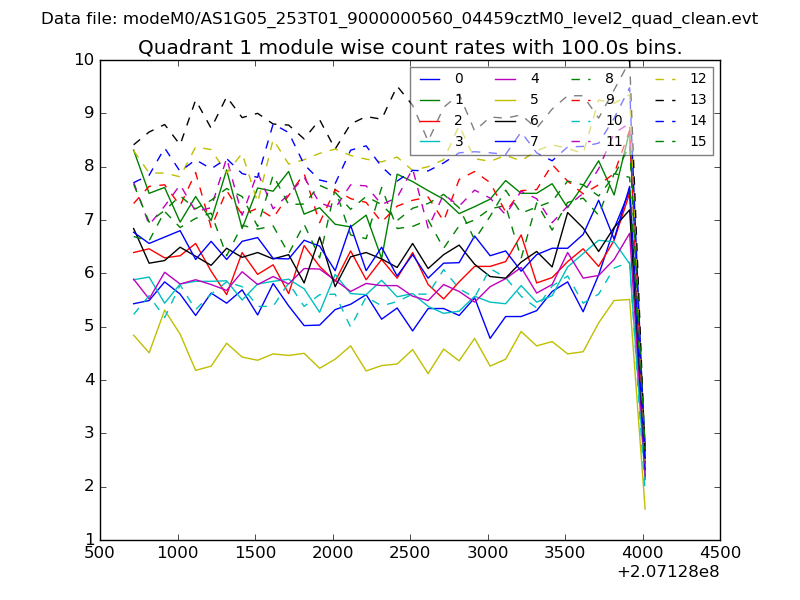
| Module-wise count rates for Quadrant A Data is divided into 100 sec bins |
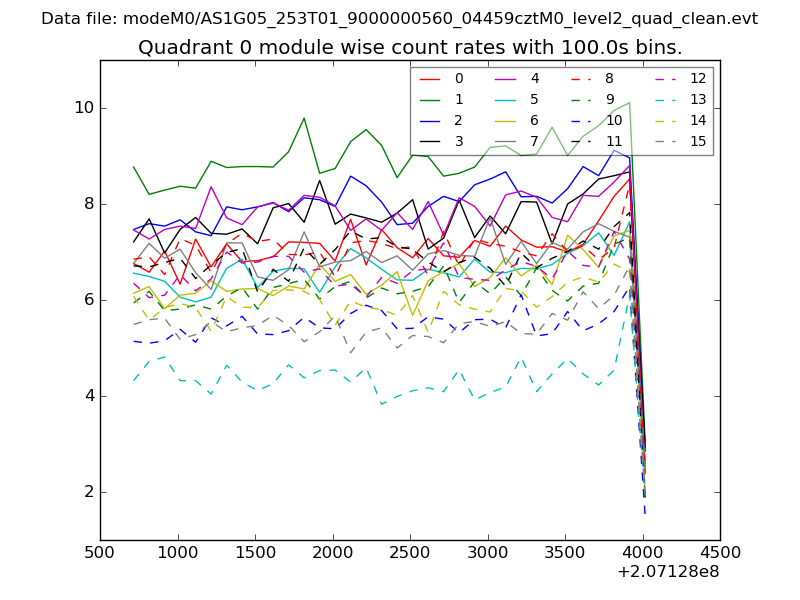 |
 |
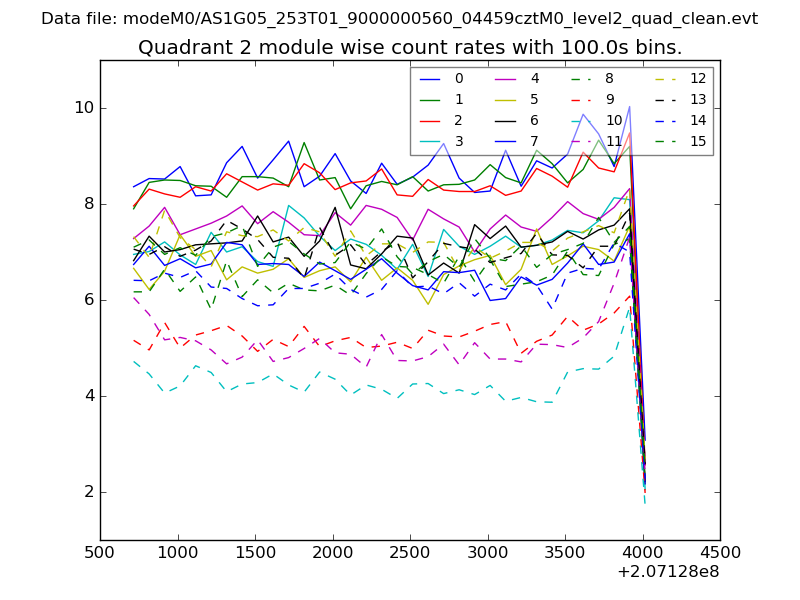
| Module-wise count rates for Quadrant B Data is divided into 100 sec bins |
 |
 |
| Module-wise count rates for Quadrant C Data is divided into 100 sec bins |
 |
 |
| Module-wise count rates for Quadrant D Data is divided into 100 sec bins |
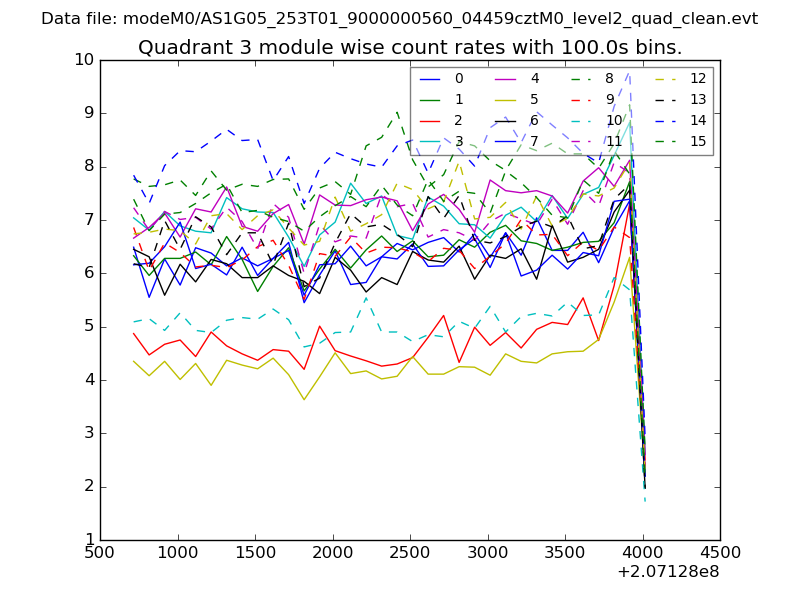 |
 |
| Parameter | Plot |
|---|---|
| CZT HV Monitor | 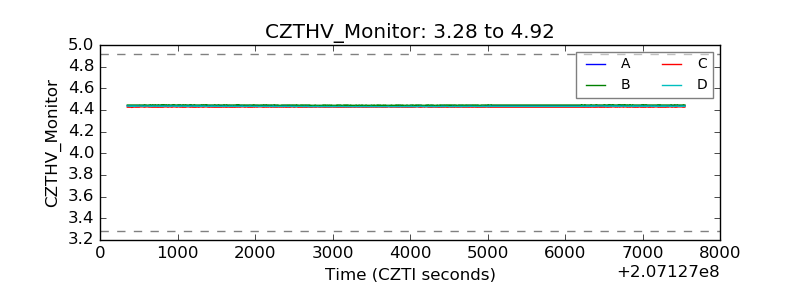 |
| D_VDD | 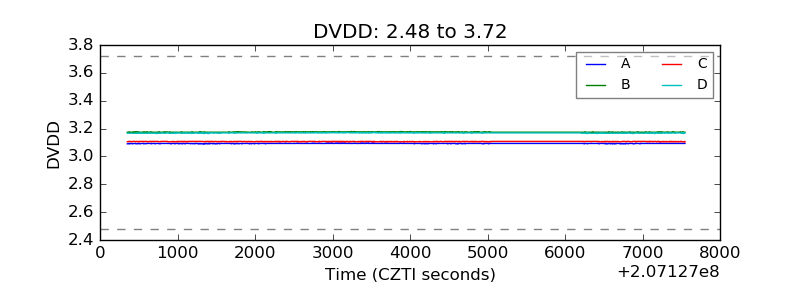 |
| Temperature 1 | 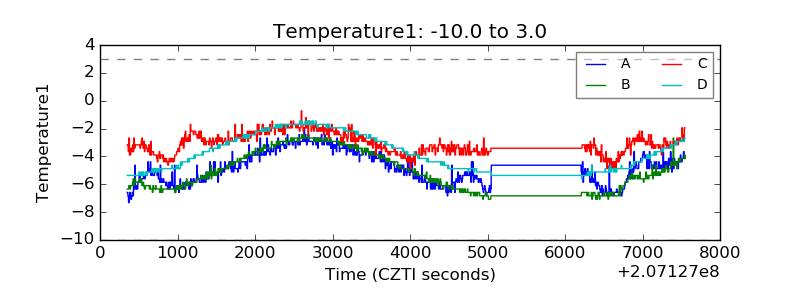 |
| Veto HV Monitor | 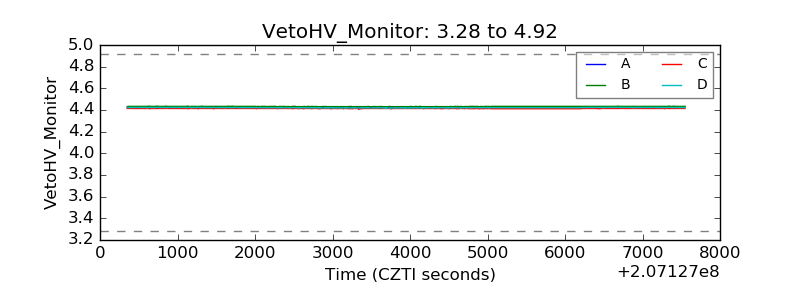 |
| Veto LLD | 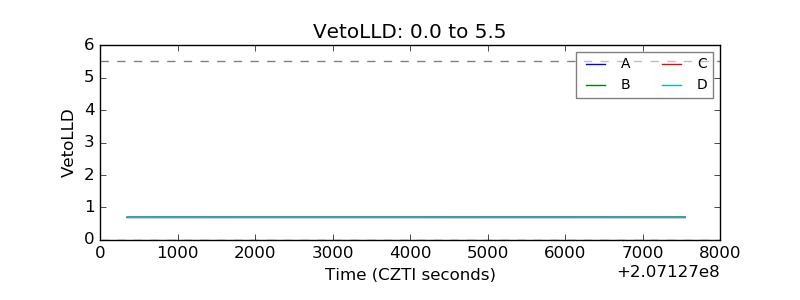 |
| Alpha Counter | 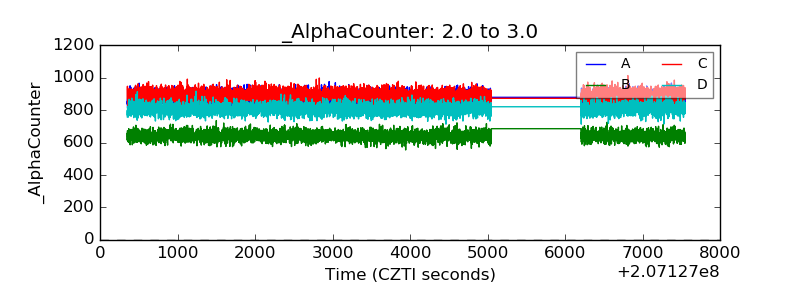 |
| _CPM_Rate | 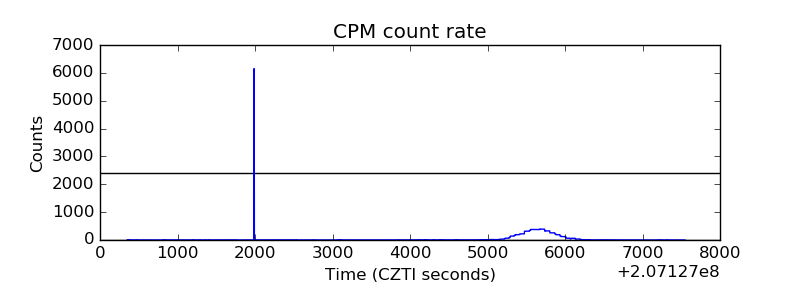 |
| CZT Counter | 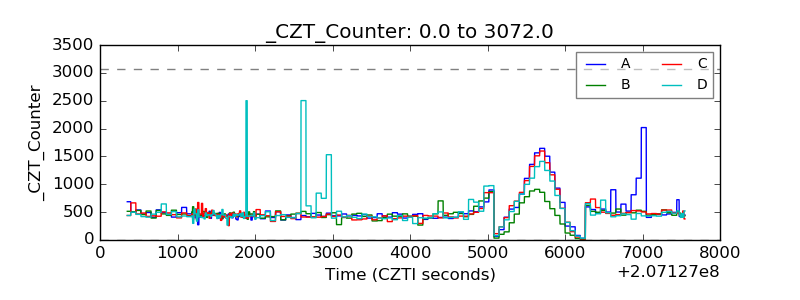 |
| +2.5 Volts monitor |  |
| +5 Volts monitor |  |
| _ROLL_ROT | 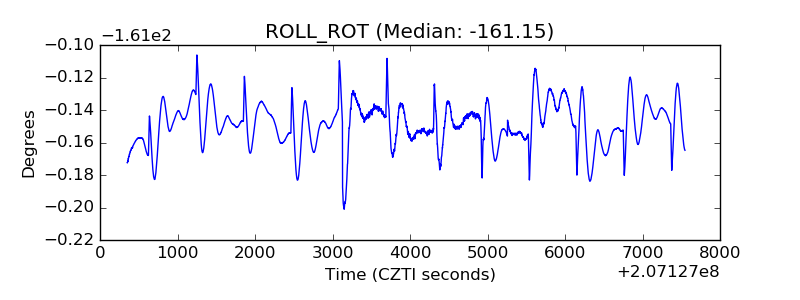 |
| _Roll_DEC | 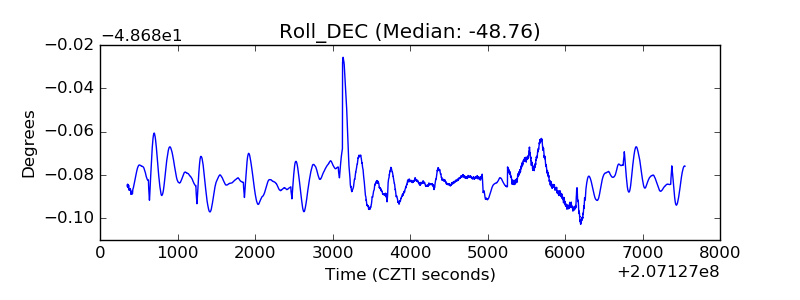 |
| _Roll_RA | 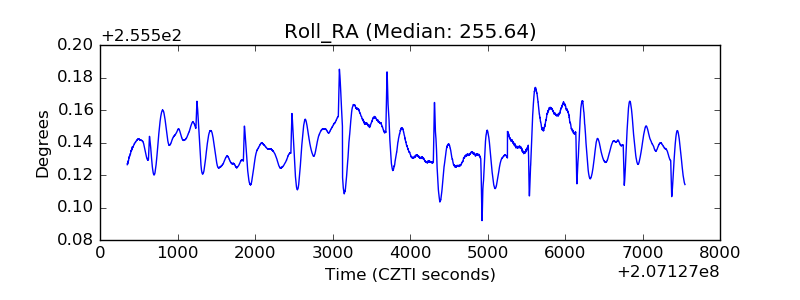 |
| Veto Counter | 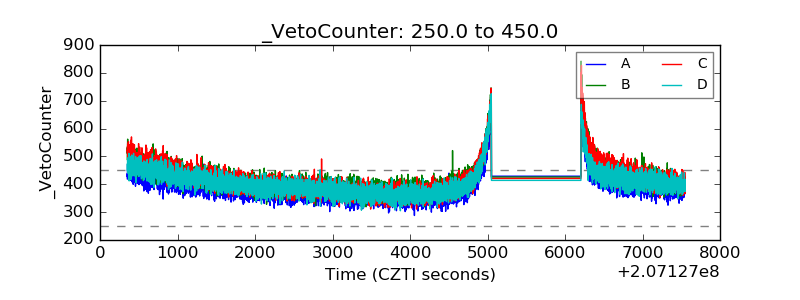 |