| Param | Original file | Final file |
|---|---|---|
| Filename | modeM0/AS1G05_253T01_9000000560_04461cztM0_level2.evt | modeM0/AS1G05_253T01_9000000560_04461cztM0_level2_quad_clean.evt |
| Size (bytes) | 469,019,520 | 80,101,440 |
| Size | 447.3 MB | 76.4 MB |
| Events in quadrant A | 3,338,704 | 480,785 |
| Events in quadrant B | 3,480,284 | 481,578 |
| Events in quadrant C | 3,401,545 | 487,388 |
| Events in quadrant D | 3,489,876 | 470,351 |
| Mode SS | |||
|---|---|---|---|
| Quadrant | BADHDUFLAG | Total packets | Discarded packets |
| A | 0 | 146 | 0 |
| B | 0 | 146 | 0 |
| C | 0 | 146 | 0 |
| D | 0 | 146 | 0 |
| Mode M9 | |||
|---|---|---|---|
| Quadrant | BADHDUFLAG | Total packets | Discarded packets |
| A | 0 | 5 | 0 |
| B | 0 | 5 | 0 |
| C | 0 | 5 | 0 |
| D | 0 | 5 | 0 |
| Mode M0 | |||
|---|---|---|---|
| Quadrant | BADHDUFLAG | Total packets | Discarded packets |
| A | 0 | 15052 | 3 |
| B | 0 | 15121 | 4 |
| C | 0 | 15172 | 2 |
| D | 0 | 15499 | 2 |
| Quadrant | Total seconds | Saturated seconds | Saturation percentage |
|---|---|---|---|
| A | 7263 | 175 | 2.409473% |
| B | 7262 | 167 | 2.299642% |
| C | 7263 | 126 | 1.734820% |
| D | 7264 | 152 | 2.092511% |
Noise dominated data is calculated using 1-second bins in cleaned event files. If a bin has >2000 counts, and if more than 50% of those come from <1% of pixels, then it is considered to be noise-dominated and hence unusable.
| Quadrant | # 1 sec bins | Bins with >0 counts | Bins with >2000 counts | High rate bins dominated by noise | Noise dominated (total time) | Noise dominated (detector-on time) | Marked lightcurve |
|---|---|---|---|---|---|---|---|
| A | 7713 | 7265 | 5 | 5 | 0.06% | 0.07% | 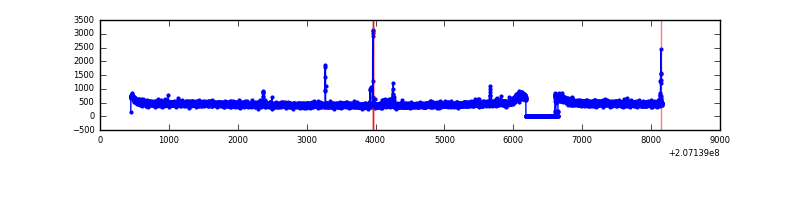 |
| B | 7713 | 7265 | 2 | 2 | 0.03% | 0.03% | 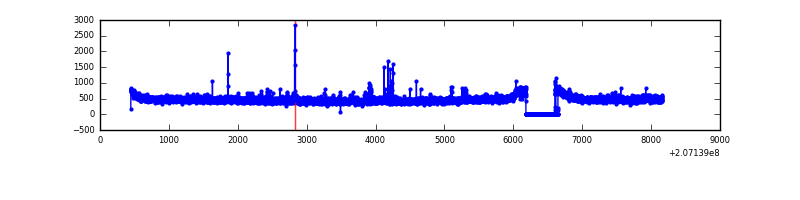 |
| C | 7713 | 7265 | 2 | 2 | 0.03% | 0.03% | 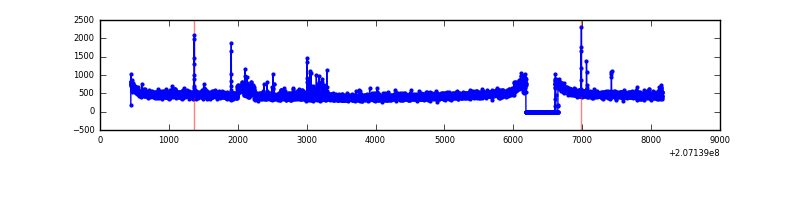 |
| D | 7714 | 7266 | 17 | 17 | 0.22% | 0.23% | 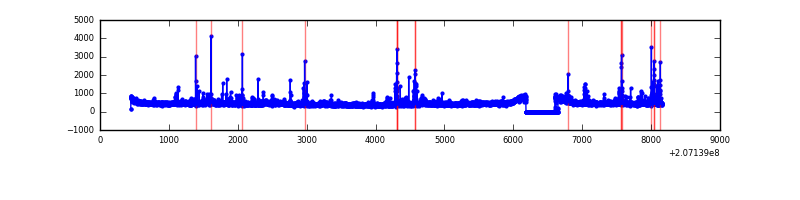 |
Top three noisy pixels from each quadrant. If the there are fewer than three noisy pixels in the level2.evt file, extra rows are filled as -1
| Pixel properties | Quadrant properties | ||||||
|---|---|---|---|---|---|---|---|
| Quadrant | DetID | PixID | Counts | Sigma | Mean | Median | Sigma |
| A | 0 | 13 | 44222 | 247.49 | 850 | 828 | 175.3 |
| A | 0 | 118 | 14952 | 80.55 | 850 | 828 | 175.3 |
| A | 0 | 226 | 9818 | 51.27 | 850 | 828 | 175.3 |
| B | 4 | 170 | 40710 | 240.8 | 859 | 836 | 165.6 |
| B | 15 | 185 | 35961 | 212.12 | 859 | 836 | 165.6 |
| B | 4 | 48 | 23280 | 135.54 | 859 | 836 | 165.6 |
| C | 14 | 48 | 64710 | 329.95 | 832 | 834 | 193.6 |
| C | 9 | 16 | 44756 | 226.88 | 832 | 834 | 193.6 |
| C | 10 | 65 | 22214 | 110.44 | 832 | 834 | 193.6 |
| D | 13 | 235 | 105159 | 524.8 | 828 | 802 | 198.9 |
| D | 2 | 136 | 48320 | 238.96 | 828 | 802 | 198.9 |
| D | 2 | 63 | 43593 | 215.19 | 828 | 802 | 198.9 |
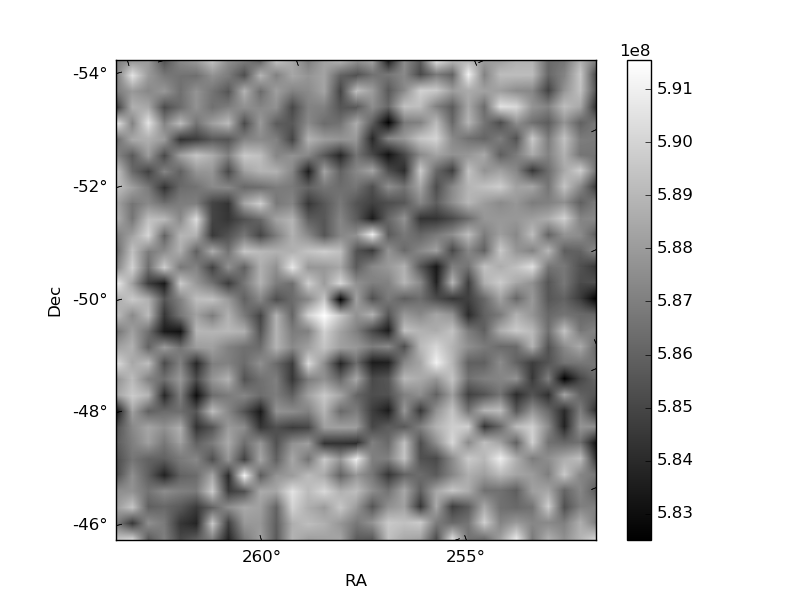
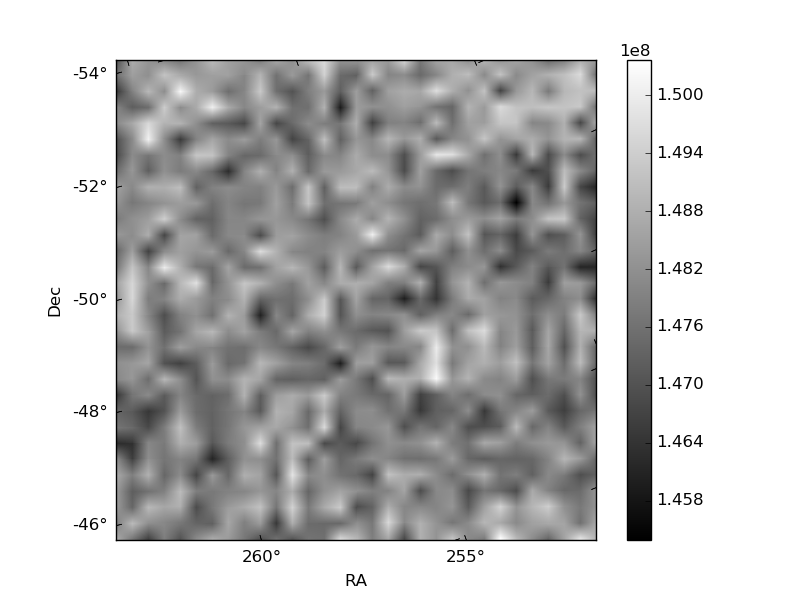
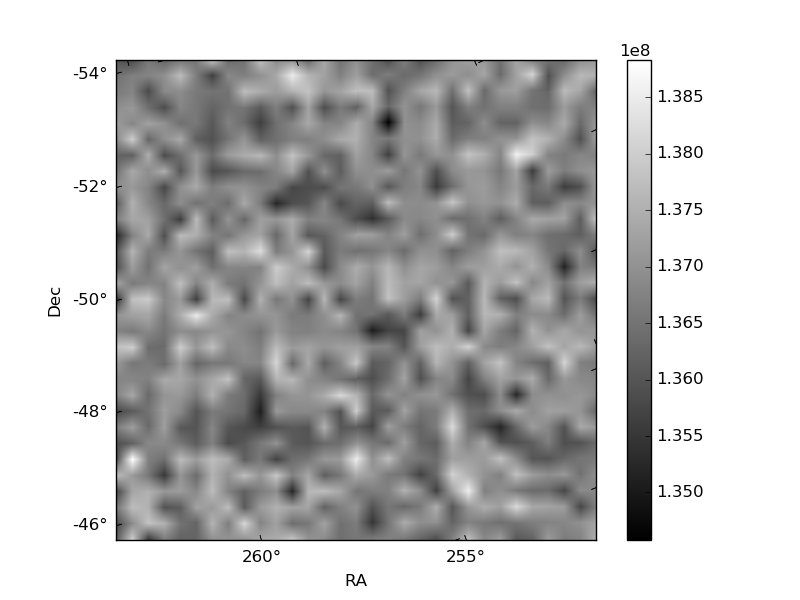
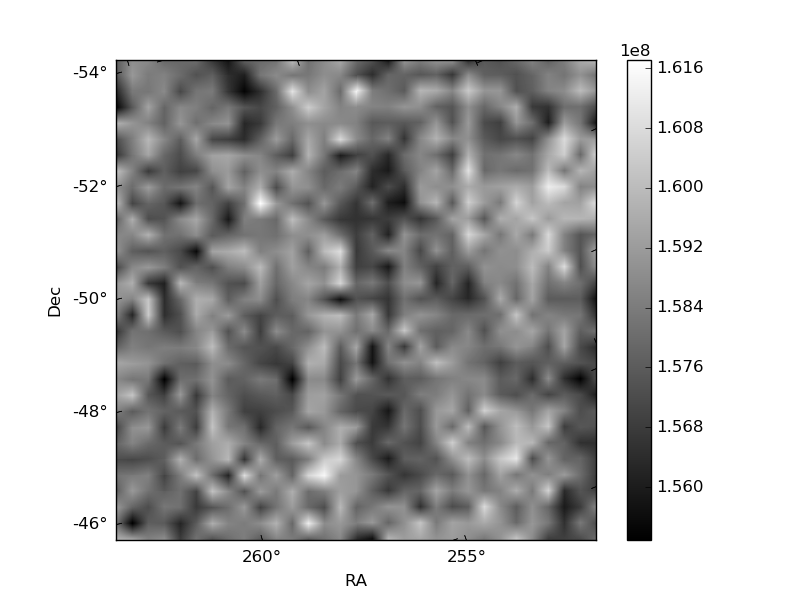
Histogram calculated using DETX and DETY for each event in the final _common_clean file
| Quadrant A | 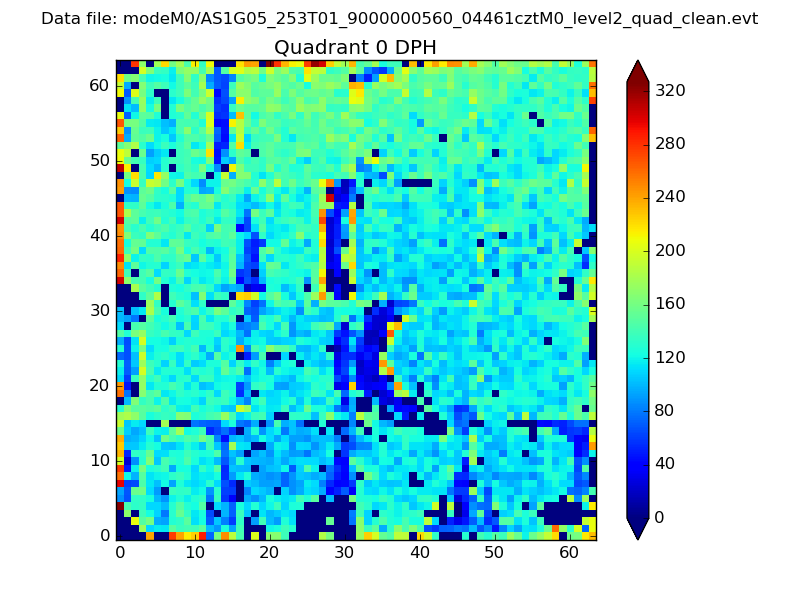 |
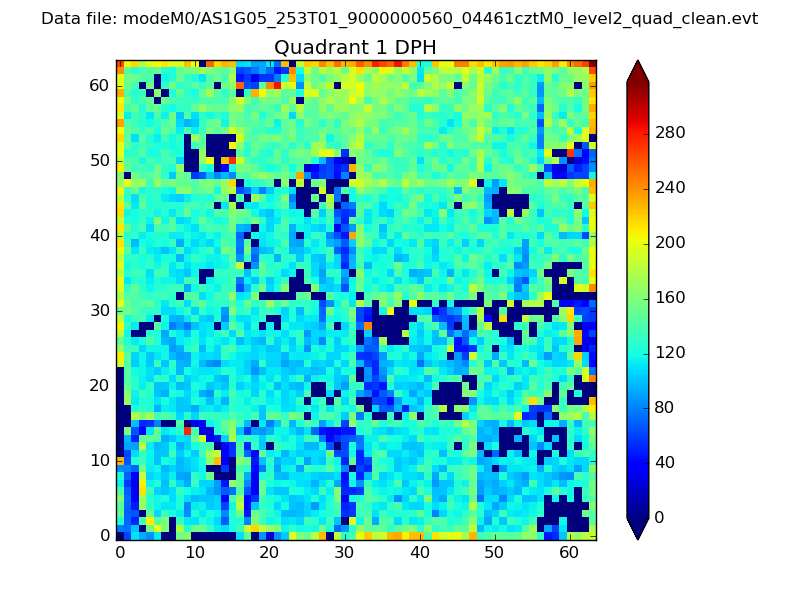 |
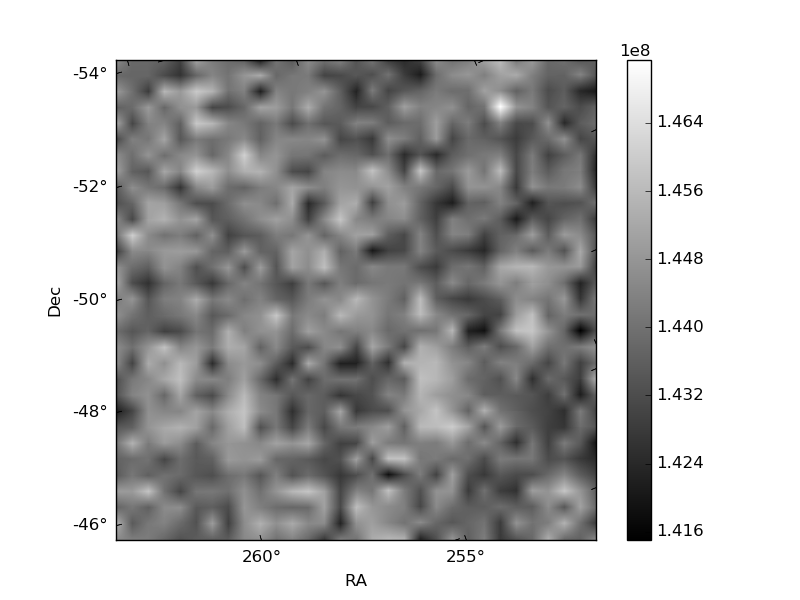
Quadrant B |
|---|---|---|---|
| Quadrant D | 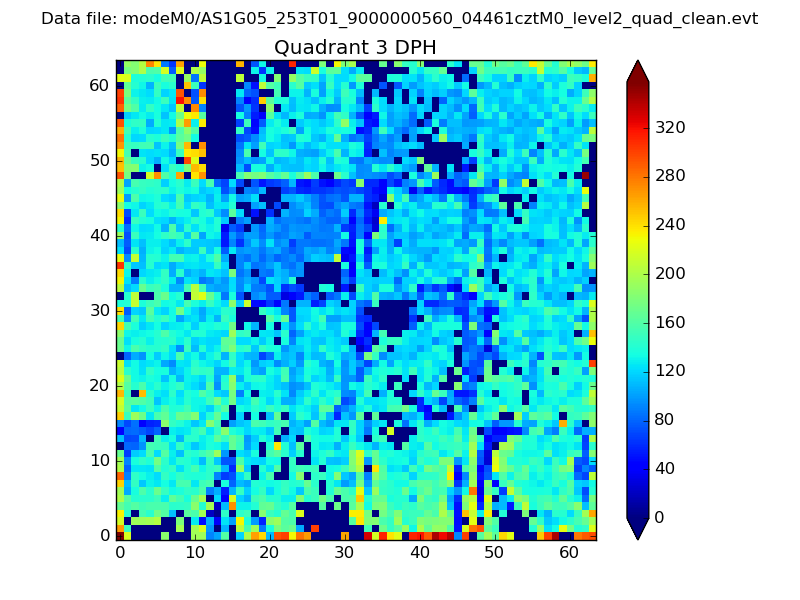 |
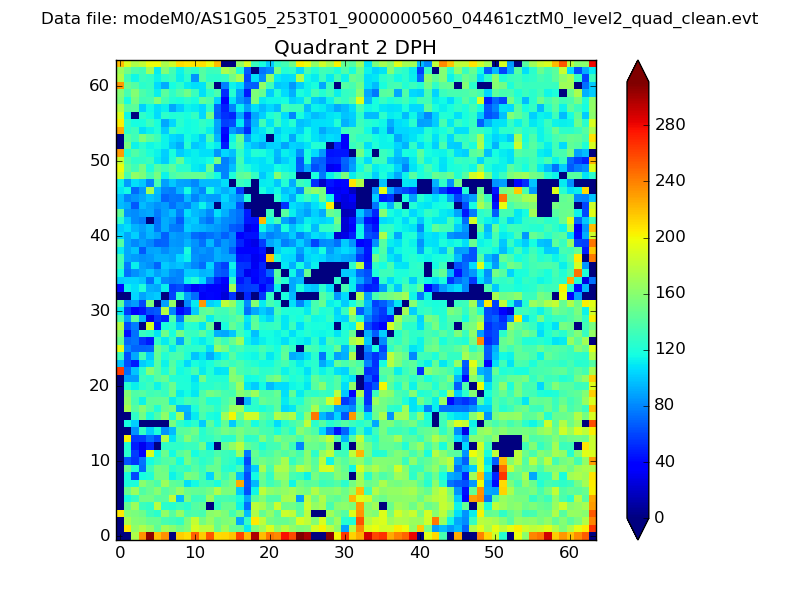 |
Quadrant C |
| Plot type | Count rate plots | Images |
|---|---|---|
| Comparison with Poisson distribution Blue bars denote a histogram of data divided into 1 sec bins. Red curve is a Poisson curve with rate = median count rate of data. |
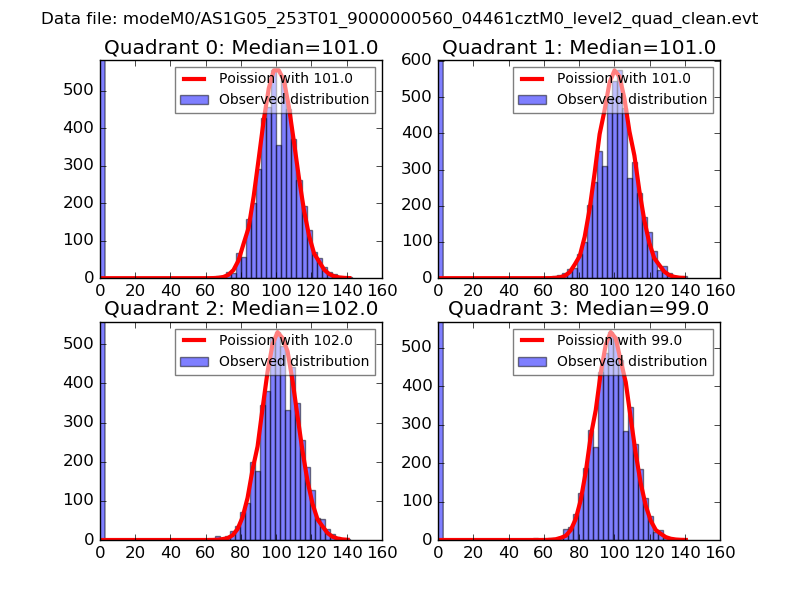 |
 |
| Quadrant-wise count rates Data is divided into 100 sec bins |
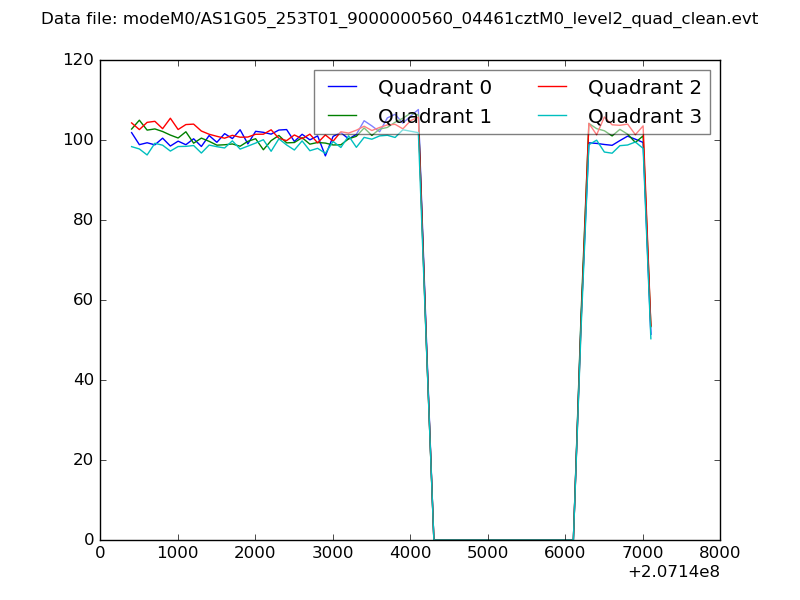 |
|
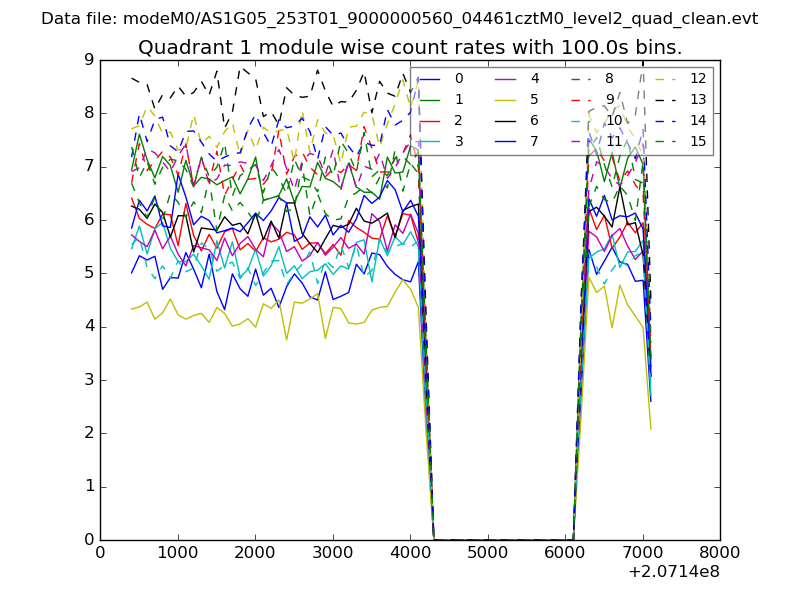
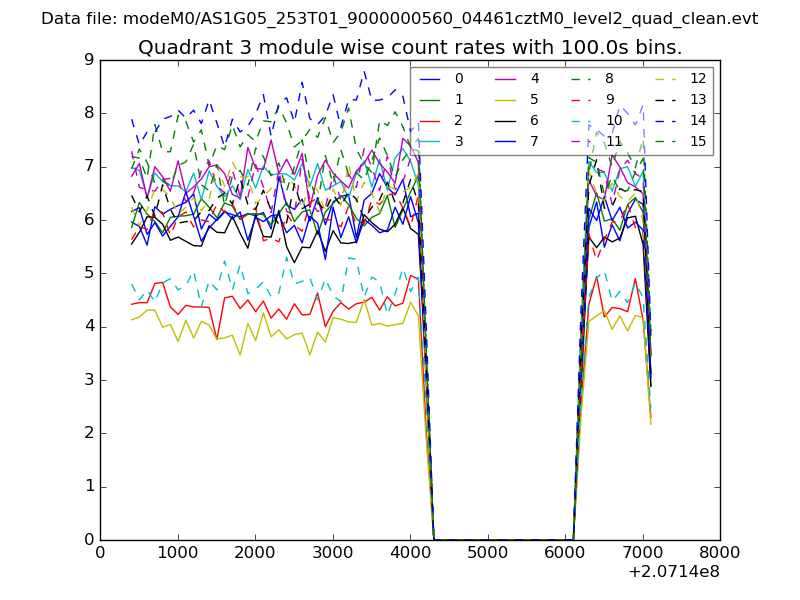
| Module-wise count rates for Quadrant A Data is divided into 100 sec bins |
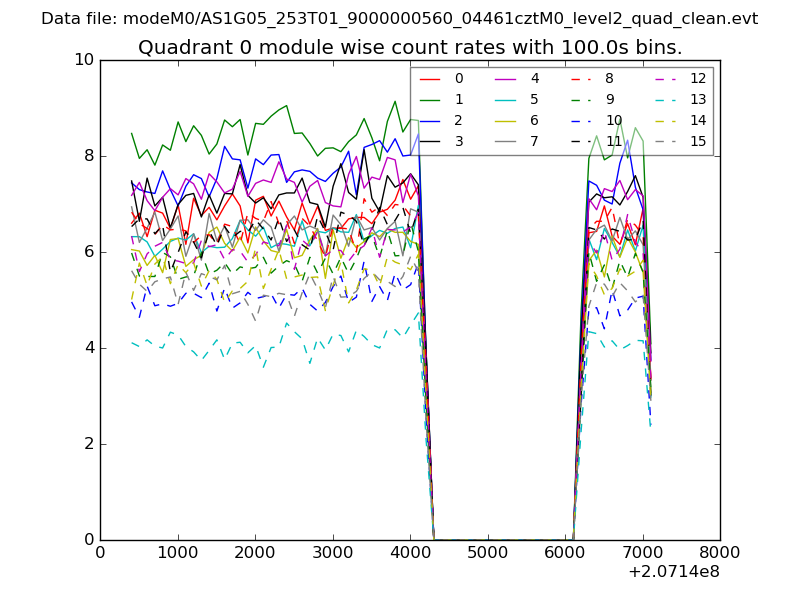 |
 |
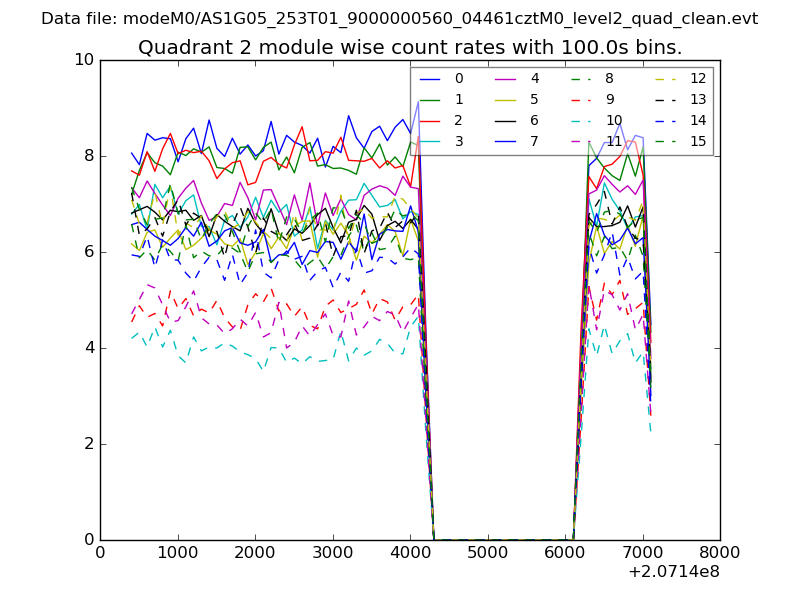
| Module-wise count rates for Quadrant B Data is divided into 100 sec bins |
 |
 |
| Module-wise count rates for Quadrant C Data is divided into 100 sec bins |
 |
 |
| Module-wise count rates for Quadrant D Data is divided into 100 sec bins |
 |
 |
| Parameter | Plot |
|---|---|
| CZT HV Monitor | 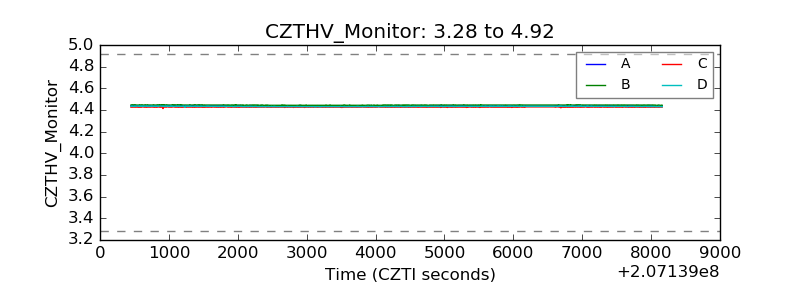 |
| D_VDD | 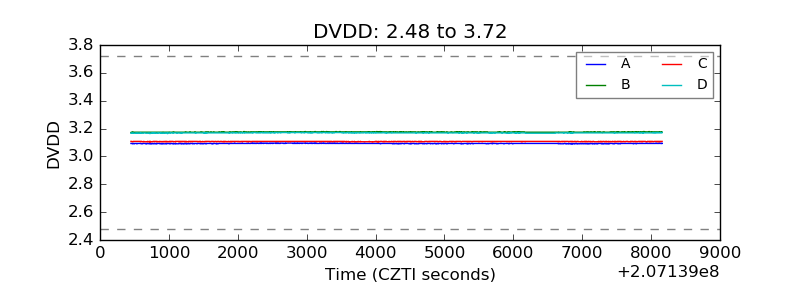 |
| Temperature 1 | 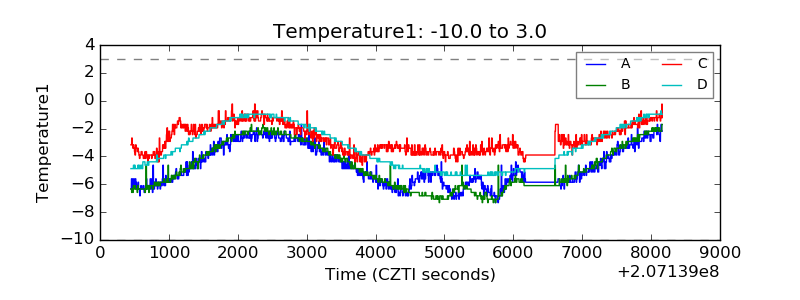 |
| Veto HV Monitor | 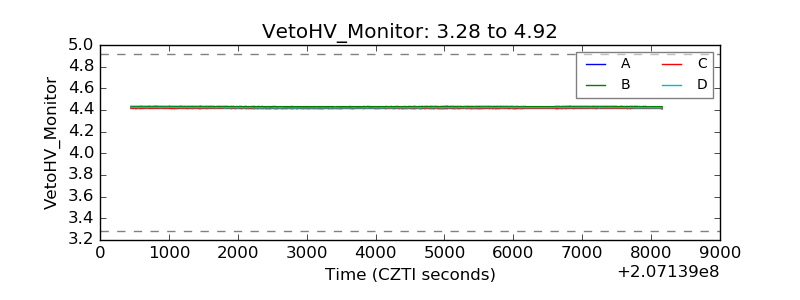 |
| Veto LLD | 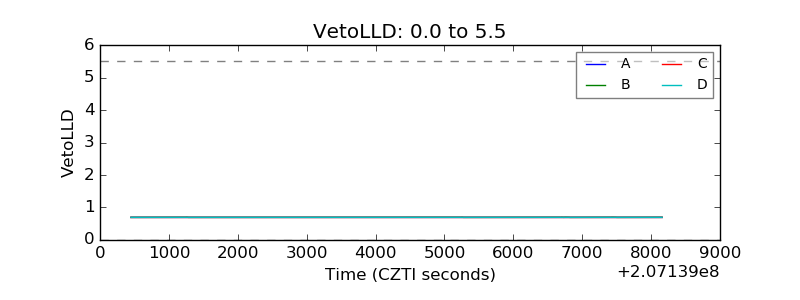 |
| Alpha Counter | 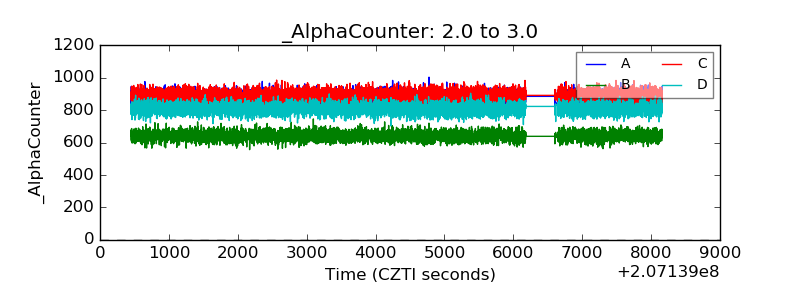 |
| _CPM_Rate | 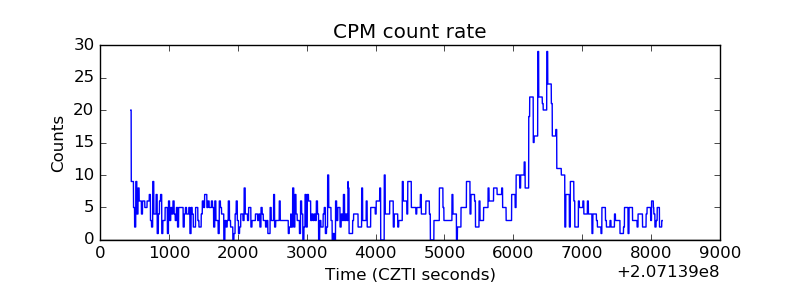 |
| CZT Counter | 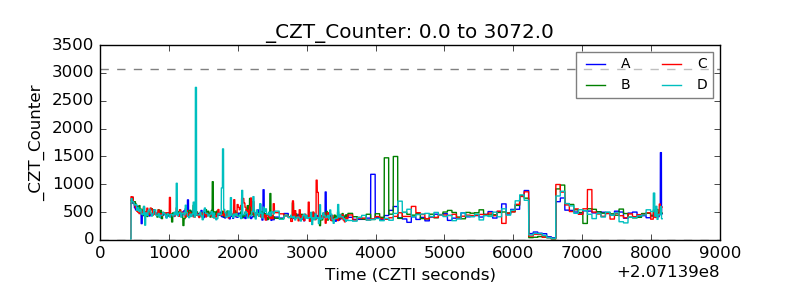 |
| +2.5 Volts monitor | 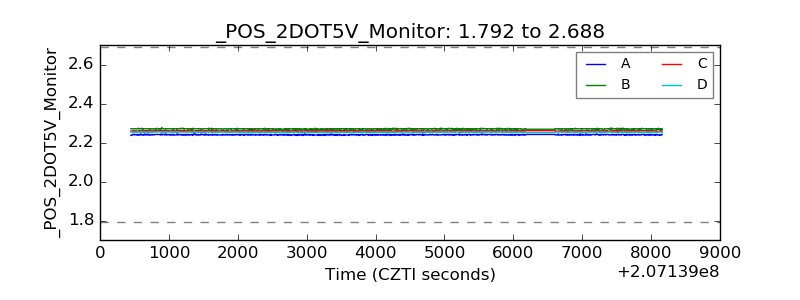 |
| +5 Volts monitor | 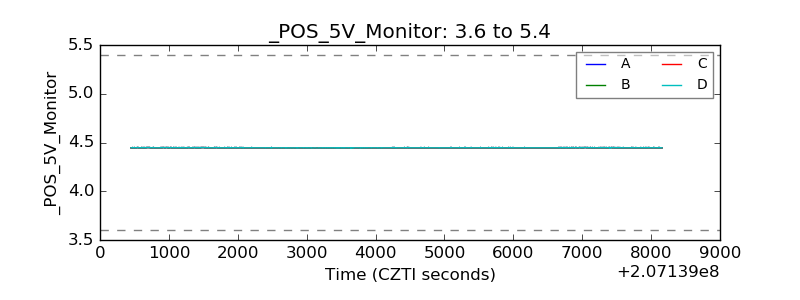 |
| _ROLL_ROT | 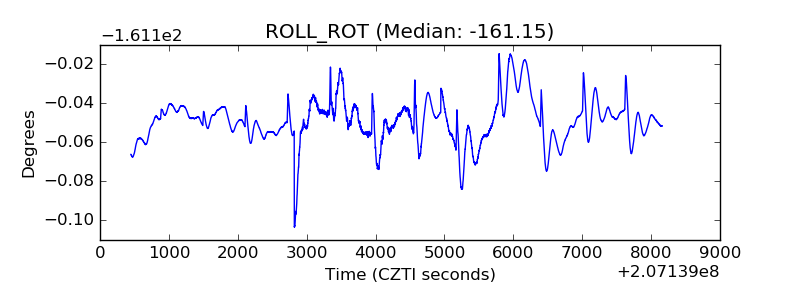 |
| _Roll_DEC | 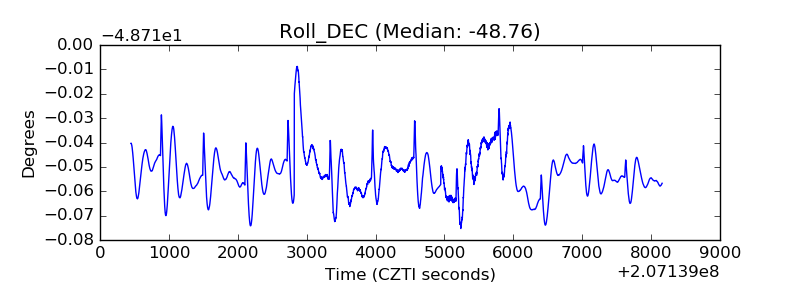 |
| _Roll_RA | 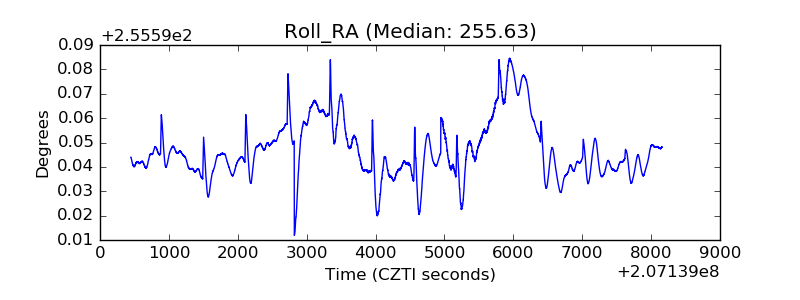 |
| Veto Counter | 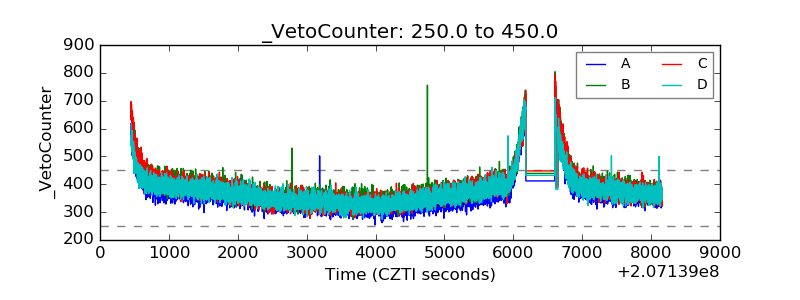 |