| Param | Original file | Final file |
|---|---|---|
| Filename | modeM0/AS1G05_253T01_9000000560_04462cztM0_level2.evt | modeM0/AS1G05_253T01_9000000560_04462cztM0_level2_quad_clean.evt |
| Size (bytes) | 485,827,200 | 84,317,760 |
| Size | 463.3 MB | 80.4 MB |
| Events in quadrant A | 3,385,499 | 511,644 |
| Events in quadrant B | 3,647,921 | 511,650 |
| Events in quadrant C | 3,391,459 | 516,001 |
| Events in quadrant D | 3,782,233 | 496,061 |
| Mode SS | |||
|---|---|---|---|
| Quadrant | BADHDUFLAG | Total packets | Discarded packets |
| A | 0 | 152 | 0 |
| B | 0 | 152 | 0 |
| C | 0 | 152 | 2 |
| D | 0 | 152 | 0 |
| Mode M9 | |||
|---|---|---|---|
| Quadrant | BADHDUFLAG | Total packets | Discarded packets |
| A | 0 | 1 | 0 |
| B | 0 | 1 | 0 |
| C | 0 | 1 | 0 |
| D | 0 | 1 | 0 |
| Mode M0 | |||
|---|---|---|---|
| Quadrant | BADHDUFLAG | Total packets | Discarded packets |
| A | 0 | 15441 | 103 |
| B | 0 | 15743 | 82 |
| C | 0 | 15498 | 83 |
| D | 0 | 16573 | 113 |
| Quadrant | Total seconds | Saturated seconds | Saturation percentage |
|---|---|---|---|
| A | 7433 | 149 | 2.004574% |
| B | 7444 | 148 | 1.988178% |
| C | 7443 | 66 | 0.886739% |
| D | 7439 | 130 | 1.747547% |
Noise dominated data is calculated using 1-second bins in cleaned event files. If a bin has >2000 counts, and if more than 50% of those come from <1% of pixels, then it is considered to be noise-dominated and hence unusable.
| Quadrant | # 1 sec bins | Bins with >0 counts | Bins with >2000 counts | High rate bins dominated by noise | Noise dominated (total time) | Noise dominated (detector-on time) | Marked lightcurve |
|---|---|---|---|---|---|---|---|
| A | 7614 | 7485 | 1 | 1 | 0.01% | 0.01% | 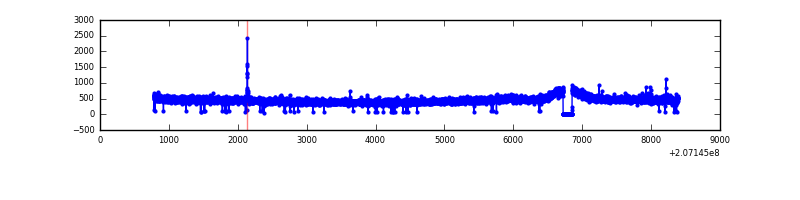 |
| B | 7614 | 7482 | 1 | 1 | 0.01% | 0.01% | 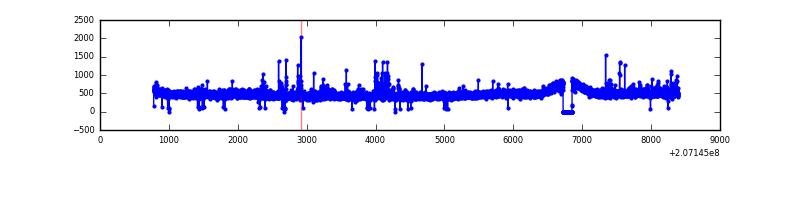 |
| C | 7614 | 7485 | 3 | 3 | 0.04% | 0.04% | 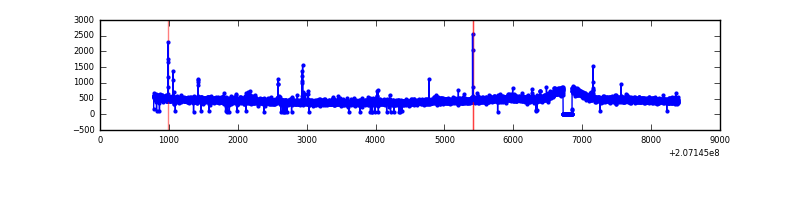 |
| D | 7614 | 7484 | 44 | 44 | 0.58% | 0.59% | 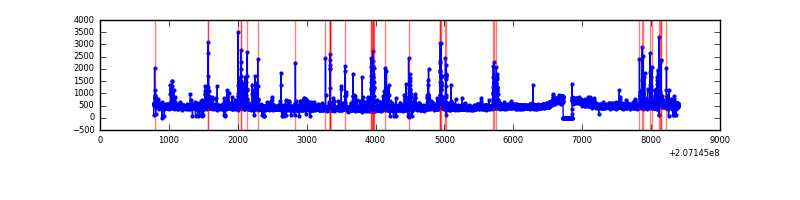 |
Top three noisy pixels from each quadrant. If the there are fewer than three noisy pixels in the level2.evt file, extra rows are filled as -1
| Pixel properties | Quadrant properties | ||||||
|---|---|---|---|---|---|---|---|
| Quadrant | DetID | PixID | Counts | Sigma | Mean | Median | Sigma |
| A | 0 | 118 | 13156 | 68.47 | 871 | 850 | 179.7 |
| A | 0 | 226 | 9784 | 49.71 | 871 | 850 | 179.7 |
| A | 12 | 194 | 8739 | 43.89 | 871 | 850 | 179.7 |
| B | 14 | 167 | 79126 | 462.85 | 881 | 860 | 169.1 |
| B | 15 | 204 | 39657 | 229.44 | 881 | 860 | 169.1 |
| B | 15 | 185 | 39535 | 228.72 | 881 | 860 | 169.1 |
| C | 9 | 247 | 27791 | 136.74 | 849 | 851 | 197.0 |
| C | 9 | 16 | 24471 | 119.89 | 849 | 851 | 197.0 |
| C | 14 | 48 | 13975 | 66.61 | 849 | 851 | 197.0 |
| D | 13 | 235 | 223384 | 1082.73 | 845 | 818 | 205.6 |
| D | 2 | 63 | 99043 | 477.84 | 845 | 818 | 205.6 |
| D | 12 | 227 | 89701 | 432.39 | 845 | 818 | 205.6 |
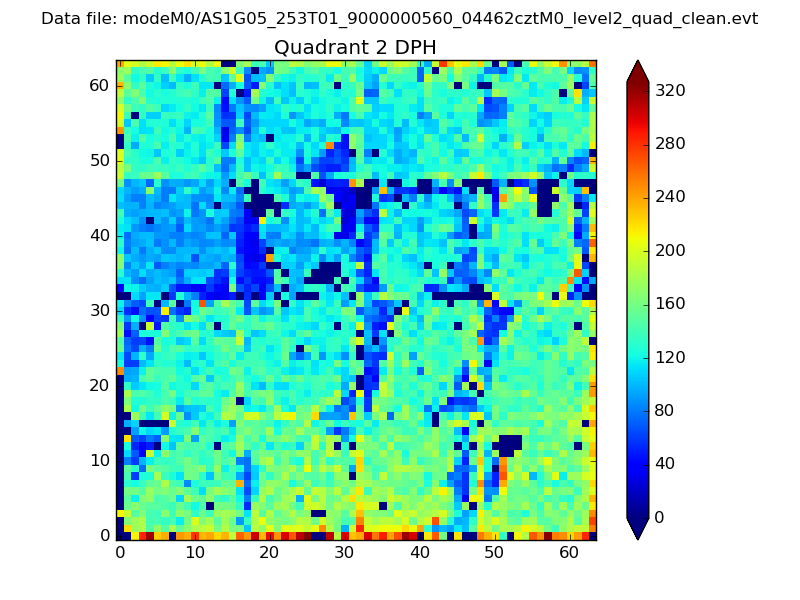
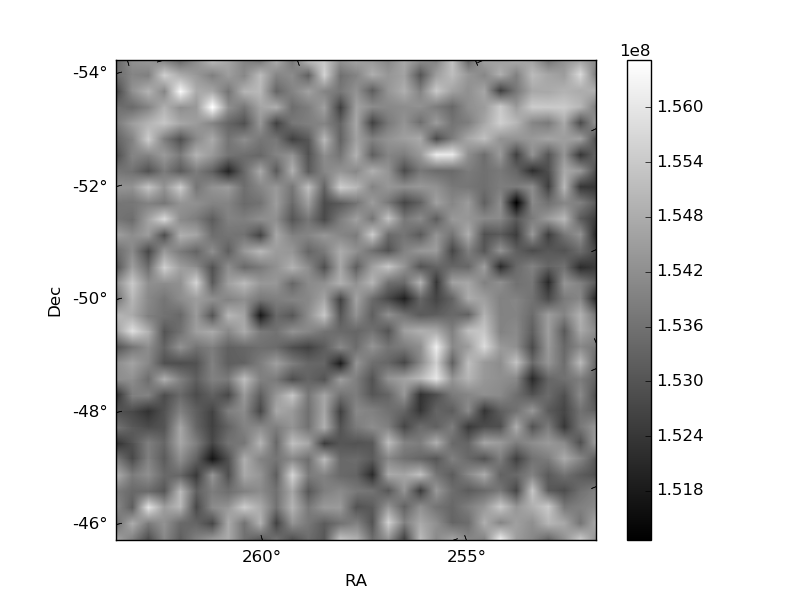
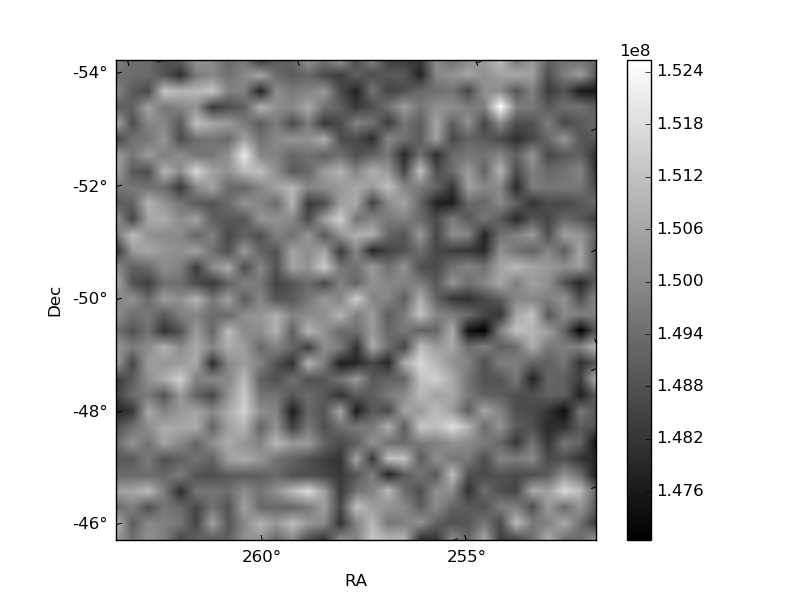
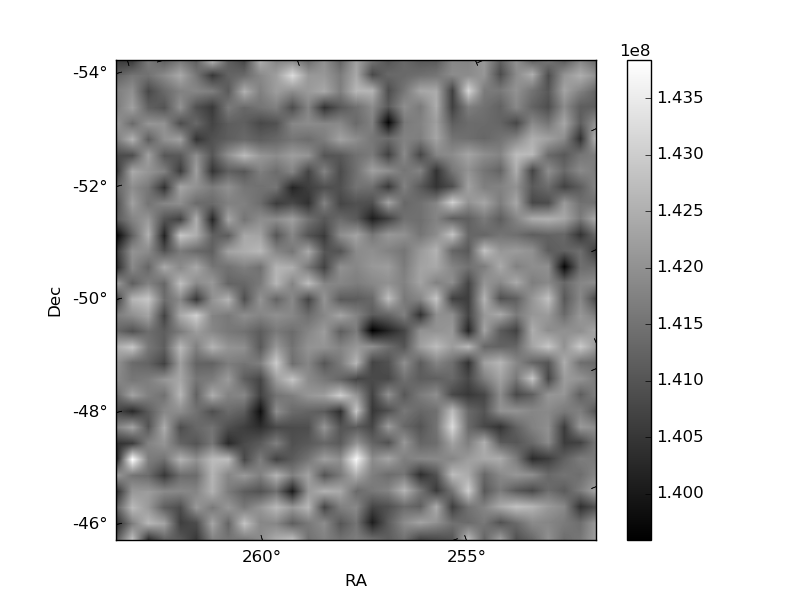
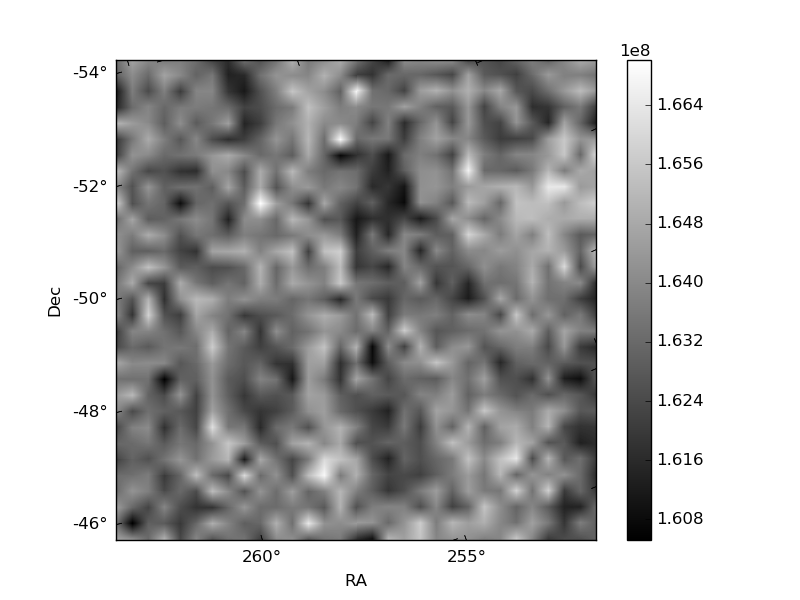
Histogram calculated using DETX and DETY for each event in the final _common_clean file
| Quadrant A | 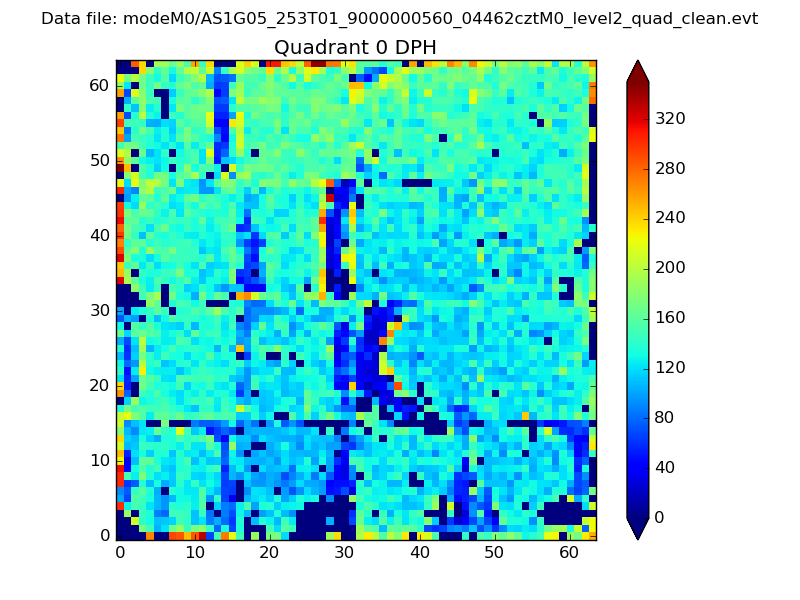 |
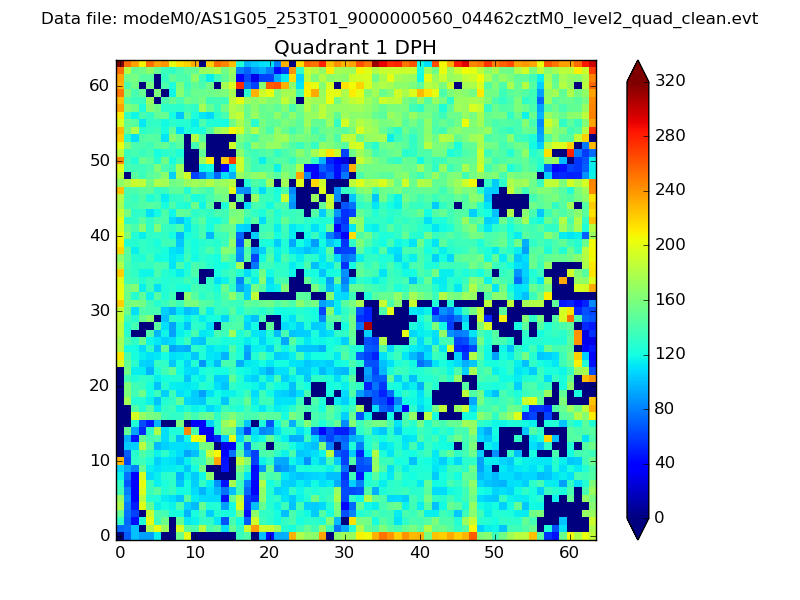 |
Quadrant B |
|---|---|---|---|
| Quadrant D | 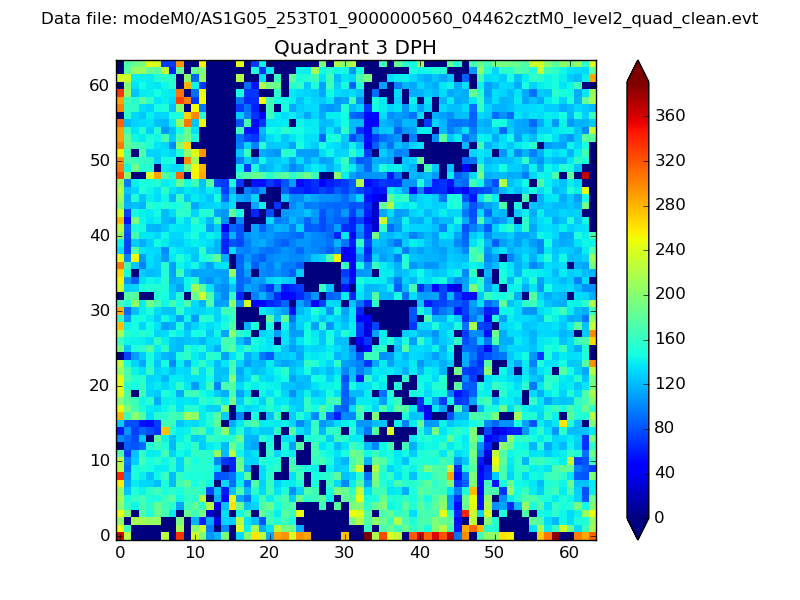 |
 |
Quadrant C |
| Plot type | Count rate plots | Images |
|---|---|---|
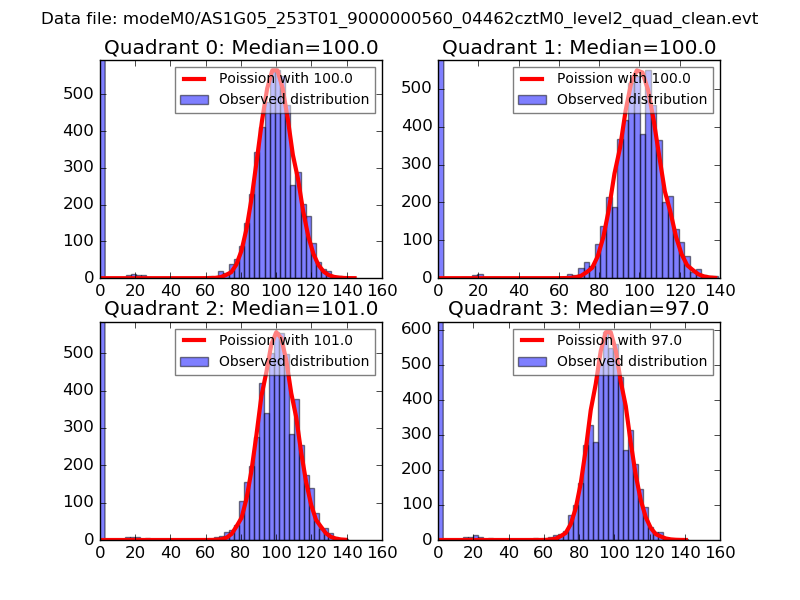
| Comparison with Poisson distribution Blue bars denote a histogram of data divided into 1 sec bins. Red curve is a Poisson curve with rate = median count rate of data. |
 |
 |
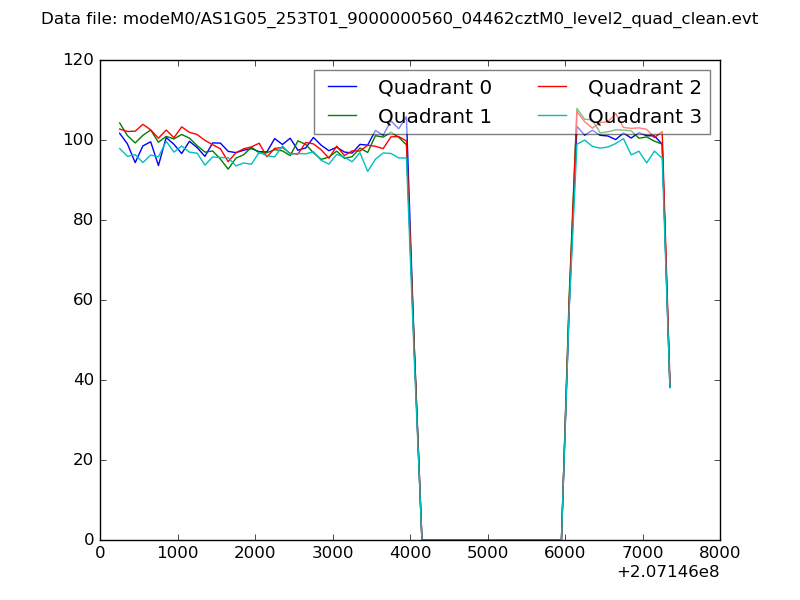
| Quadrant-wise count rates Data is divided into 100 sec bins |
 |
|
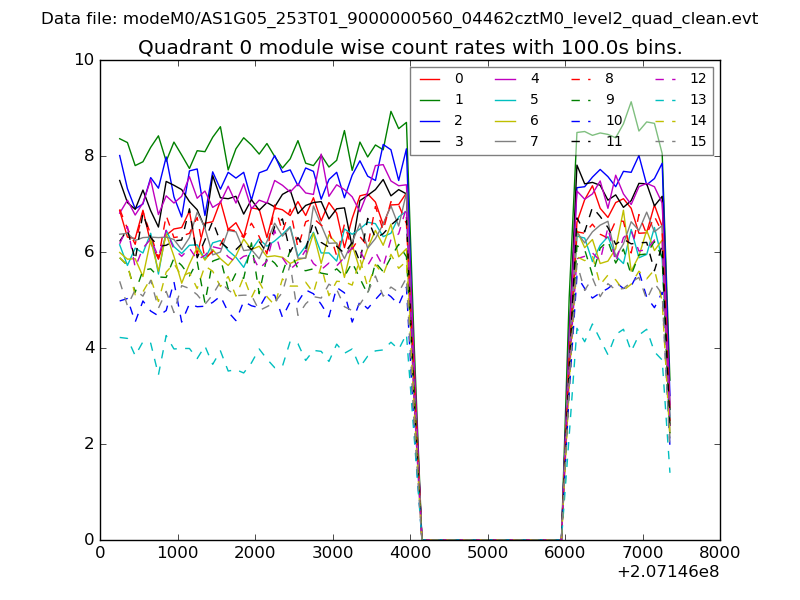
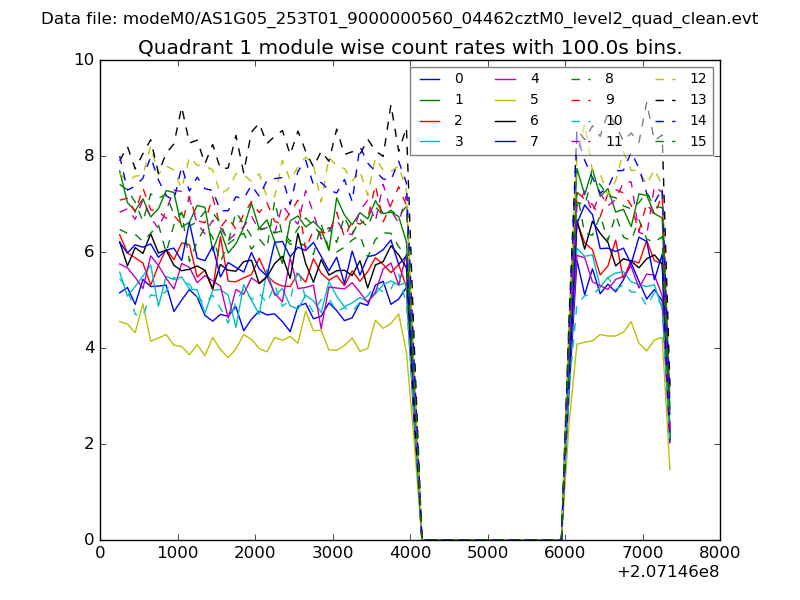
| Module-wise count rates for Quadrant A Data is divided into 100 sec bins |
 |
 |
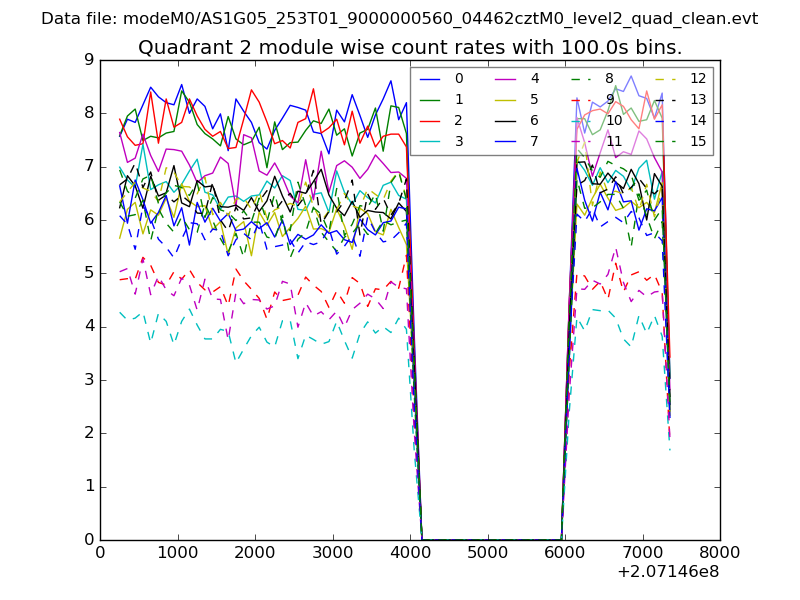
| Module-wise count rates for Quadrant B Data is divided into 100 sec bins |
 |
 |
| Module-wise count rates for Quadrant C Data is divided into 100 sec bins |
 |
 |
| Module-wise count rates for Quadrant D Data is divided into 100 sec bins |
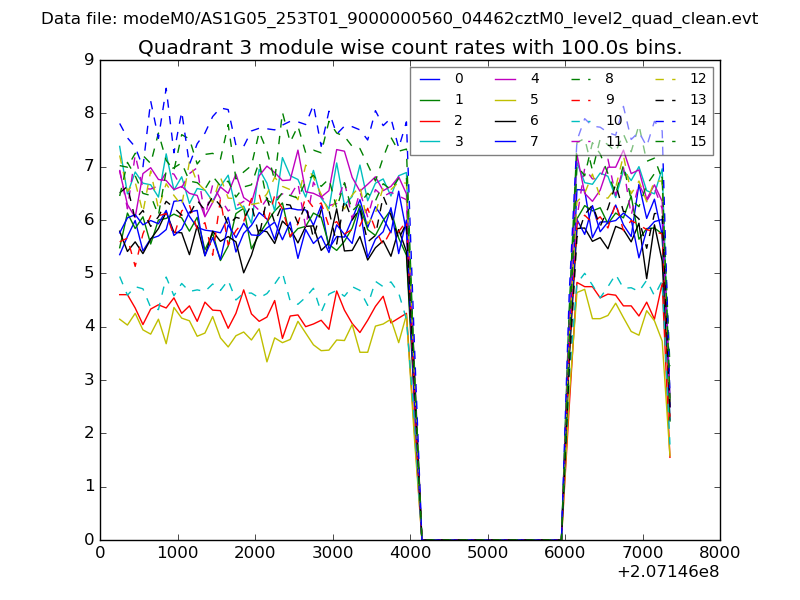 |
 |
| Parameter | Plot |
|---|---|
| CZT HV Monitor | 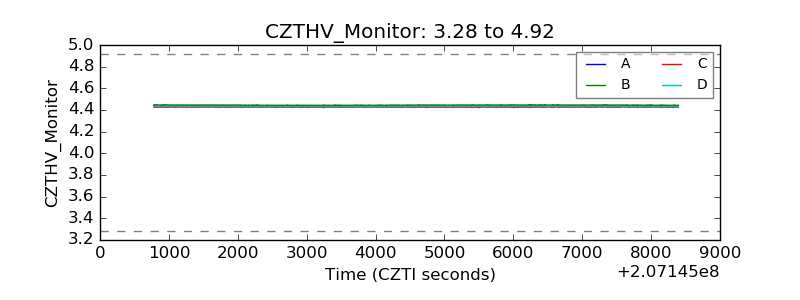 |
| D_VDD | 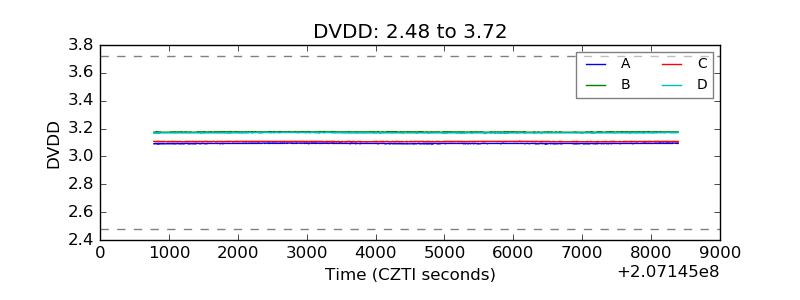 |
| Temperature 1 | 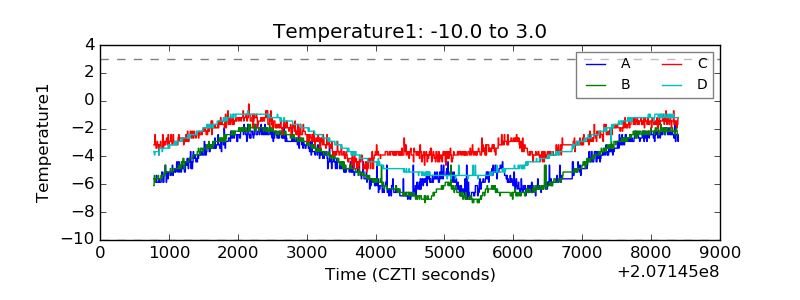 |
| Veto HV Monitor | 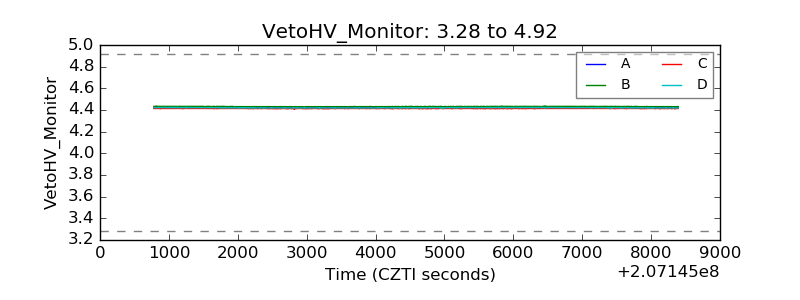 |
| Veto LLD | 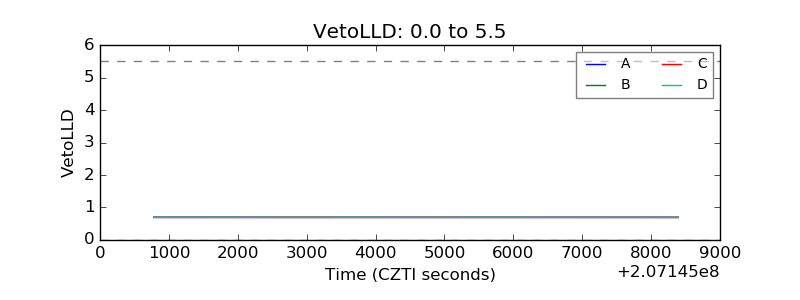 |
| Alpha Counter | 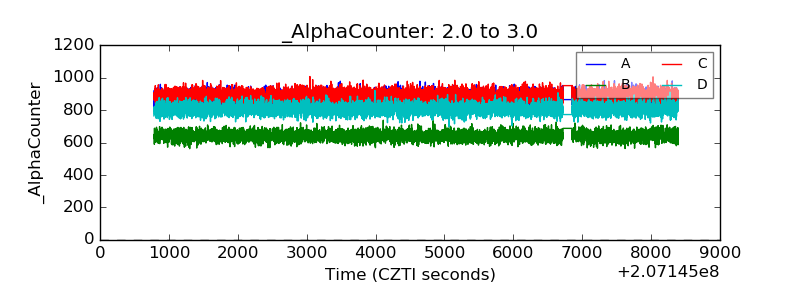 |
| _CPM_Rate | 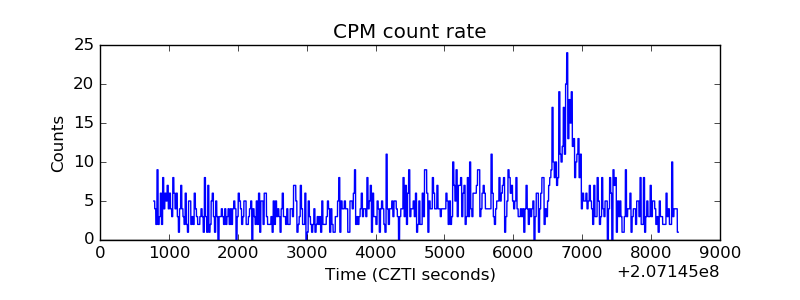 |
| CZT Counter | 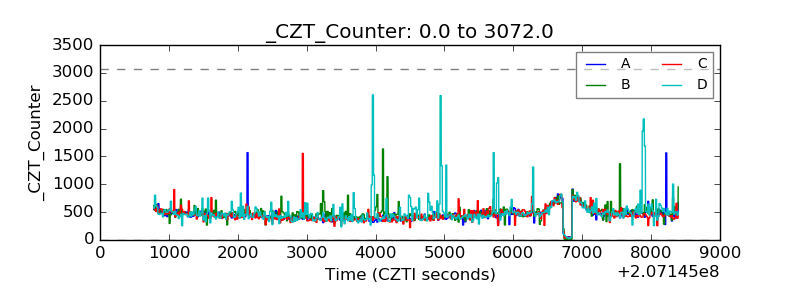 |
| +2.5 Volts monitor |  |
| +5 Volts monitor |  |
| _ROLL_ROT | 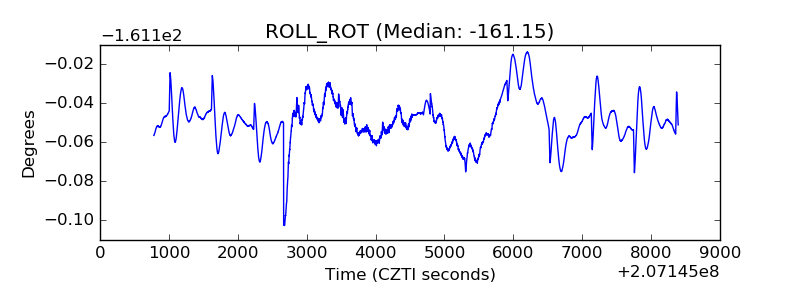 |
| _Roll_DEC | 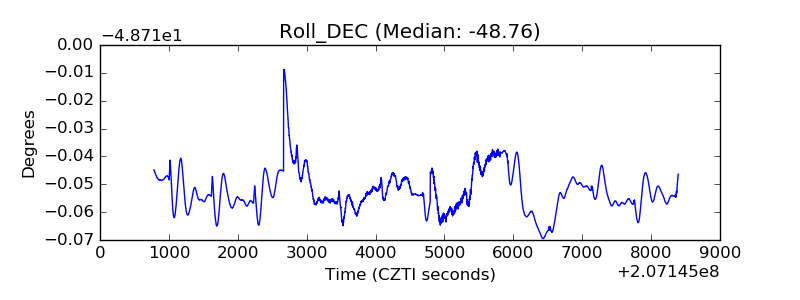 |
| _Roll_RA | 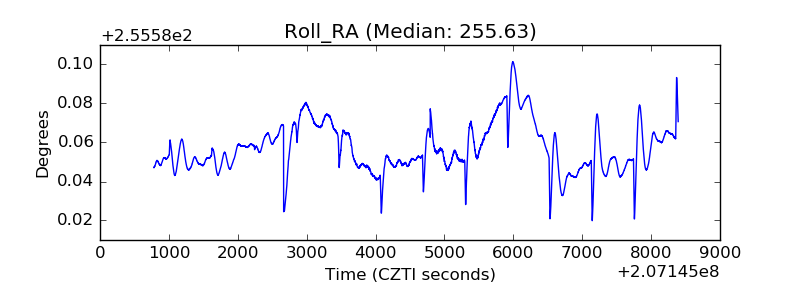 |
| Veto Counter | 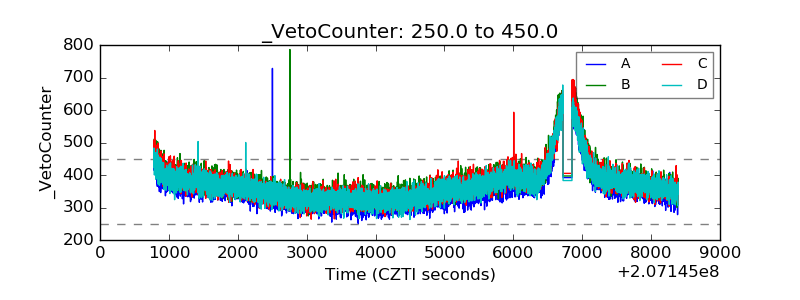 |