| Param | Original file | Final file |
|---|---|---|
| Filename | modeM0/AS1G05_253T01_9000000560_04466cztM0_level2.evt | modeM0/AS1G05_253T01_9000000560_04466cztM0_level2_quad_clean.evt |
| Size (bytes) | 11,646,720 | 2,753,280 |
| Size | 11.1 MB | 2.6 MB |
| Events in quadrant A | 90,828 | 18,200 |
| Events in quadrant B | 78,300 | 12,233 |
| Events in quadrant C | 82,517 | 15,695 |
| Events in quadrant D | 86,189 | 16,895 |
| Mode SS | |||
|---|---|---|---|
| Quadrant | BADHDUFLAG | Total packets | Discarded packets |
| A | 0 | 357 | 357 |
| B | 0 | 351 | 345 |
| C | 0 | 353 | 350 |
| D | 0 | 357 | 353 |
| Mode M9 | |||
|---|---|---|---|
| Quadrant | BADHDUFLAG | Total packets | Discarded packets |
| A | 0 | 16 | 15 |
| B | 0 | 18 | 16 |
| C | 0 | 17 | 15 |
| D | 0 | 21 | 20 |
| Mode M0 | |||
|---|---|---|---|
| Quadrant | BADHDUFLAG | Total packets | Discarded packets |
| A | 0 | 37460 | 37058 |
| B | 0 | 38419 | 38094 |
| C | 0 | 36057 | 35688 |
| D | 0 | 38984 | 38591 |
| Quadrant | Total seconds | Saturated seconds | Saturation percentage |
|---|---|---|---|
| A | 198 | 1 | 0.505051% |
| B | 158 | 1 | 0.632911% |
| C | 185 | 2 | 1.081081% |
| D | 195 | 1 | 0.512821% |
Noise dominated data is calculated using 1-second bins in cleaned event files. If a bin has >2000 counts, and if more than 50% of those come from <1% of pixels, then it is considered to be noise-dominated and hence unusable.
| Quadrant | # 1 sec bins | Bins with >0 counts | Bins with >2000 counts | High rate bins dominated by noise | Noise dominated (total time) | Noise dominated (detector-on time) | Marked lightcurve |
|---|---|---|---|---|---|---|---|
| A | 18595 | 374 | 0 | 0 | 0.00% | 0.00% | 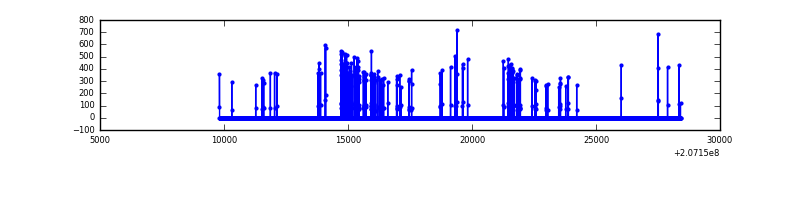 |
| B | 16886 | 301 | 0 | 0 | 0.00% | 0.00% | 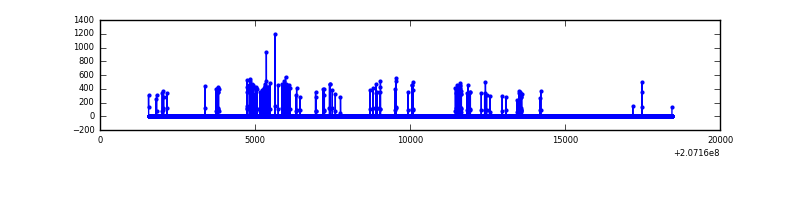 |
| C | 17183 | 355 | 0 | 0 | 0.00% | 0.00% | 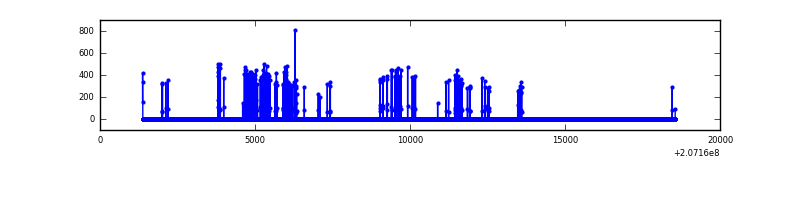 |
| D | 17122 | 372 | 0 | 0 | 0.00% | 0.00% | 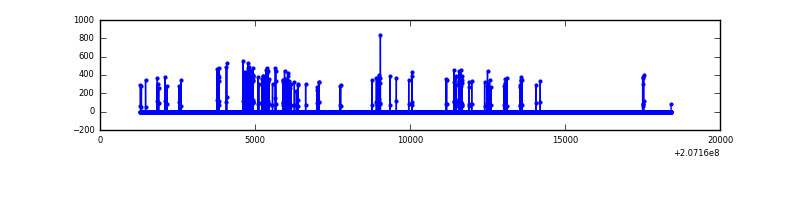 |
Top three noisy pixels from each quadrant. If the there are fewer than three noisy pixels in the level2.evt file, extra rows are filled as -1
| Pixel properties | Quadrant properties | ||||||
|---|---|---|---|---|---|---|---|
| Quadrant | DetID | PixID | Counts | Sigma | Mean | Median | Sigma |
| A | 0 | 13 | 1631 | 240.67 | 22 | 21 | 6.7 |
| A | 0 | 118 | 885 | 129.15 | 22 | 21 | 6.7 |
| A | 13 | 248 | 760 | 110.47 | 22 | 21 | 6.7 |
| B | 15 | 204 | 2998 | 549.72 | 17 | 17 | 5.4 |
| B | 14 | 167 | 2344 | 429.12 | 17 | 17 | 5.4 |
| B | 10 | 16 | 2013 | 368.08 | 17 | 17 | 5.4 |
| C | 9 | 16 | 3076 | 474.98 | 19 | 19 | 6.4 |
| C | 14 | 48 | 788 | 119.48 | 19 | 19 | 6.4 |
| C | 8 | 128 | 453 | 67.43 | 19 | 19 | 6.4 |
| D | 13 | 235 | 1476 | 203.35 | 21 | 20 | 7.2 |
| D | 9 | 35 | 1300 | 178.77 | 21 | 20 | 7.2 |
| D | 2 | 136 | 633 | 85.61 | 21 | 20 | 7.2 |
Histogram calculated using DETX and DETY for each event in the final _common_clean file
| Quadrant A | 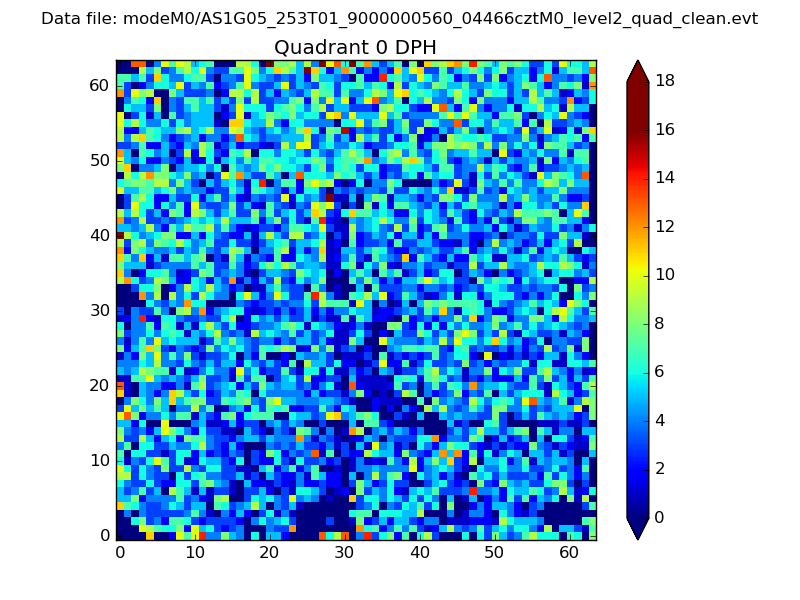 |
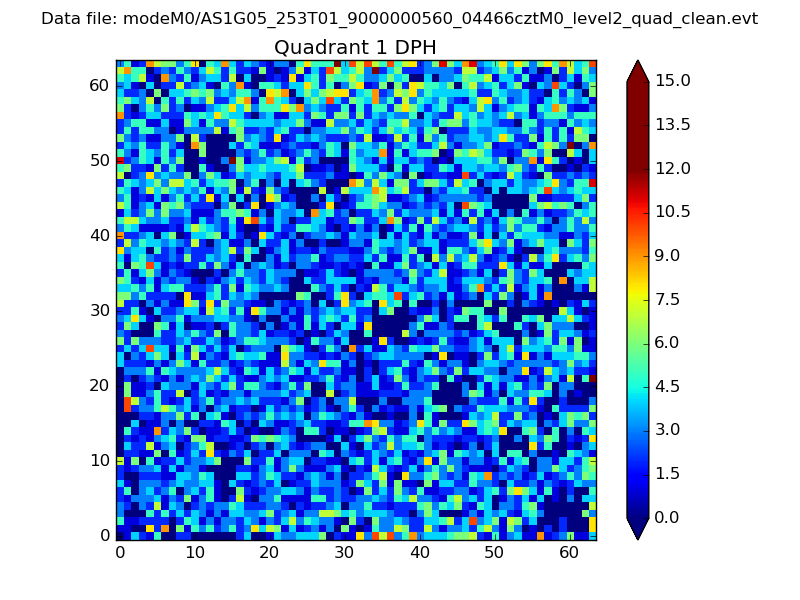 |
Quadrant B |
|---|---|---|---|
| Quadrant D | 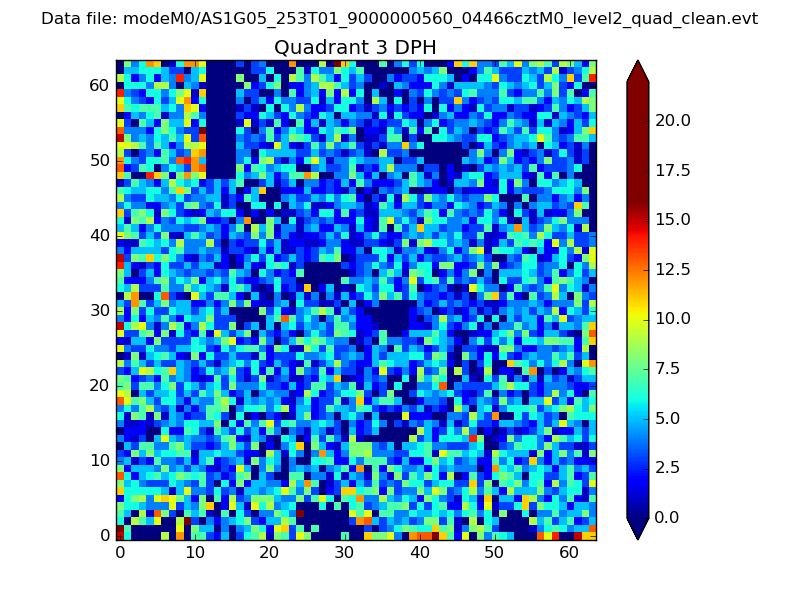 |
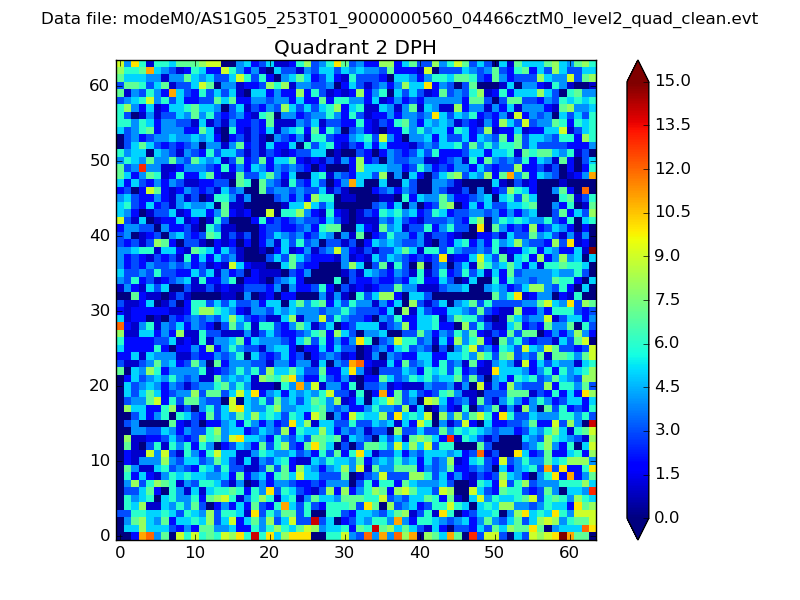 |
Quadrant C |
| Plot type | Count rate plots | Images |
|---|---|---|
| Comparison with Poisson distribution Blue bars denote a histogram of data divided into 1 sec bins. Red curve is a Poisson curve with rate = median count rate of data. |
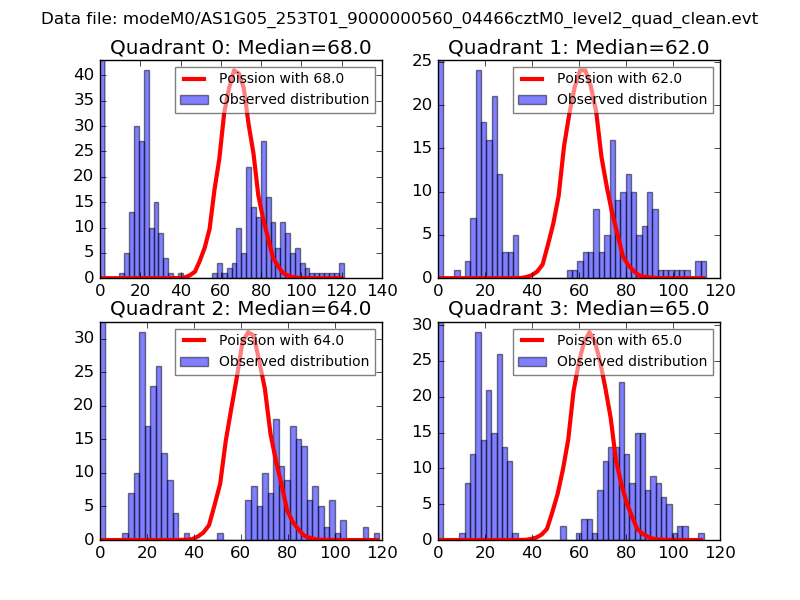 |
 |
| Quadrant-wise count rates Data is divided into 100 sec bins |
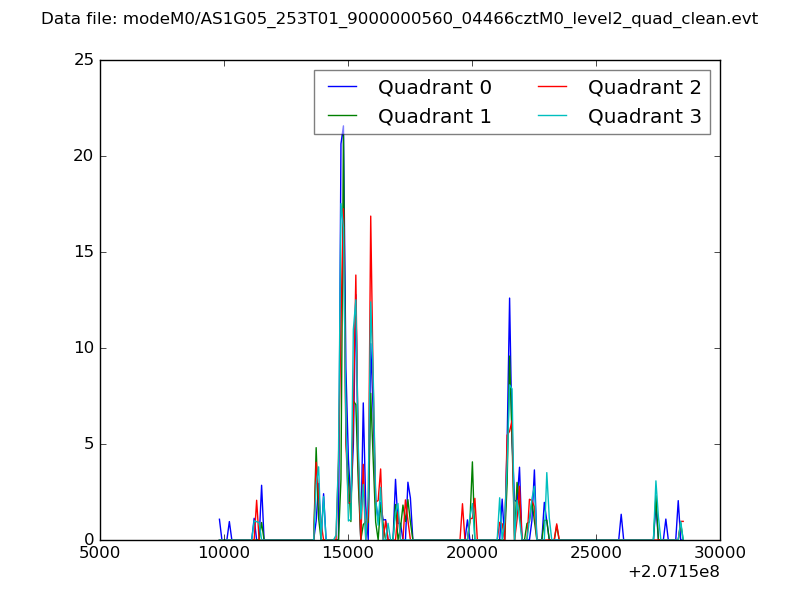 |
|
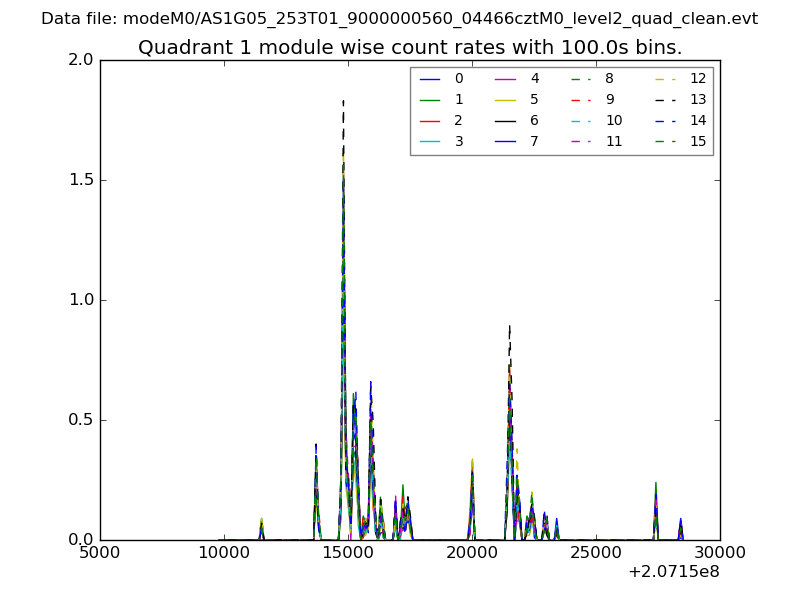
| Module-wise count rates for Quadrant A Data is divided into 100 sec bins |
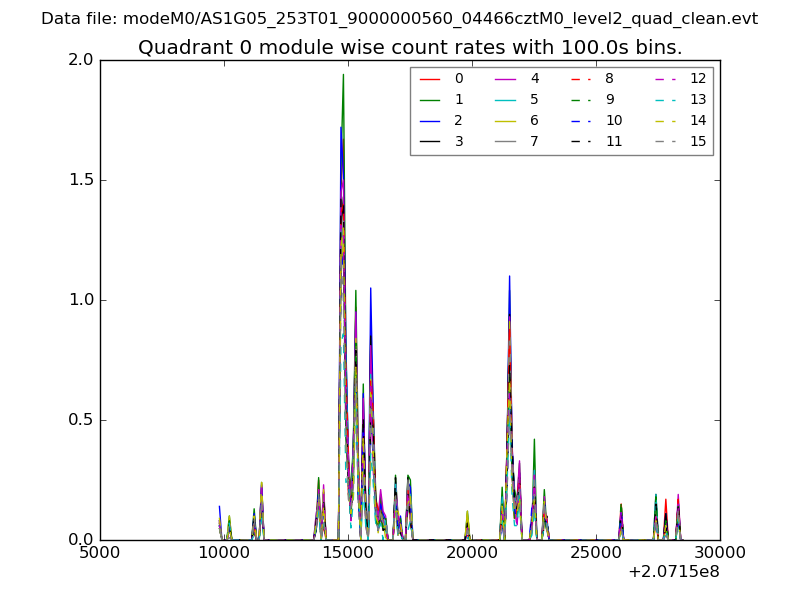 |
 |
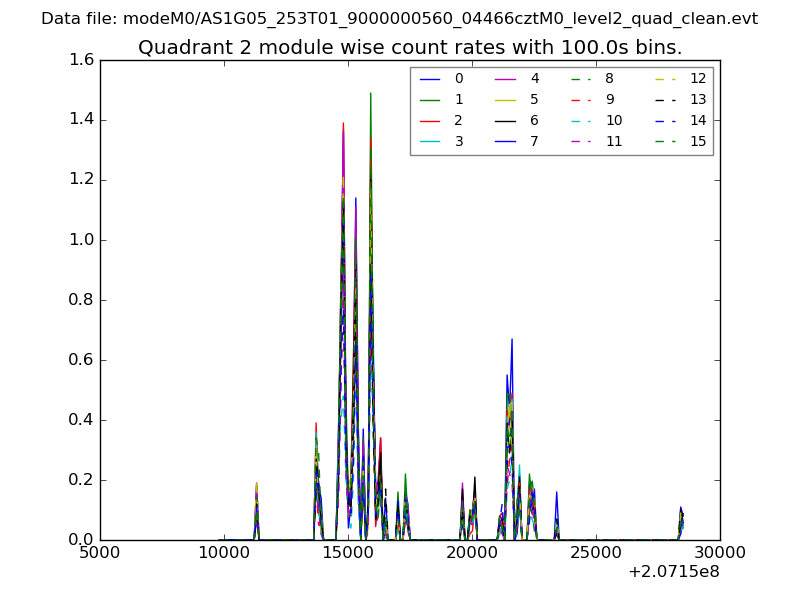
| Module-wise count rates for Quadrant B Data is divided into 100 sec bins |
 |
 |
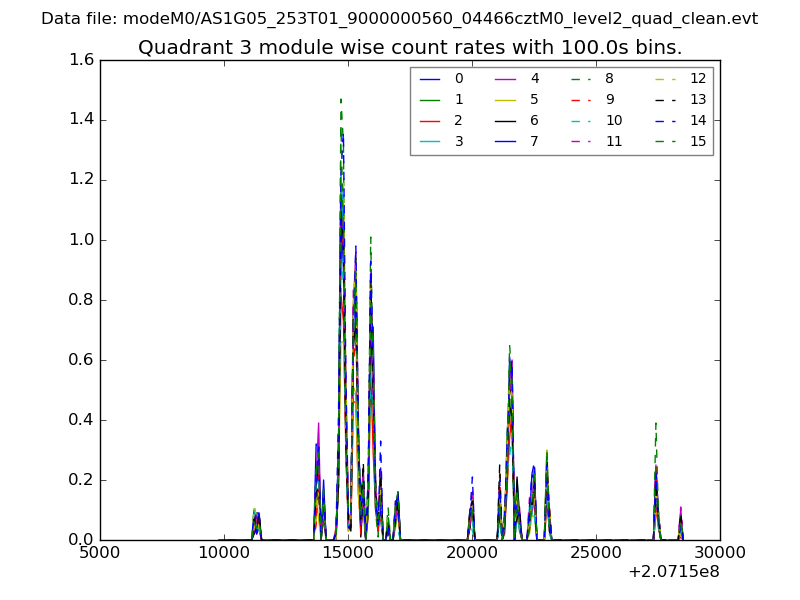
| Module-wise count rates for Quadrant C Data is divided into 100 sec bins |
 |
 |
| Module-wise count rates for Quadrant D Data is divided into 100 sec bins |
 |
 |
| Parameter | Plot |
|---|---|
| CZT HV Monitor | 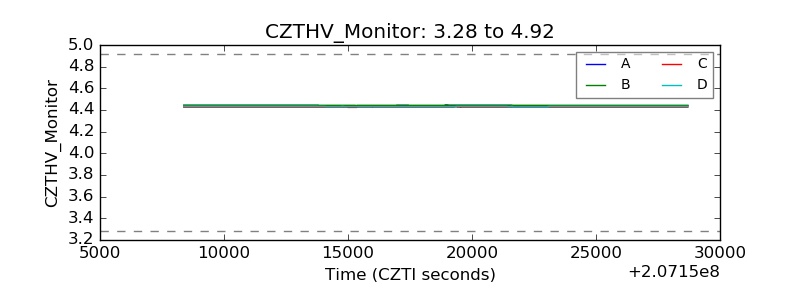 |
| D_VDD | 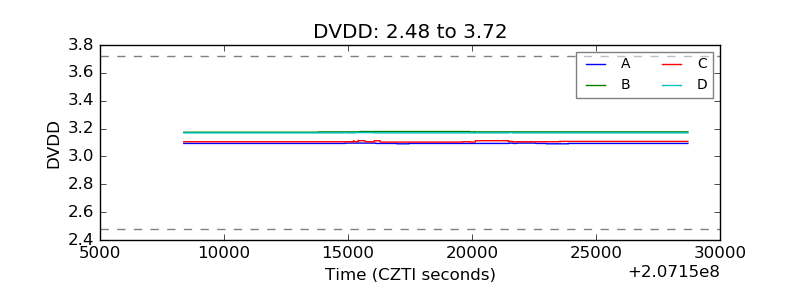 |
| Temperature 1 | 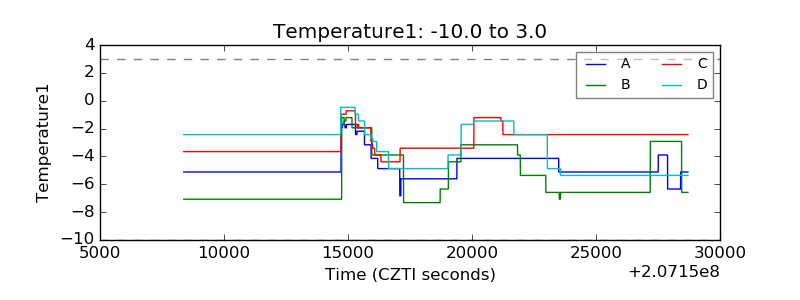 |
| Veto HV Monitor | 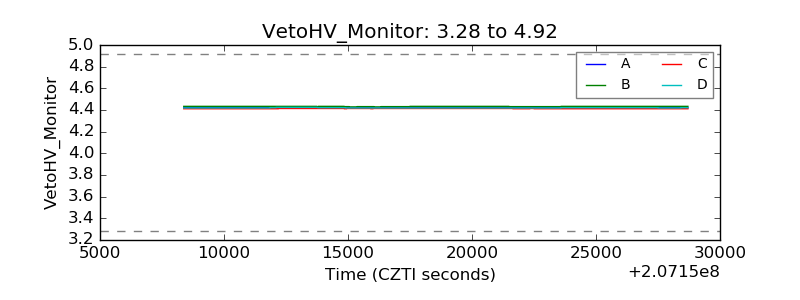 |
| Veto LLD | 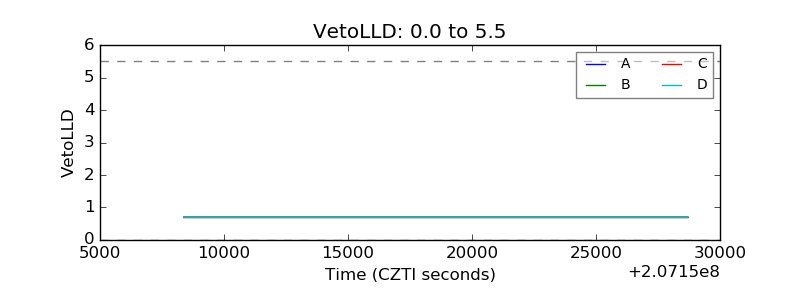 |
| Alpha Counter | 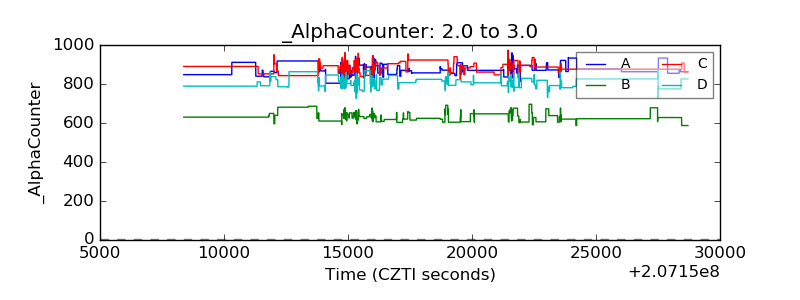 |
| _CPM_Rate | 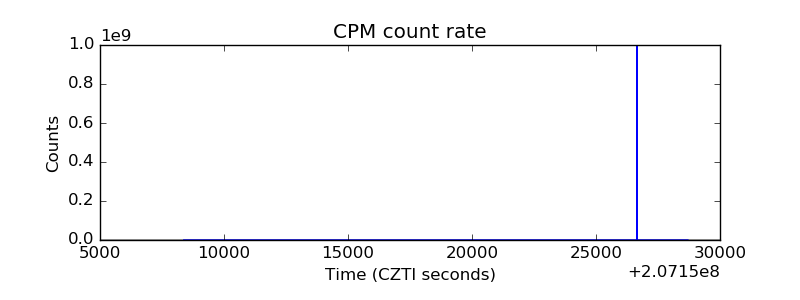 |
| CZT Counter | 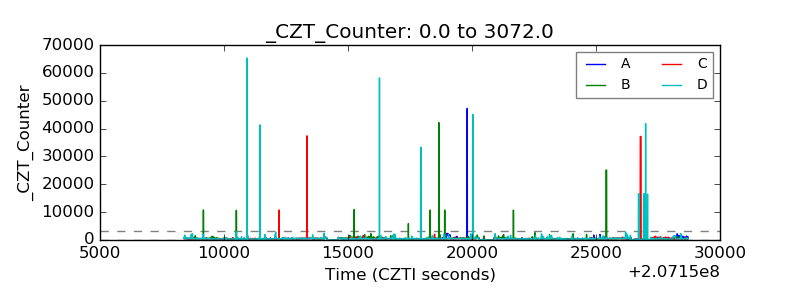 |
| +2.5 Volts monitor | 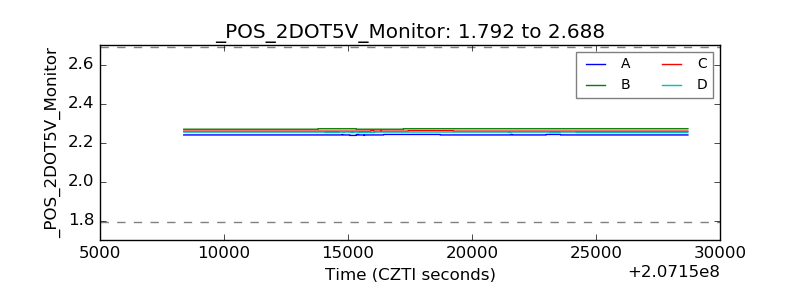 |
| +5 Volts monitor |  |
| _ROLL_ROT | 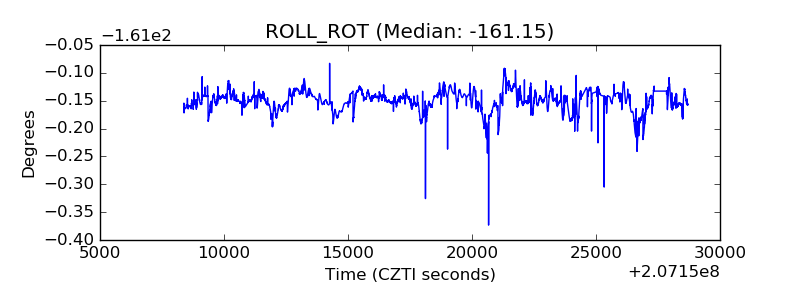 |
| _Roll_DEC | 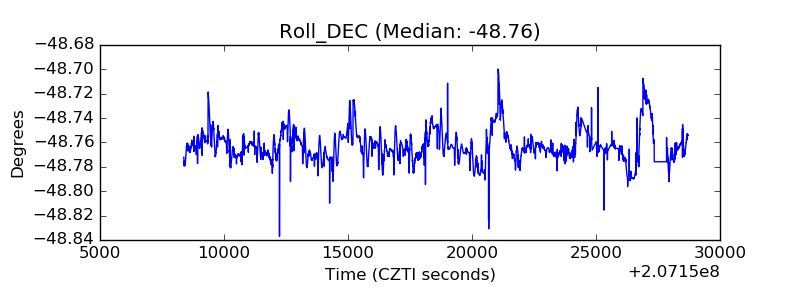 |
| _Roll_RA | 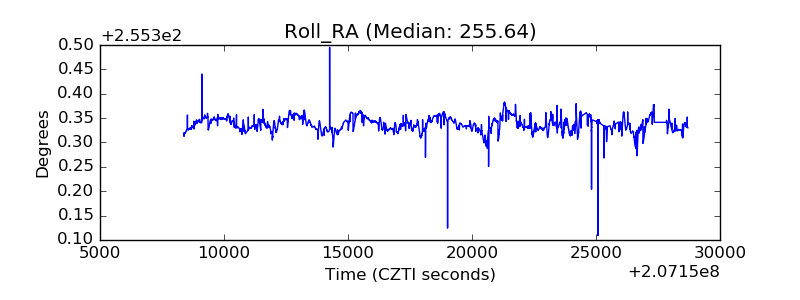 |
| Veto Counter | 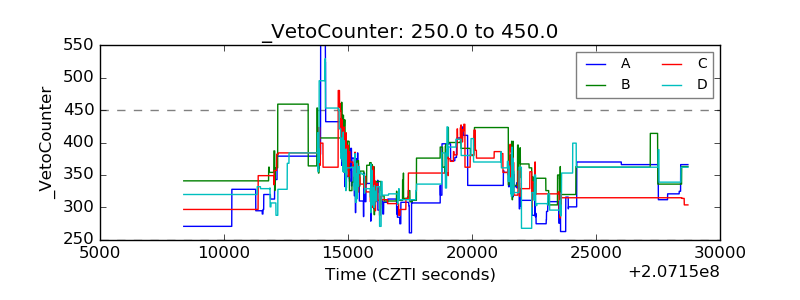 |