| Param | Original file | Final file |
|---|---|---|
| Filename | modeM0/AS1G05_253T01_9000000560_04467cztM0_level2.evt | modeM0/AS1G05_253T01_9000000560_04467cztM0_level2_quad_clean.evt |
| Size (bytes) | 435,873,600 | 76,337,280 |
| Size | 415.7 MB | 72.8 MB |
| Events in quadrant A | 3,256,370 | 466,784 |
| Events in quadrant B | 3,008,758 | 473,706 |
| Events in quadrant C | 3,241,656 | 468,421 |
| Events in quadrant D | 3,256,671 | 454,532 |
| Mode SS | |||
|---|---|---|---|
| Quadrant | BADHDUFLAG | Total packets | Discarded packets |
| A | 0 | 136 | 2 |
| B | 0 | 136 | 6 |
| C | 0 | 136 | 6 |
| D | 0 | 136 | 0 |
| Mode M9 | |||
|---|---|---|---|
| Quadrant | BADHDUFLAG | Total packets | Discarded packets |
| A | 0 | 14 | 0 |
| B | 0 | 14 | 0 |
| C | 0 | 14 | 0 |
| D | 0 | 15 | 0 |
| Mode M0 | |||
|---|---|---|---|
| Quadrant | BADHDUFLAG | Total packets | Discarded packets |
| A | 0 | 14678 | 680 |
| B | 0 | 13830 | 444 |
| C | 0 | 14748 | 596 |
| D | 0 | 15001 | 547 |
| Quadrant | Total seconds | Saturated seconds | Saturation percentage |
|---|---|---|---|
| A | 6386 | 45 | 0.704666% |
| B | 6440 | 31 | 0.481366% |
| C | 6401 | 28 | 0.437432% |
| D | 6414 | 87 | 1.356408% |
Noise dominated data is calculated using 1-second bins in cleaned event files. If a bin has >2000 counts, and if more than 50% of those come from <1% of pixels, then it is considered to be noise-dominated and hence unusable.
| Quadrant | # 1 sec bins | Bins with >0 counts | Bins with >2000 counts | High rate bins dominated by noise | Noise dominated (total time) | Noise dominated (detector-on time) | Marked lightcurve |
|---|---|---|---|---|---|---|---|
| A | 7580 | 6631 | 24 | 24 | 0.32% | 0.36% | 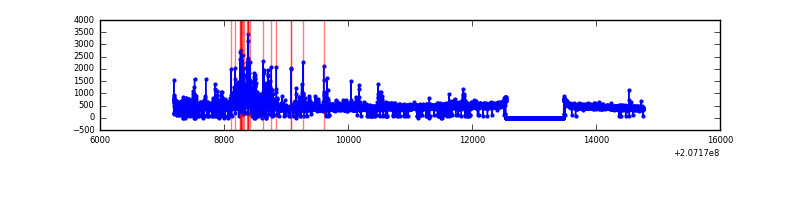 |
| B | 7580 | 6637 | 3 | 3 | 0.04% | 0.05% | 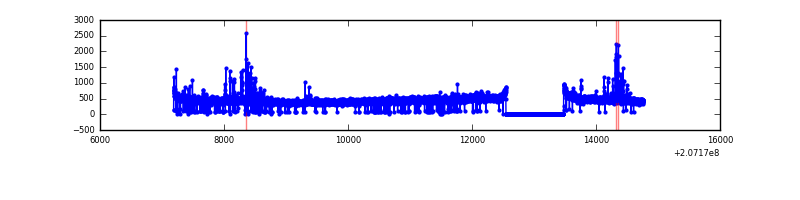 |
| C | 7580 | 6634 | 3 | 3 | 0.04% | 0.05% | 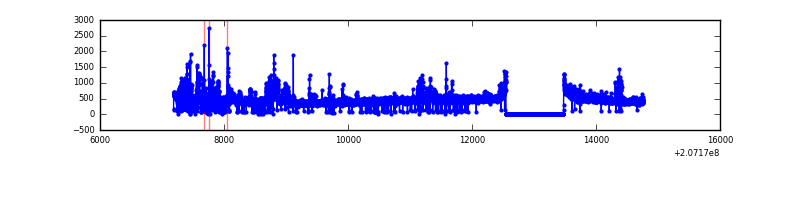 |
| D | 7580 | 6636 | 67 | 67 | 0.88% | 1.01% | 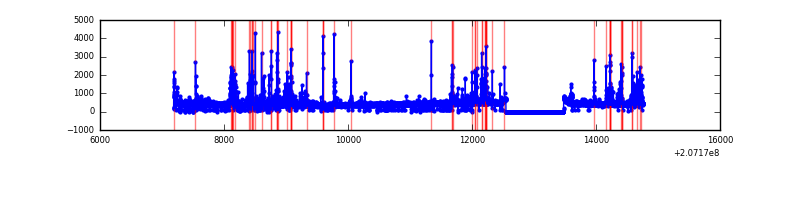 |
Top three noisy pixels from each quadrant. If the there are fewer than three noisy pixels in the level2.evt file, extra rows are filled as -1
| Pixel properties | Quadrant properties | ||||||
|---|---|---|---|---|---|---|---|
| Quadrant | DetID | PixID | Counts | Sigma | Mean | Median | Sigma |
| A | 0 | 13 | 444060 | 2992.91 | 719 | 703 | 148.1 |
| A | 0 | 118 | 18383 | 119.35 | 719 | 703 | 148.1 |
| A | 15 | 234 | 9206 | 57.4 | 719 | 703 | 148.1 |
| B | 4 | 48 | 93187 | 639.63 | 738 | 719 | 144.6 |
| B | 14 | 167 | 28697 | 193.53 | 738 | 719 | 144.6 |
| B | 15 | 204 | 17659 | 117.18 | 738 | 719 | 144.6 |
| C | 14 | 48 | 438354 | 2655.41 | 701 | 704 | 164.8 |
| C | 9 | 16 | 21159 | 124.11 | 701 | 704 | 164.8 |
| C | 9 | 247 | 17756 | 103.46 | 701 | 704 | 164.8 |
| D | 13 | 235 | 359916 | 2134.71 | 693 | 672 | 168.3 |
| D | 2 | 136 | 123965 | 732.63 | 693 | 672 | 168.3 |
| D | 12 | 227 | 55747 | 327.27 | 693 | 672 | 168.3 |
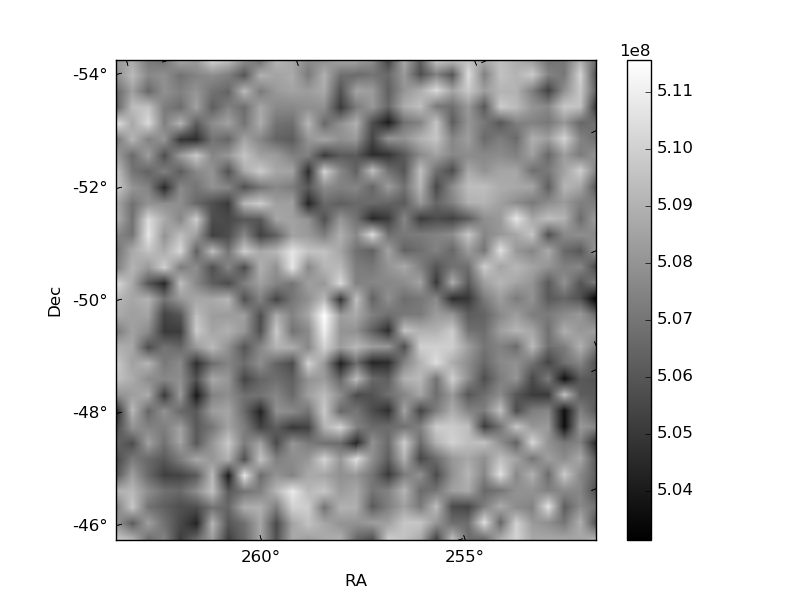
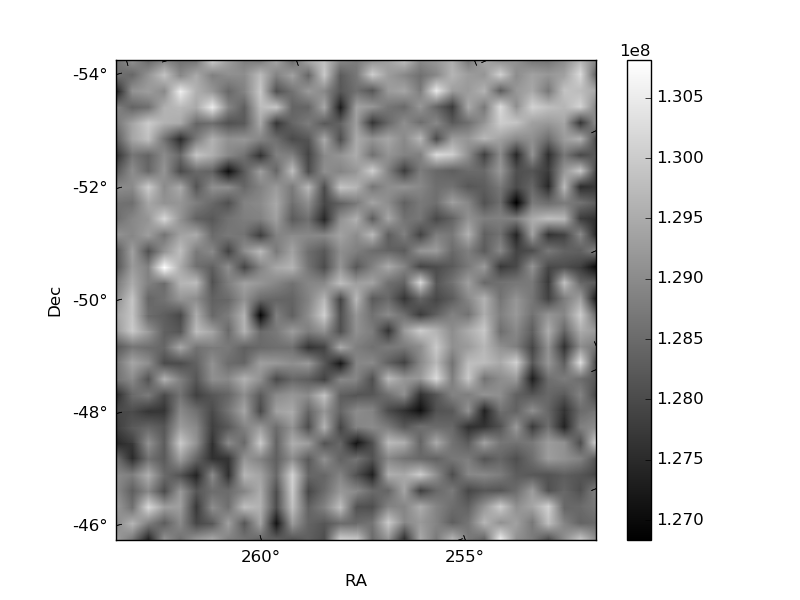
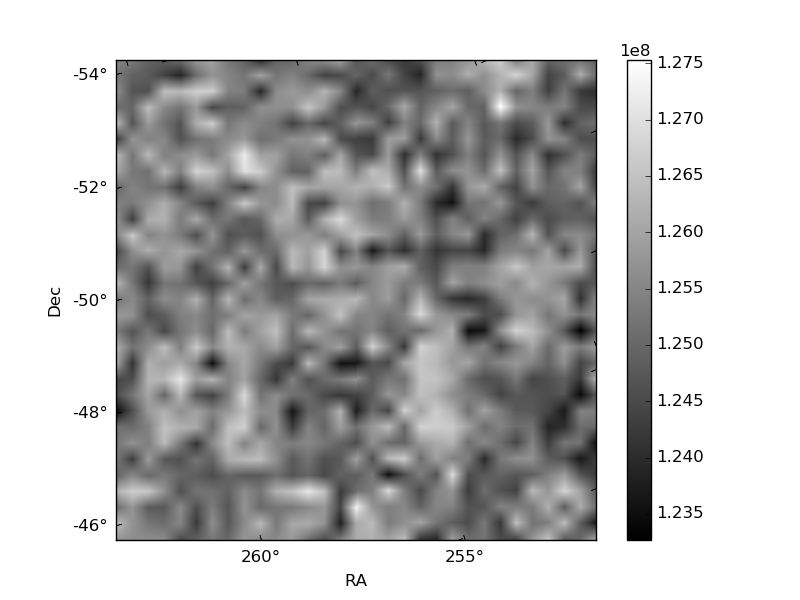
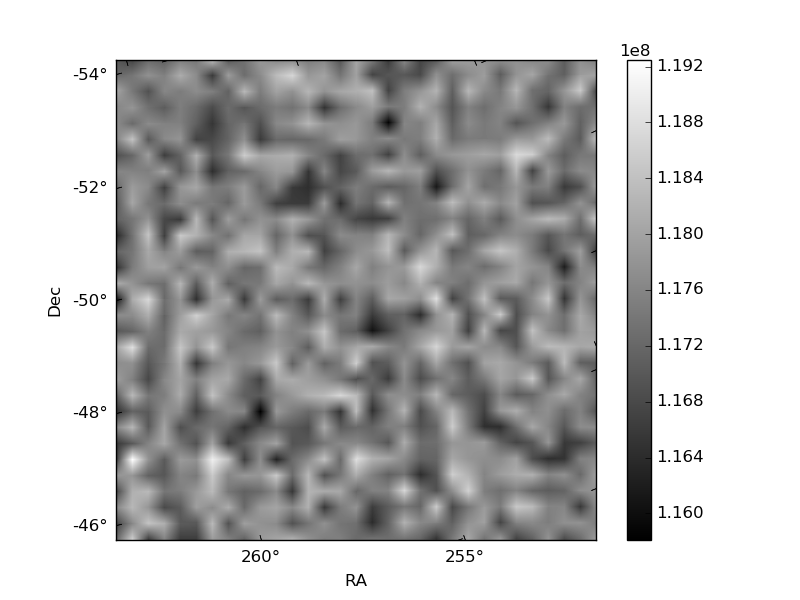
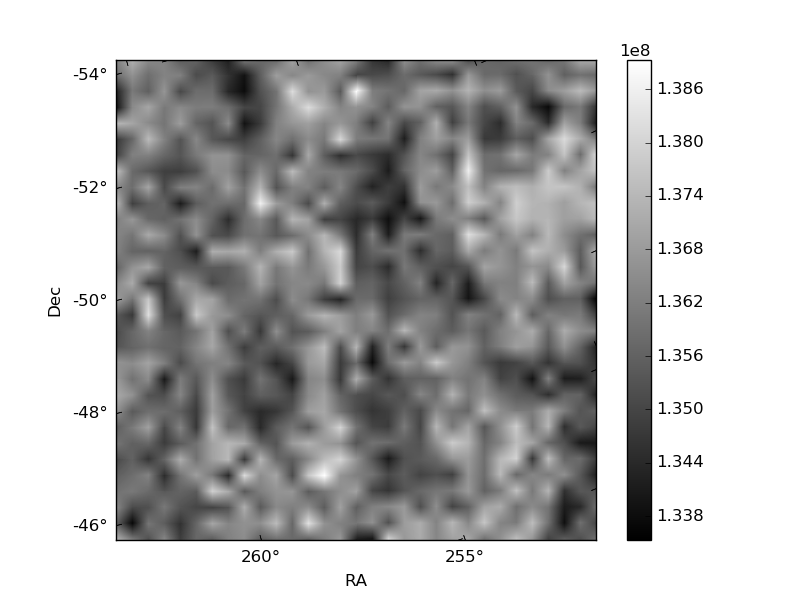
Histogram calculated using DETX and DETY for each event in the final _common_clean file
| Quadrant A | 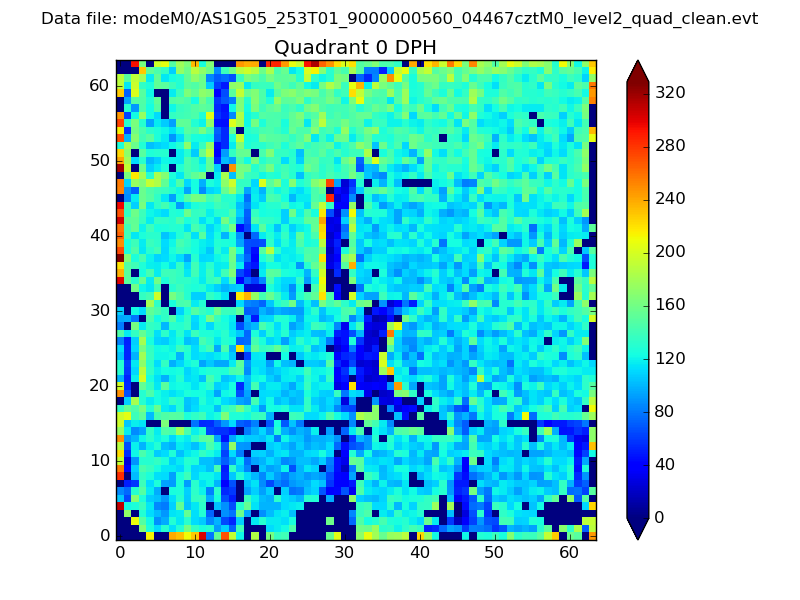 |
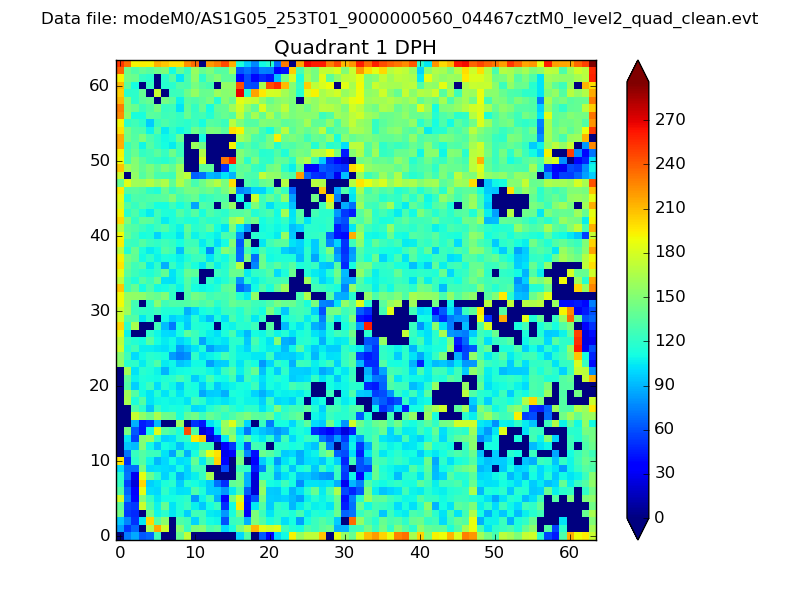 |
Quadrant B |
|---|---|---|---|
| Quadrant D | 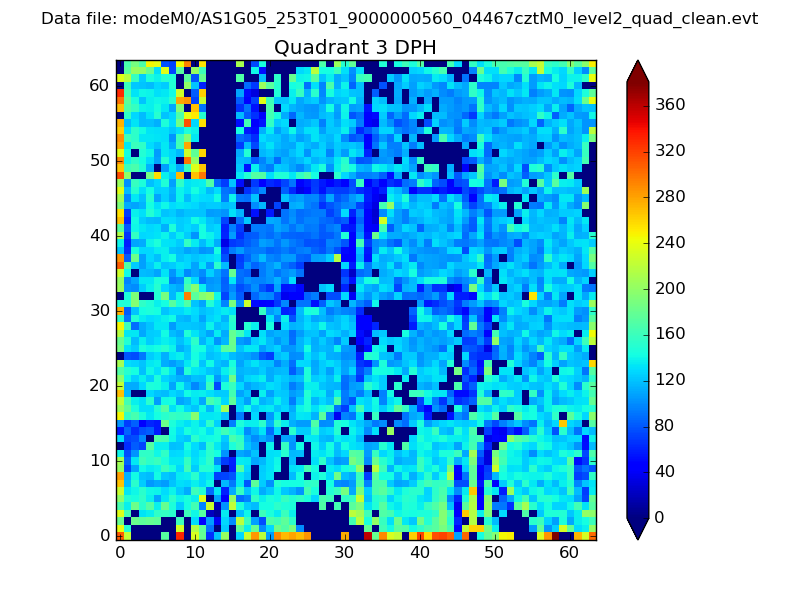 |
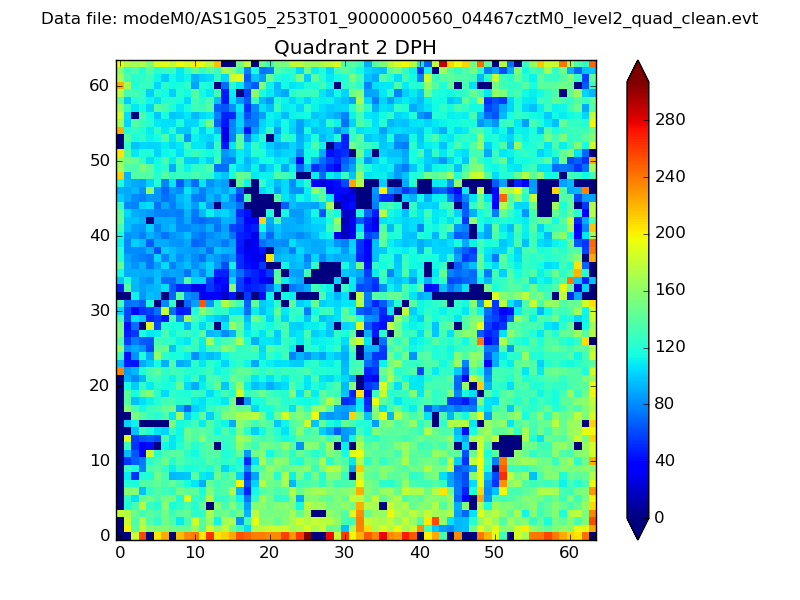 |
Quadrant C |
| Plot type | Count rate plots | Images |
|---|---|---|
| Comparison with Poisson distribution Blue bars denote a histogram of data divided into 1 sec bins. Red curve is a Poisson curve with rate = median count rate of data. |
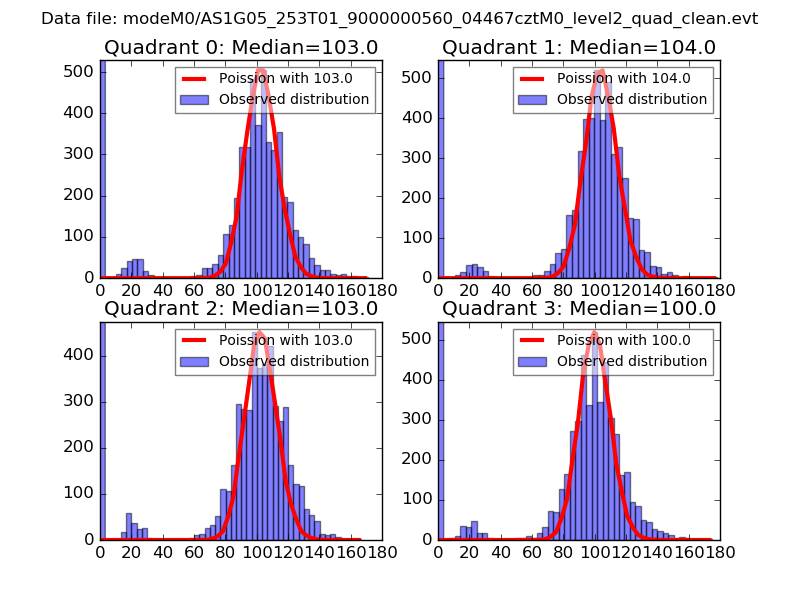 |
 |
| Quadrant-wise count rates Data is divided into 100 sec bins |
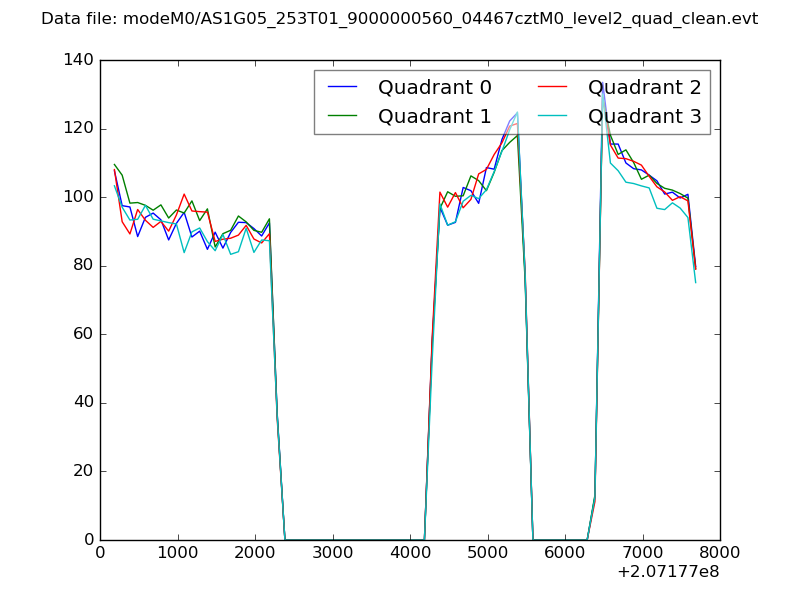 |
|
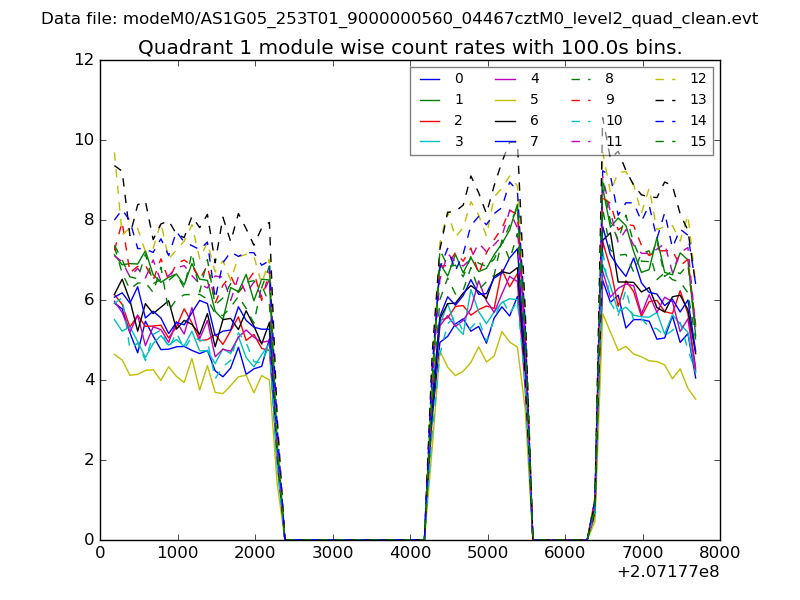
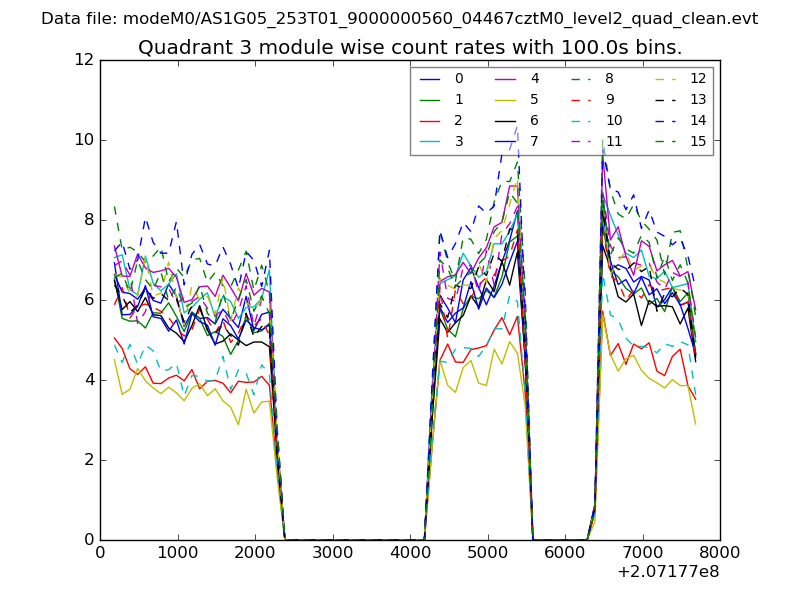
| Module-wise count rates for Quadrant A Data is divided into 100 sec bins |
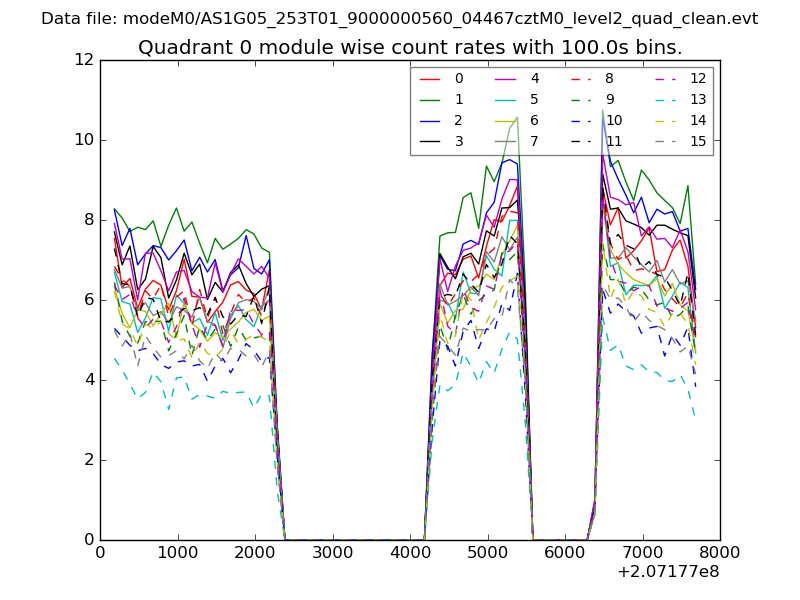 |
 |
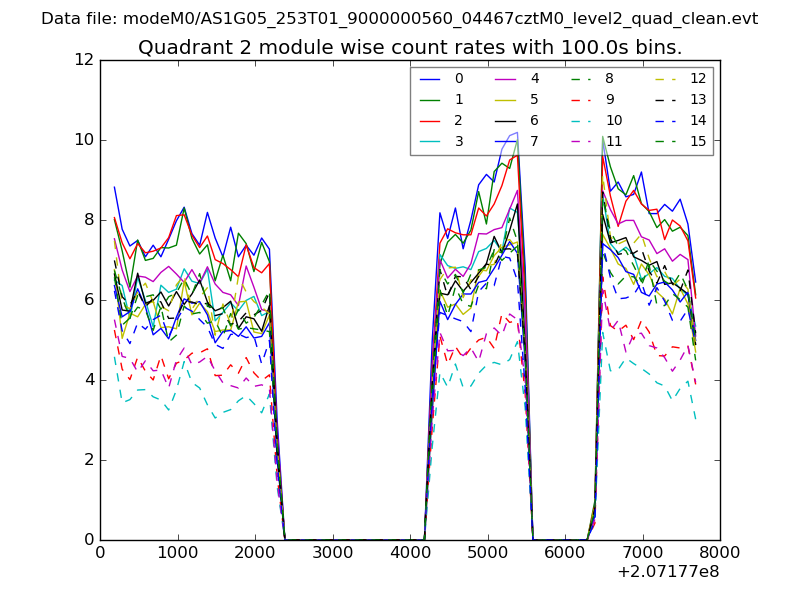
| Module-wise count rates for Quadrant B Data is divided into 100 sec bins |
 |
 |
| Module-wise count rates for Quadrant C Data is divided into 100 sec bins |
 |
 |
| Module-wise count rates for Quadrant D Data is divided into 100 sec bins |
 |
 |
| Parameter | Plot |
|---|---|
| CZT HV Monitor | 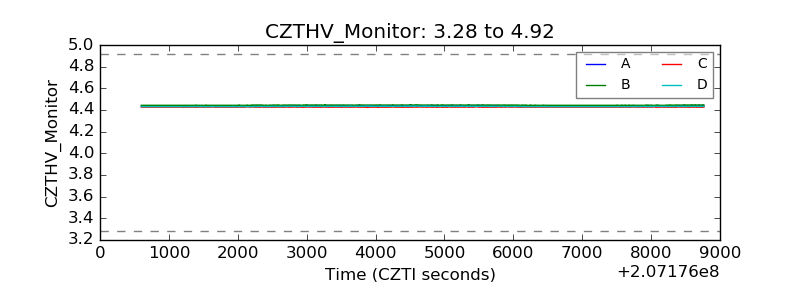 |
| D_VDD | 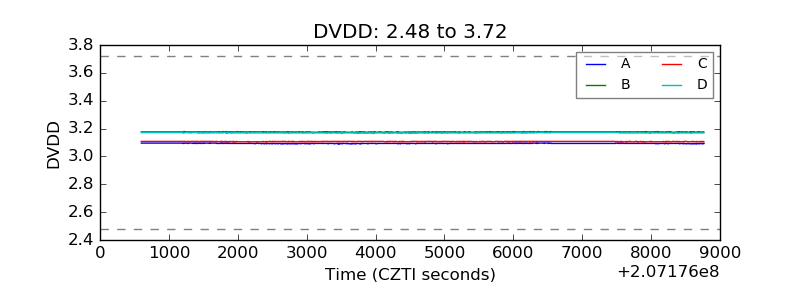 |
| Temperature 1 | 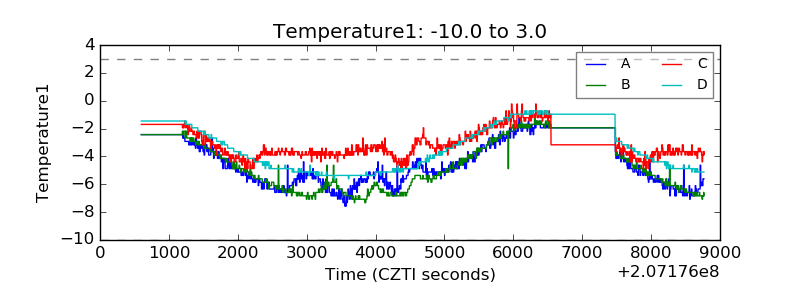 |
| Veto HV Monitor | 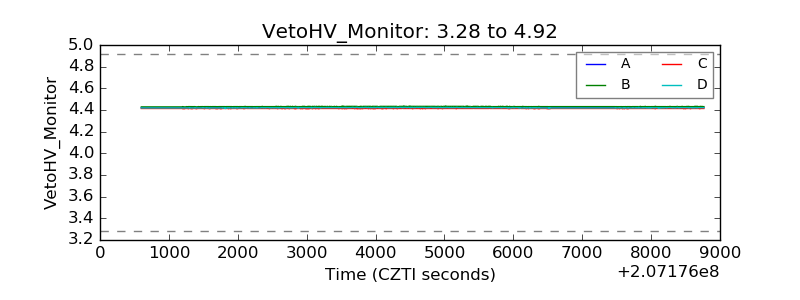 |
| Veto LLD | 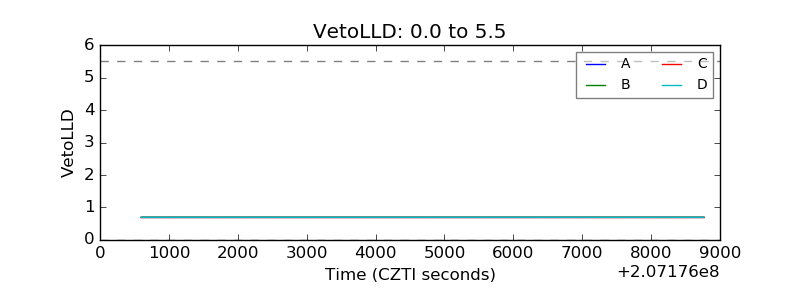 |
| Alpha Counter | 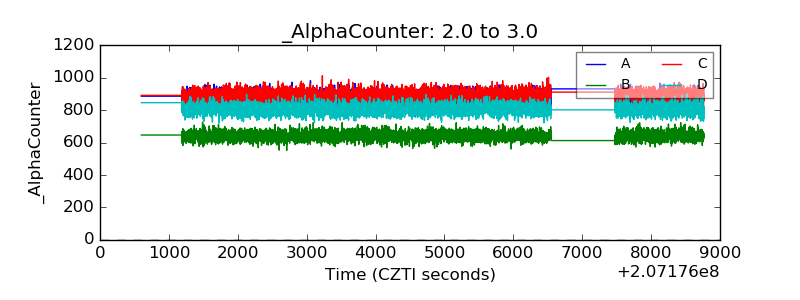 |
| _CPM_Rate | 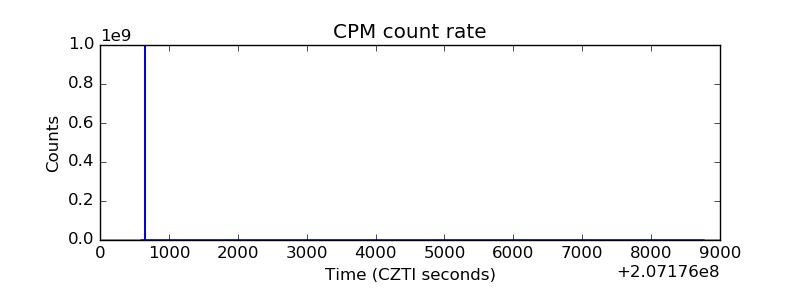 |
| CZT Counter | 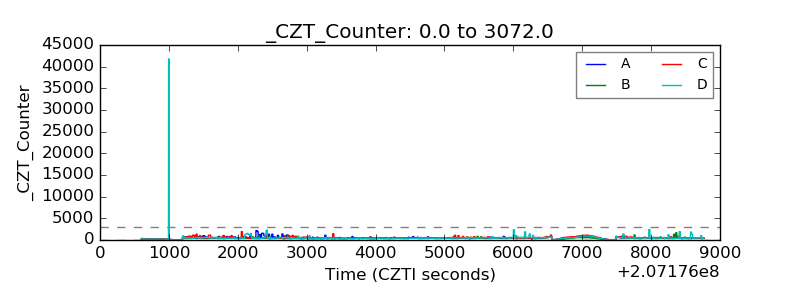 |
| +2.5 Volts monitor | 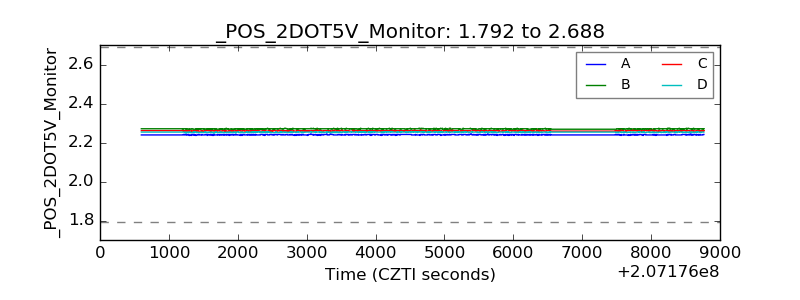 |
| +5 Volts monitor |  |
| _ROLL_ROT | 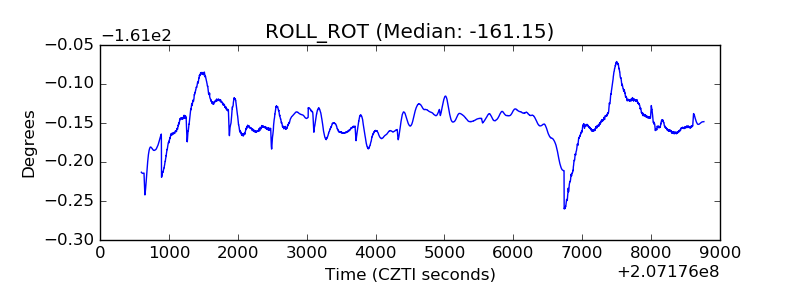 |
| _Roll_DEC | 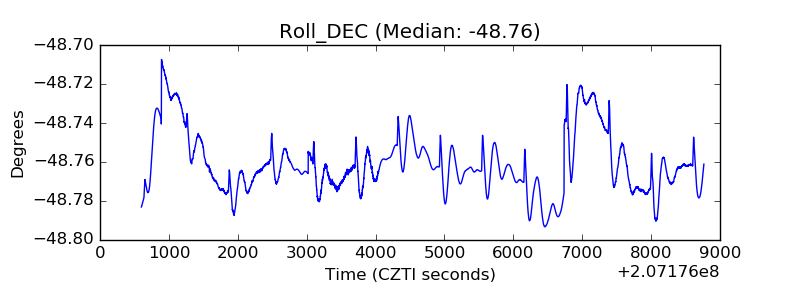 |
| _Roll_RA | 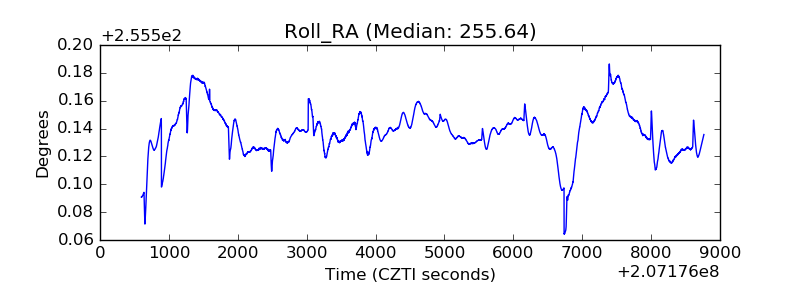 |
| Veto Counter | 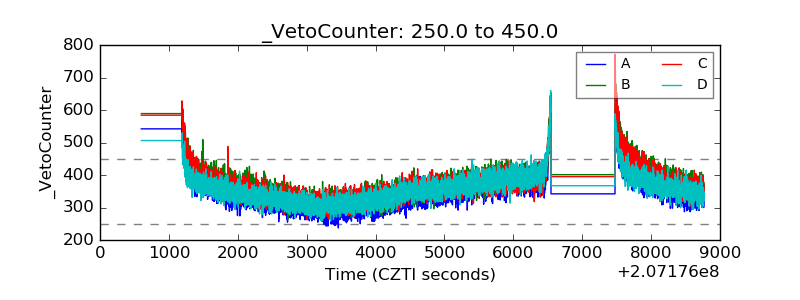 |