| Param | Original file | Final file |
|---|---|---|
| Filename | modeM0/AS1G05_253T01_9000000560_04469cztM0_level2.evt | modeM0/AS1G05_253T01_9000000560_04469cztM0_level2_quad_clean.evt |
| Size (bytes) | 2,314,500,480 | 371,027,520 |
| Size | 2.2 GB | 353.8 MB |
| Events in quadrant A | 16,344,147 | 2,249,730 |
| Events in quadrant B | 17,625,208 | 2,227,559 |
| Events in quadrant C | 15,976,240 | 2,248,637 |
| Events in quadrant D | 17,838,994 | 2,161,491 |
| Mode SS | |||
|---|---|---|---|
| Quadrant | BADHDUFLAG | Total packets | Discarded packets |
| A | 0 | 700 | 4 |
| B | 0 | 700 | 2 |
| C | 0 | 700 | 2 |
| D | 0 | 700 | 2 |
| Mode M9 | |||
|---|---|---|---|
| Quadrant | BADHDUFLAG | Total packets | Discarded packets |
| A | 0 | 41 | 0 |
| B | 0 | 41 | 1 |
| C | 0 | 41 | 0 |
| D | 0 | 41 | 0 |
| Mode M0 | |||
|---|---|---|---|
| Quadrant | BADHDUFLAG | Total packets | Discarded packets |
| A | 0 | 73532 | 497 |
| B | 0 | 76034 | 381 |
| C | 0 | 72404 | 398 |
| D | 0 | 78472 | 451 |
| Quadrant | Total seconds | Saturated seconds | Saturation percentage |
|---|---|---|---|
| A | 34181 | 366 | 1.070770% |
| B | 34192 | 406 | 1.187412% |
| C | 34199 | 109 | 0.318723% |
| D | 34198 | 576 | 1.684309% |
Noise dominated data is calculated using 1-second bins in cleaned event files. If a bin has >2000 counts, and if more than 50% of those come from <1% of pixels, then it is considered to be noise-dominated and hence unusable.
| Quadrant | # 1 sec bins | Bins with >0 counts | Bins with >2000 counts | High rate bins dominated by noise | Noise dominated (total time) | Noise dominated (detector-on time) | Marked lightcurve |
|---|---|---|---|---|---|---|---|
| A | 38488 | 34368 | 135 | 135 | 0.35% | 0.39% | 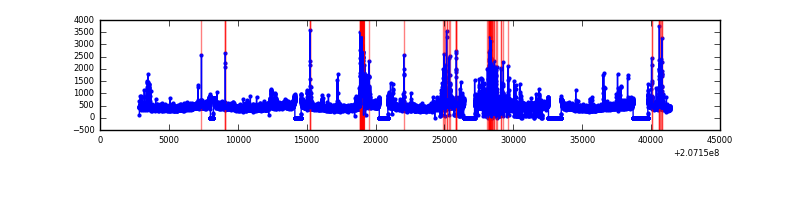 |
| B | 38488 | 34367 | 121 | 121 | 0.31% | 0.35% | 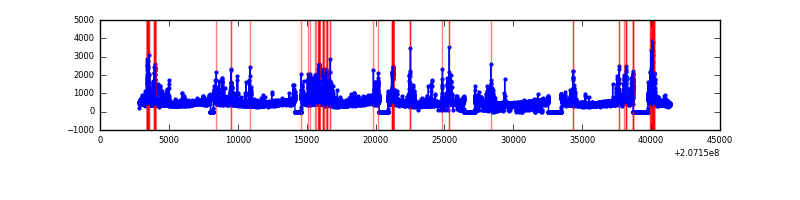 |
| C | 38488 | 34367 | 29 | 29 | 0.08% | 0.08% | 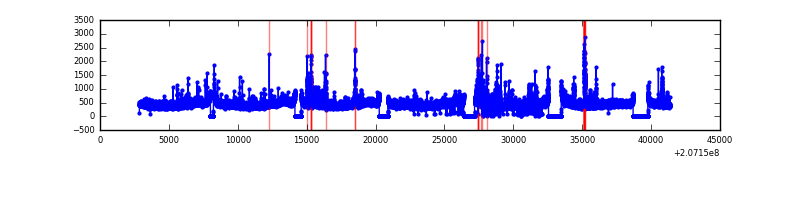 |
| D | 38488 | 34357 | 346 | 346 | 0.90% | 1.01% | 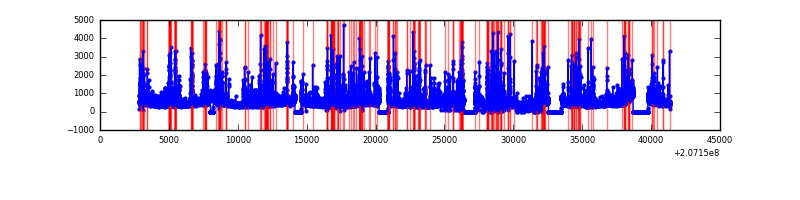 |
Top three noisy pixels from each quadrant. If the there are fewer than three noisy pixels in the level2.evt file, extra rows are filled as -1
| Pixel properties | Quadrant properties | ||||||
|---|---|---|---|---|---|---|---|
| Quadrant | DetID | PixID | Counts | Sigma | Mean | Median | Sigma |
| A | 0 | 13 | 1177144 | 1492.77 | 3859 | 3775 | 786.0 |
| A | 0 | 118 | 108187 | 132.83 | 3859 | 3775 | 786.0 |
| A | 0 | 50 | 64716 | 77.53 | 3859 | 3775 | 786.0 |
| B | 14 | 167 | 897189 | 1199.57 | 3910 | 3817 | 744.7 |
| B | 4 | 48 | 478102 | 636.84 | 3910 | 3817 | 744.7 |
| B | 15 | 204 | 348698 | 463.09 | 3910 | 3817 | 744.7 |
| C | 14 | 48 | 746051 | 855.57 | 3761 | 3775 | 867.6 |
| C | 9 | 16 | 299303 | 340.63 | 3761 | 3775 | 867.6 |
| C | 9 | 247 | 146525 | 164.54 | 3761 | 3775 | 867.6 |
| D | 13 | 235 | 1833586 | 2048.26 | 3714 | 3603 | 893.4 |
| D | 12 | 79 | 433795 | 481.5 | 3714 | 3603 | 893.4 |
| D | 2 | 136 | 397016 | 440.34 | 3714 | 3603 | 893.4 |
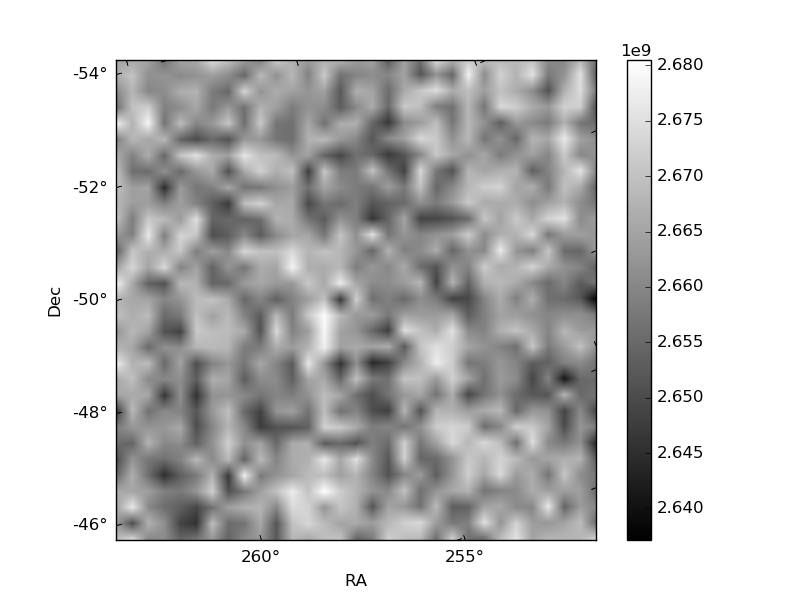
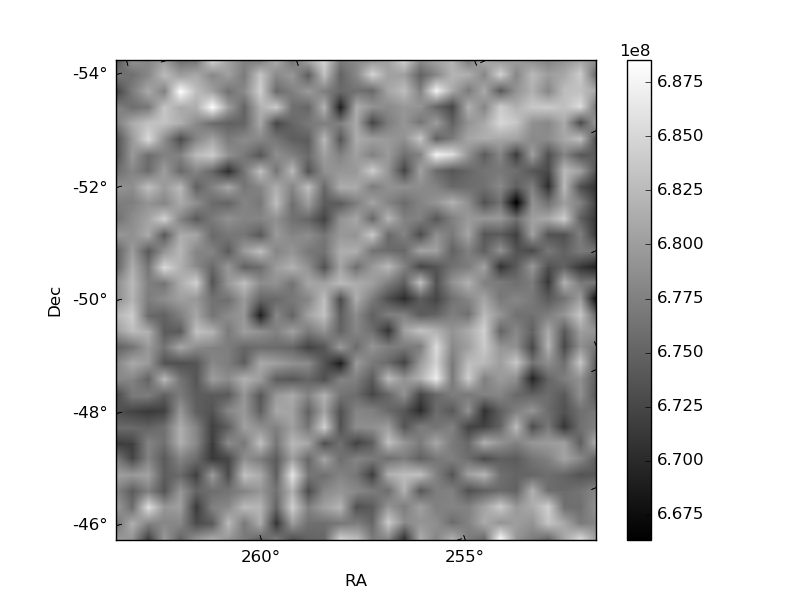
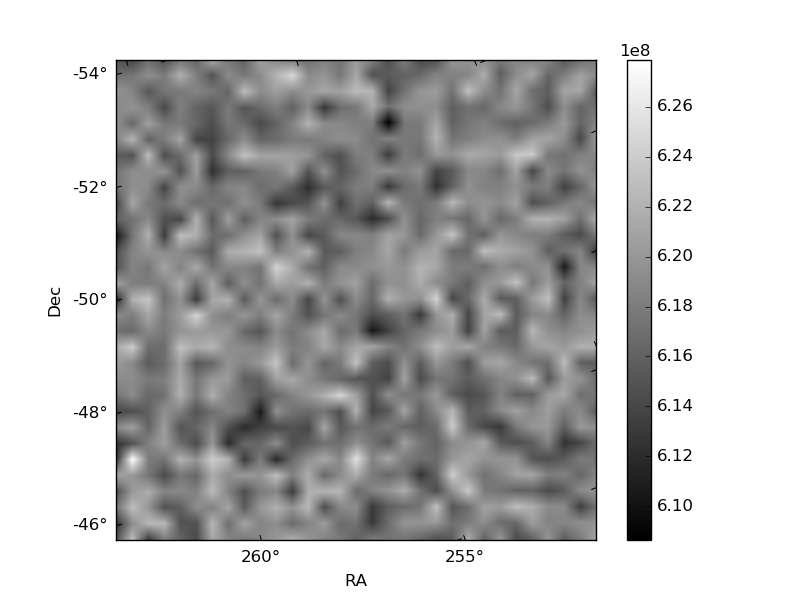
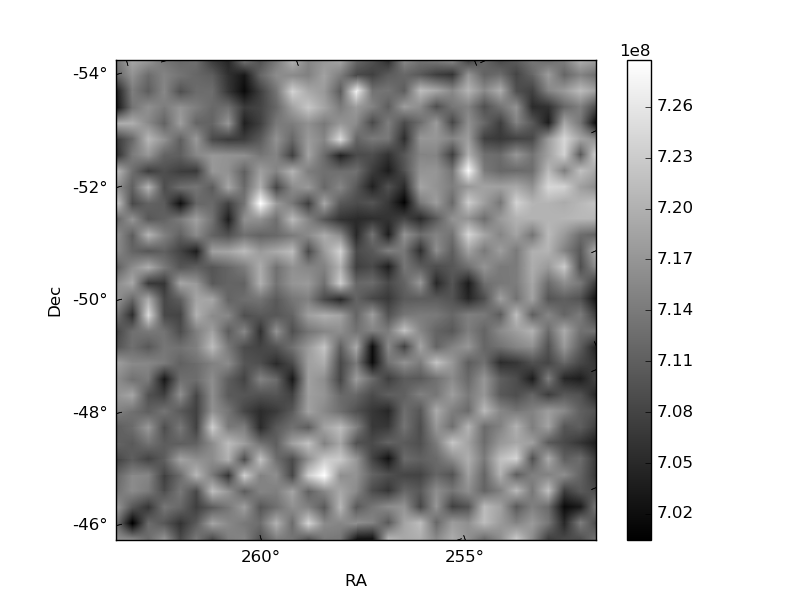
Histogram calculated using DETX and DETY for each event in the final _common_clean file
| Quadrant A | 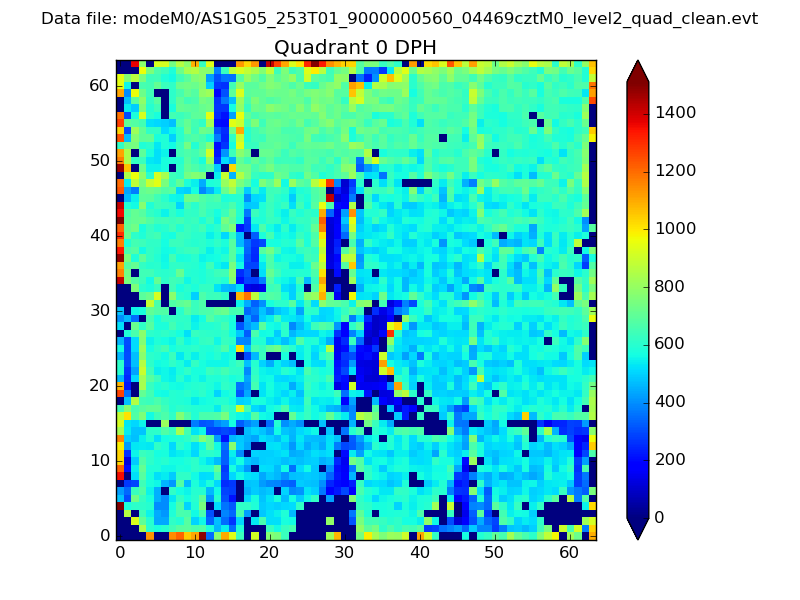 |
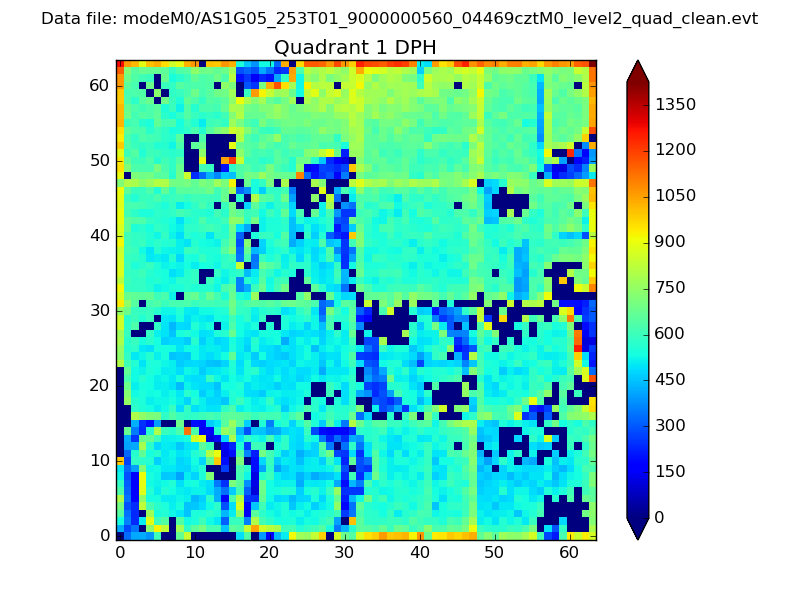 |
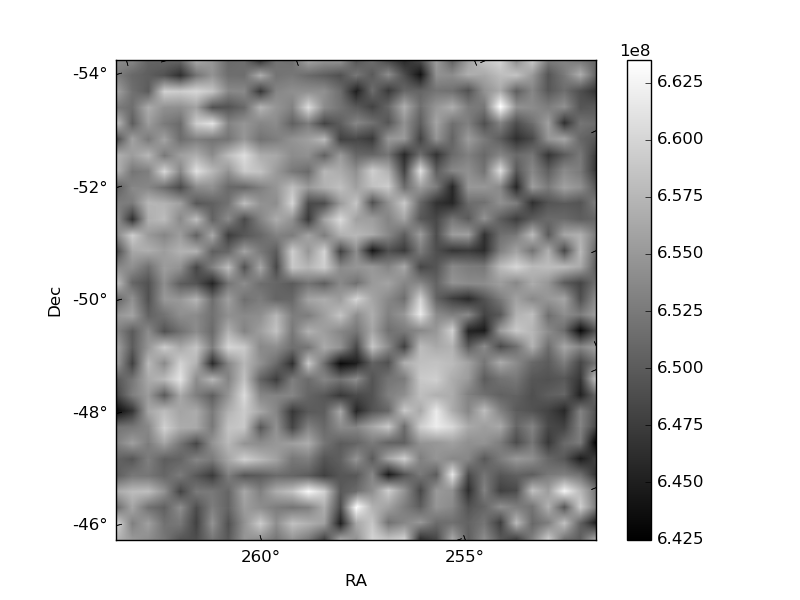
Quadrant B |
|---|---|---|---|
| Quadrant D | 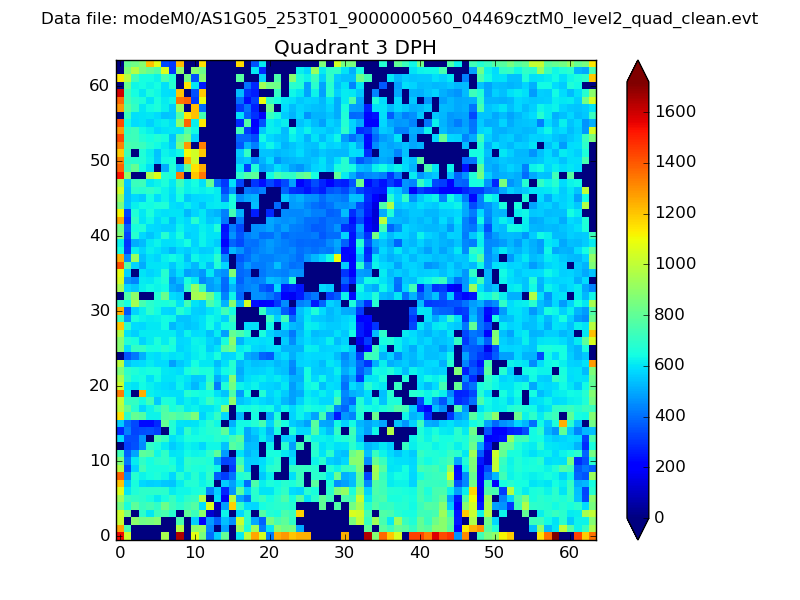 |
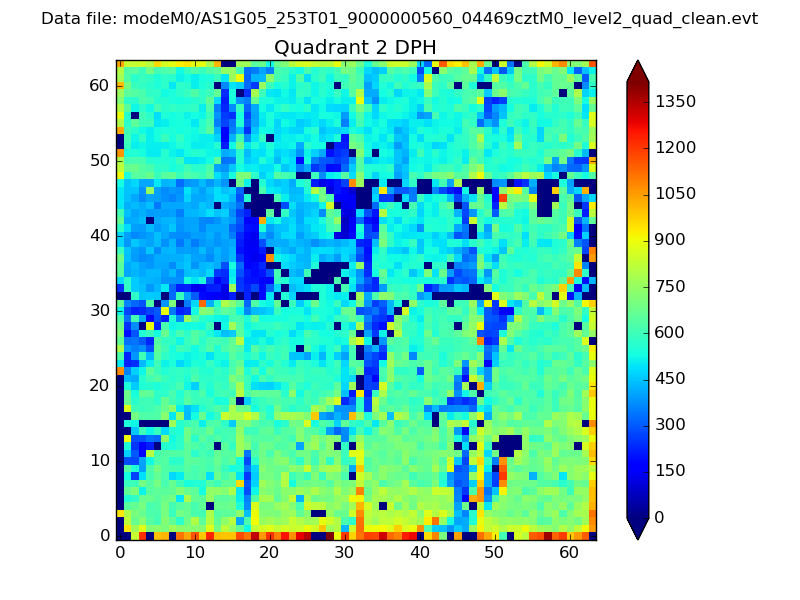 |
Quadrant C |
| Plot type | Count rate plots | Images |
|---|---|---|
| Comparison with Poisson distribution Blue bars denote a histogram of data divided into 1 sec bins. Red curve is a Poisson curve with rate = median count rate of data. |
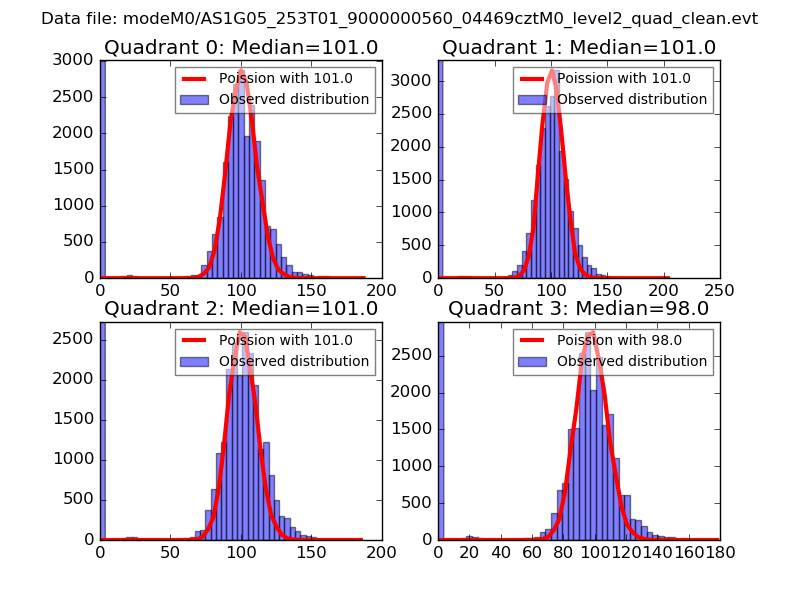 |
 |
| Quadrant-wise count rates Data is divided into 100 sec bins |
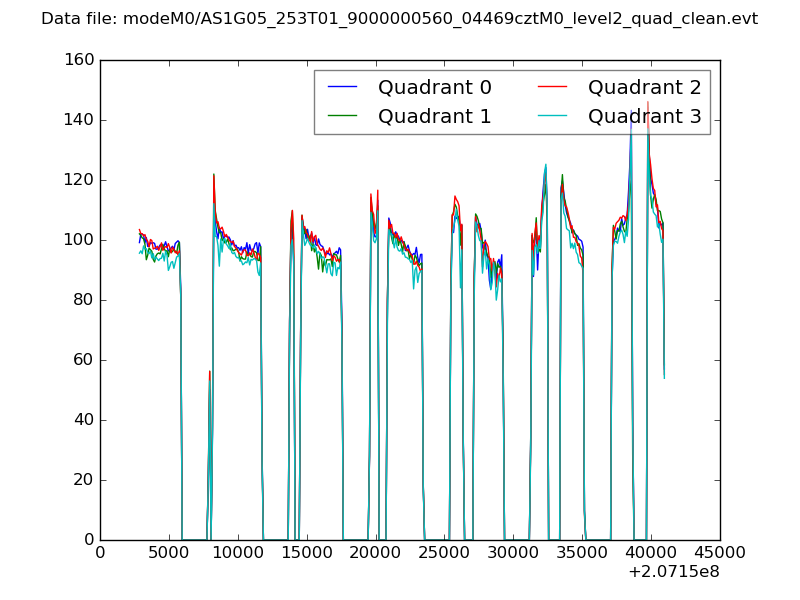 |
|
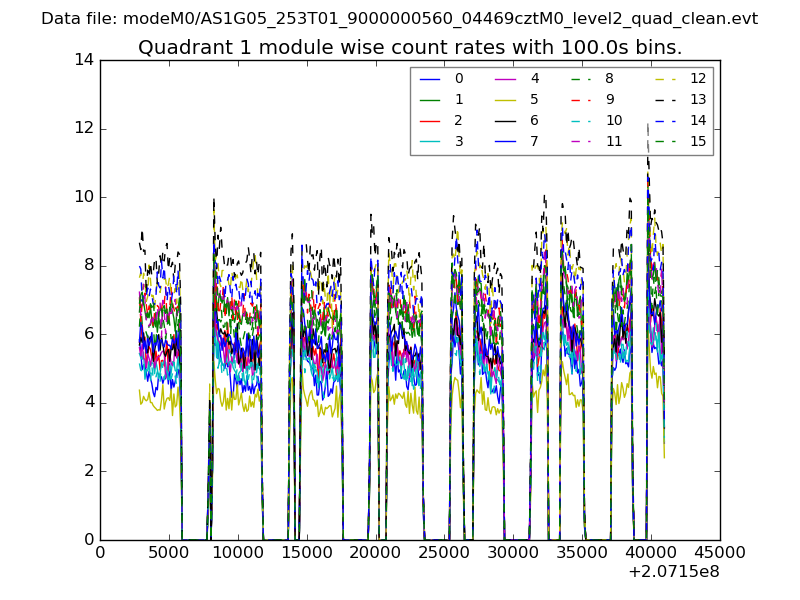
| Module-wise count rates for Quadrant A Data is divided into 100 sec bins |
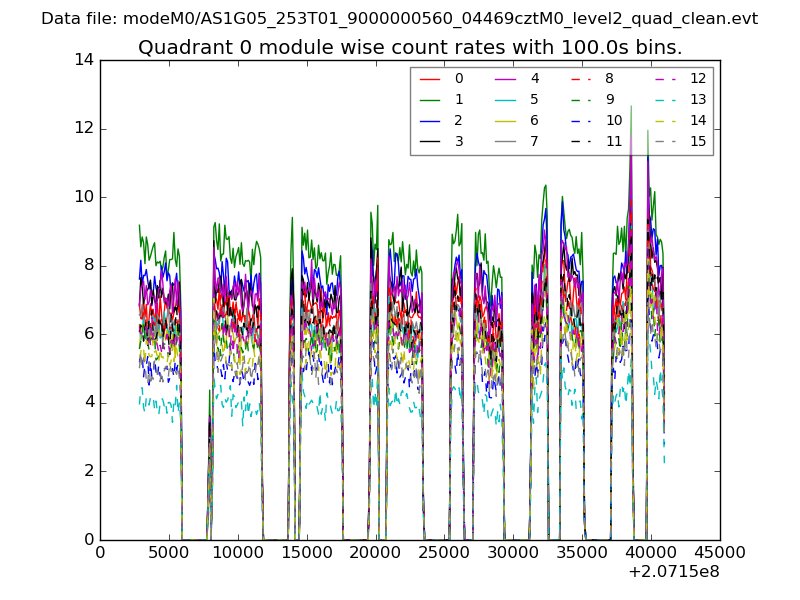 |
 |
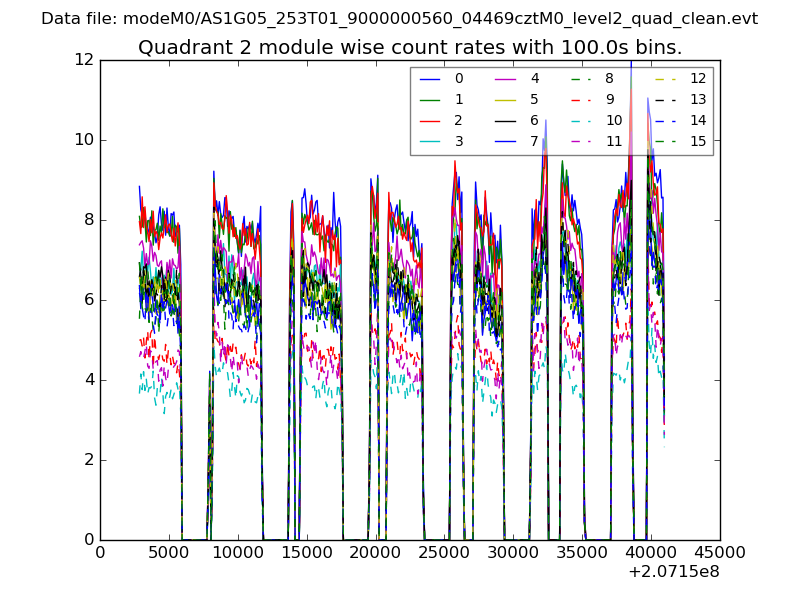
| Module-wise count rates for Quadrant B Data is divided into 100 sec bins |
 |
 |
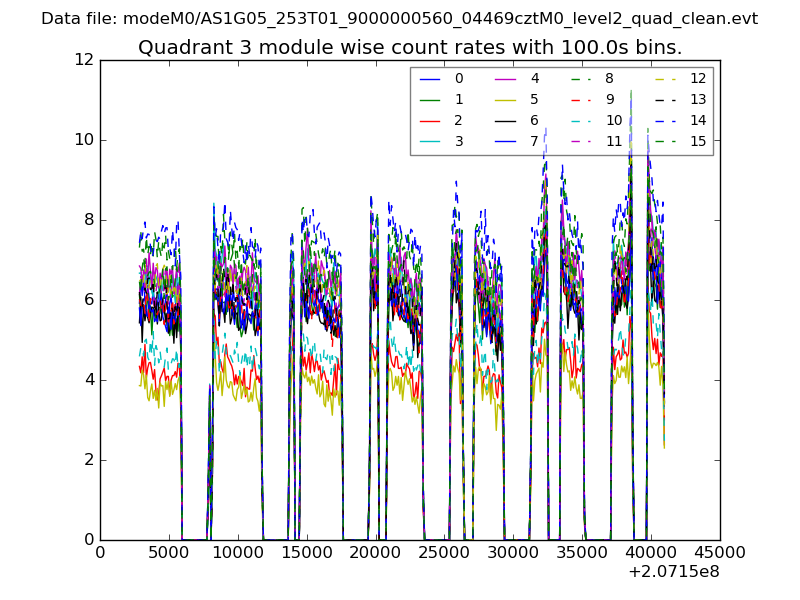
| Module-wise count rates for Quadrant C Data is divided into 100 sec bins |
 |
 |
| Module-wise count rates for Quadrant D Data is divided into 100 sec bins |
 |
 |
| Parameter | Plot |
|---|---|
| CZT HV Monitor | 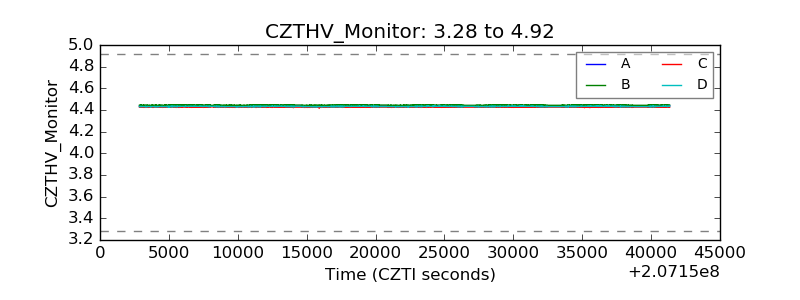 |
| D_VDD | 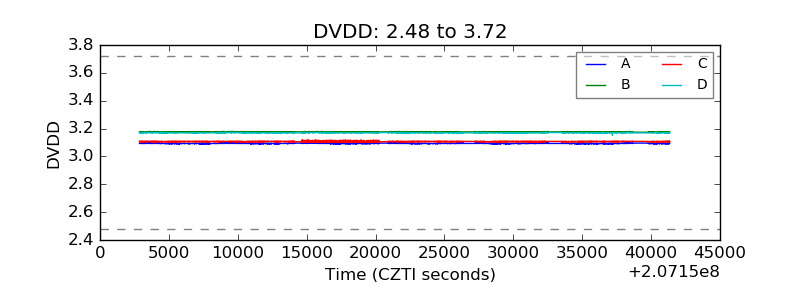 |
| Temperature 1 | 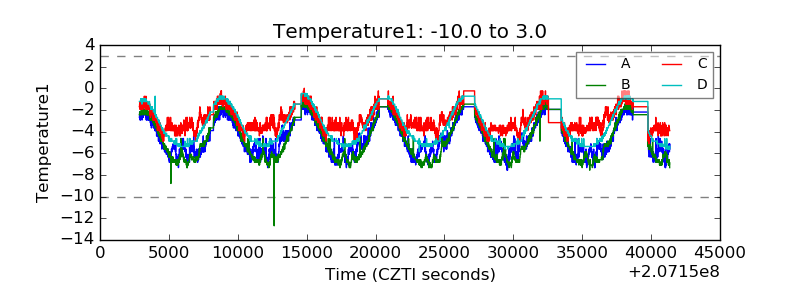 |
| Veto HV Monitor | 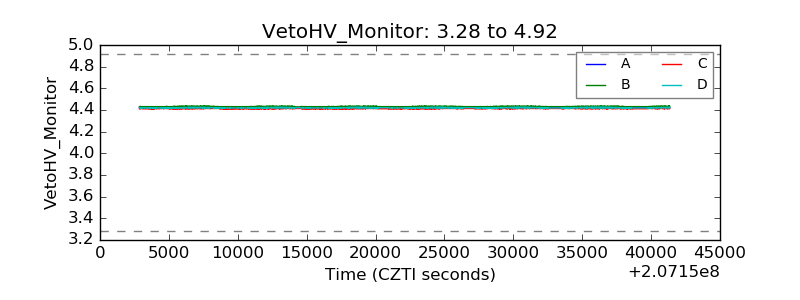 |
| Veto LLD | 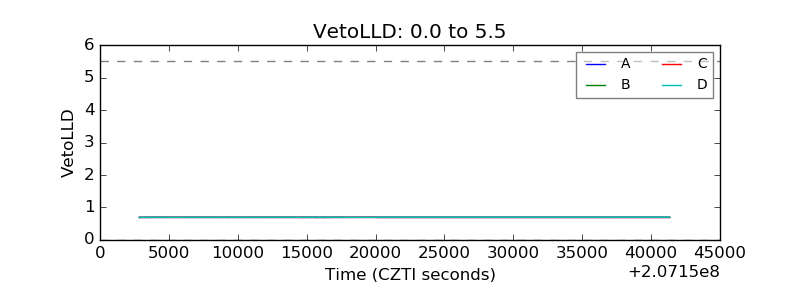 |
| Alpha Counter | 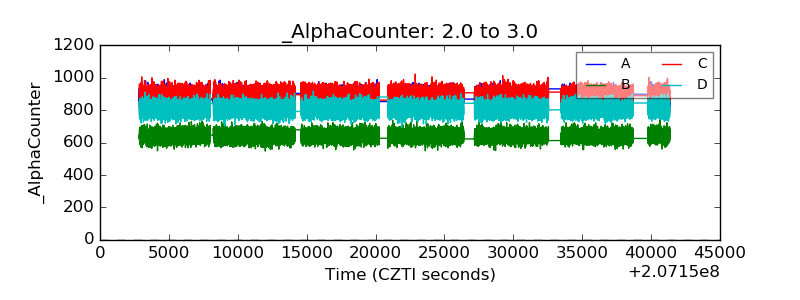 |
| _CPM_Rate | 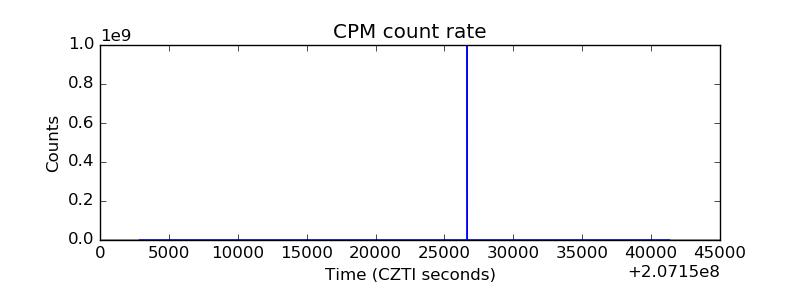 |
| CZT Counter | 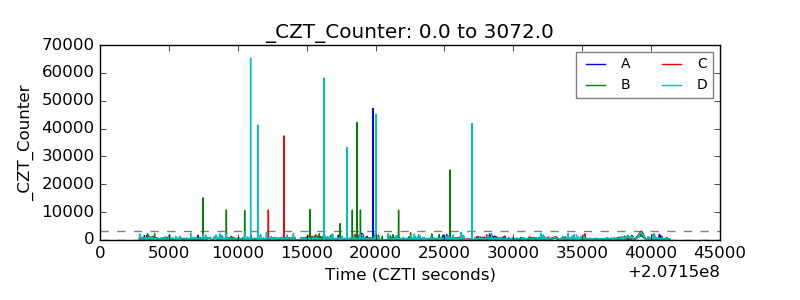 |
| +2.5 Volts monitor |  |
| +5 Volts monitor | 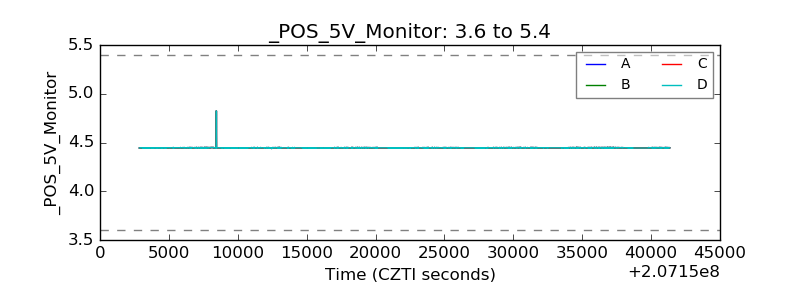 |
| _ROLL_ROT | 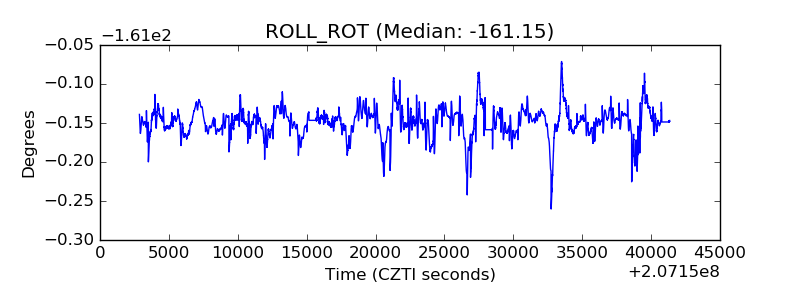 |
| _Roll_DEC | 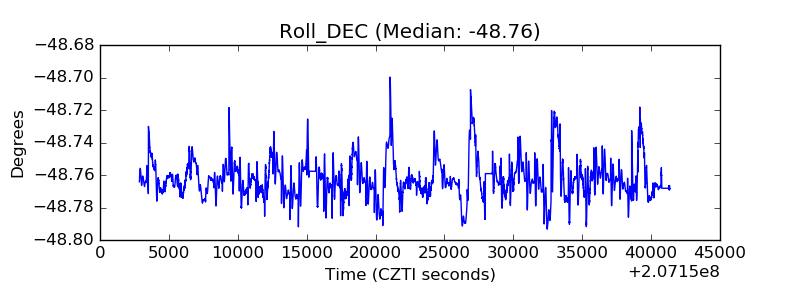 |
| _Roll_RA | 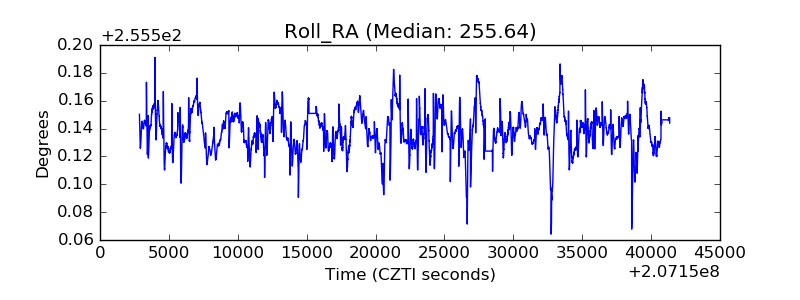 |
| Veto Counter | 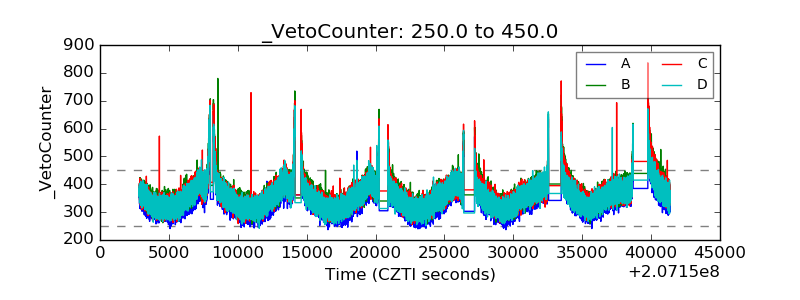 |