| Param | Original file | Final file |
|---|---|---|
| Filename | modeM0/AS1G05_253T01_9000000560_04470cztM0_level2.evt | modeM0/AS1G05_253T01_9000000560_04470cztM0_level2_quad_clean.evt |
| Size (bytes) | 1,018,206,720 | 156,395,520 |
| Size | 971.0 MB | 149.2 MB |
| Events in quadrant A | 7,573,555 | 933,582 |
| Events in quadrant B | 7,222,165 | 938,235 |
| Events in quadrant C | 7,207,441 | 944,699 |
| Events in quadrant D | 7,839,279 | 905,625 |
| Mode SS | |||
|---|---|---|---|
| Quadrant | BADHDUFLAG | Total packets | Discarded packets |
| A | 0 | 298 | 0 |
| B | 0 | 298 | 0 |
| C | 0 | 298 | 0 |
| D | 0 | 298 | 0 |
| Mode M9 | |||
|---|---|---|---|
| Quadrant | BADHDUFLAG | Total packets | Discarded packets |
| A | 0 | 32 | 0 |
| B | 0 | 32 | 0 |
| C | 0 | 32 | 0 |
| D | 0 | 32 | 0 |
| Mode M0 | |||
|---|---|---|---|
| Quadrant | BADHDUFLAG | Total packets | Discarded packets |
| A | 0 | 32861 | 3 |
| B | 0 | 31684 | 3 |
| C | 0 | 31706 | 3 |
| D | 0 | 33768 | 3 |
| Quadrant | Total seconds | Saturated seconds | Saturation percentage |
|---|---|---|---|
| A | 14697 | 297 | 2.020821% |
| B | 14697 | 161 | 1.095462% |
| C | 14697 | 111 | 0.755256% |
| D | 14697 | 193 | 1.313193% |
Noise dominated data is calculated using 1-second bins in cleaned event files. If a bin has >2000 counts, and if more than 50% of those come from <1% of pixels, then it is considered to be noise-dominated and hence unusable.
| Quadrant | # 1 sec bins | Bins with >0 counts | Bins with >2000 counts | High rate bins dominated by noise | Noise dominated (total time) | Noise dominated (detector-on time) | Marked lightcurve |
|---|---|---|---|---|---|---|---|
| A | 17872 | 14700 | 191 | 191 | 1.07% | 1.30% | 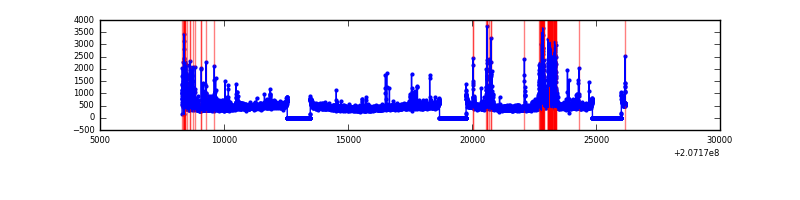 |
| B | 17872 | 14700 | 36 | 36 | 0.20% | 0.24% | 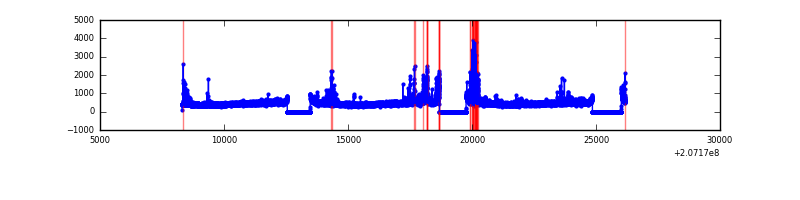 |
| C | 17872 | 14700 | 49 | 49 | 0.27% | 0.33% | 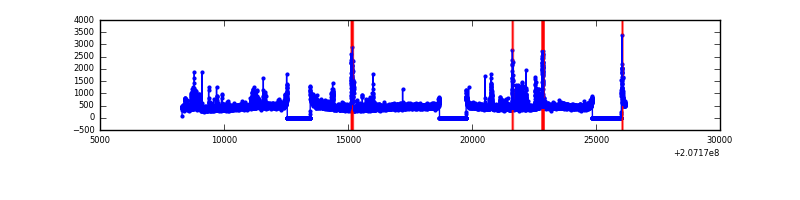 |
| D | 17872 | 14700 | 129 | 129 | 0.72% | 0.88% | 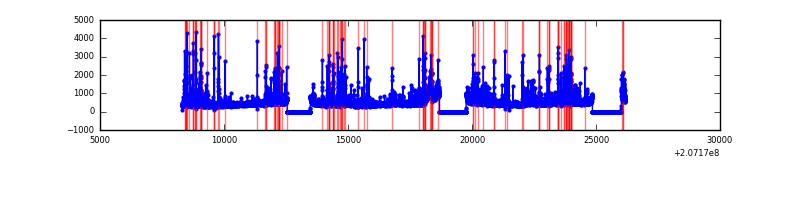 |
Top three noisy pixels from each quadrant. If the there are fewer than three noisy pixels in the level2.evt file, extra rows are filled as -1
| Pixel properties | Quadrant properties | ||||||
|---|---|---|---|---|---|---|---|
| Quadrant | DetID | PixID | Counts | Sigma | Mean | Median | Sigma |
| A | 0 | 13 | 1061112 | 3123.71 | 1654 | 1614 | 339.2 |
| A | 15 | 234 | 48495 | 138.22 | 1654 | 1614 | 339.2 |
| A | 0 | 50 | 40617 | 114.99 | 1654 | 1614 | 339.2 |
| B | 8 | 3 | 253217 | 776.69 | 1687 | 1646 | 323.9 |
| B | 4 | 48 | 240518 | 737.48 | 1687 | 1646 | 323.9 |
| B | 15 | 204 | 71541 | 215.79 | 1687 | 1646 | 323.9 |
| C | 14 | 48 | 604559 | 1599.49 | 1629 | 1635 | 376.9 |
| C | 9 | 16 | 132928 | 348.3 | 1629 | 1635 | 376.9 |
| C | 9 | 247 | 83088 | 216.09 | 1629 | 1635 | 376.9 |
| D | 13 | 235 | 811096 | 2107.92 | 1609 | 1565 | 384.0 |
| D | 12 | 79 | 561713 | 1458.56 | 1609 | 1565 | 384.0 |
| D | 2 | 136 | 72694 | 185.21 | 1609 | 1565 | 384.0 |
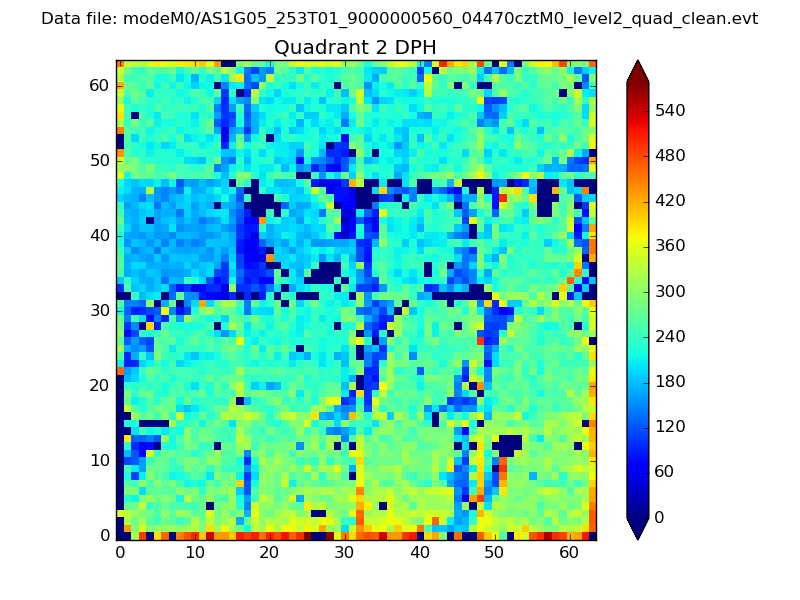
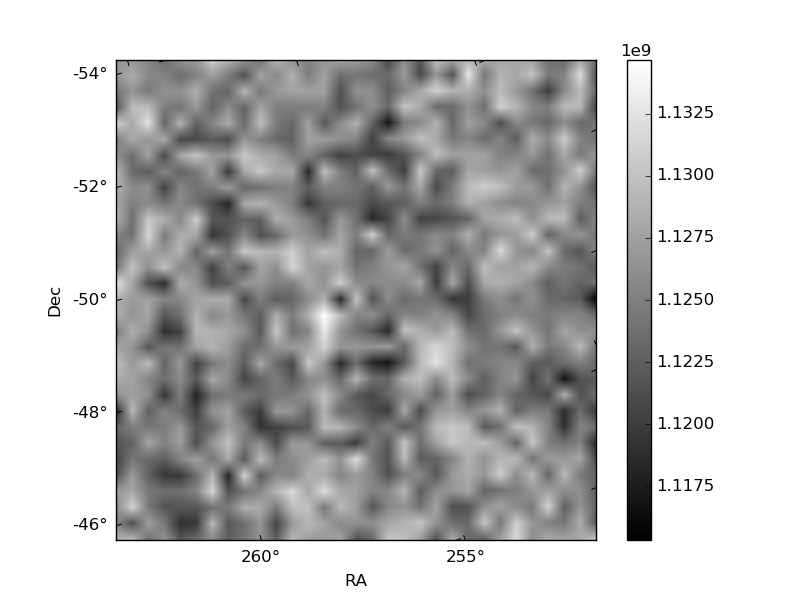
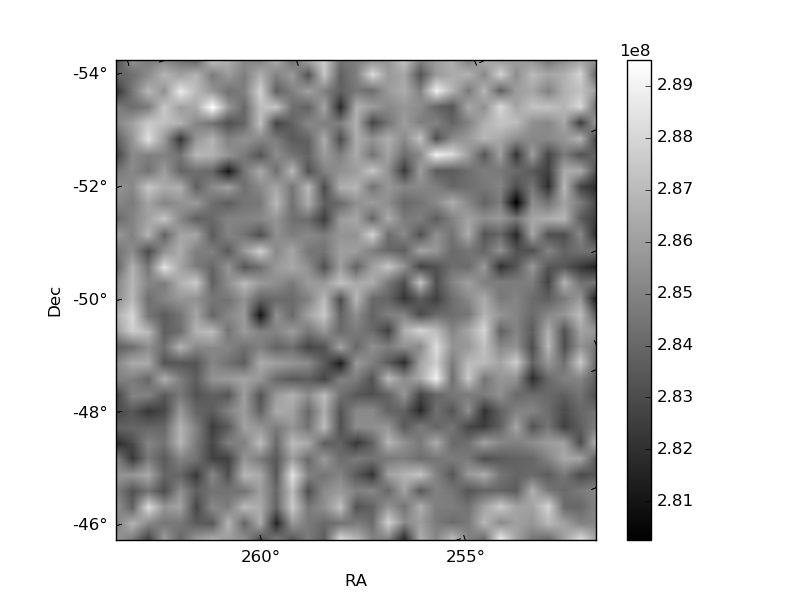
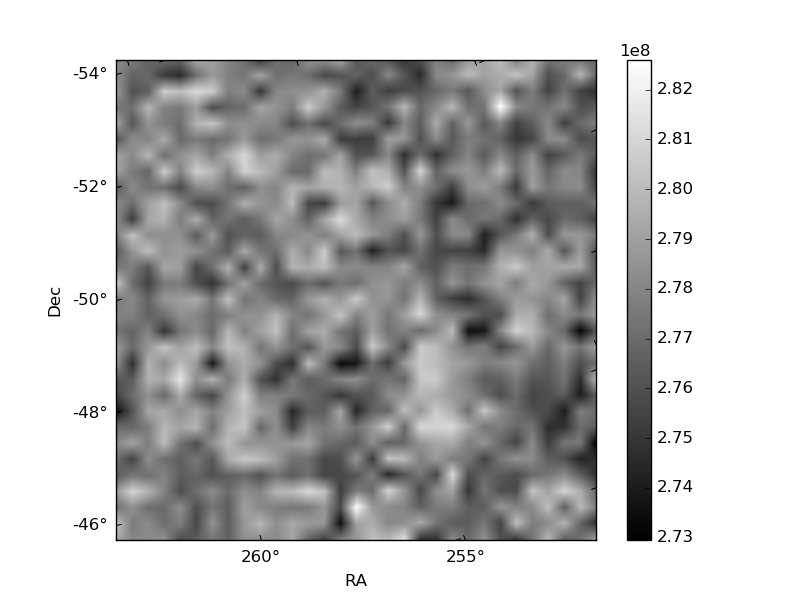
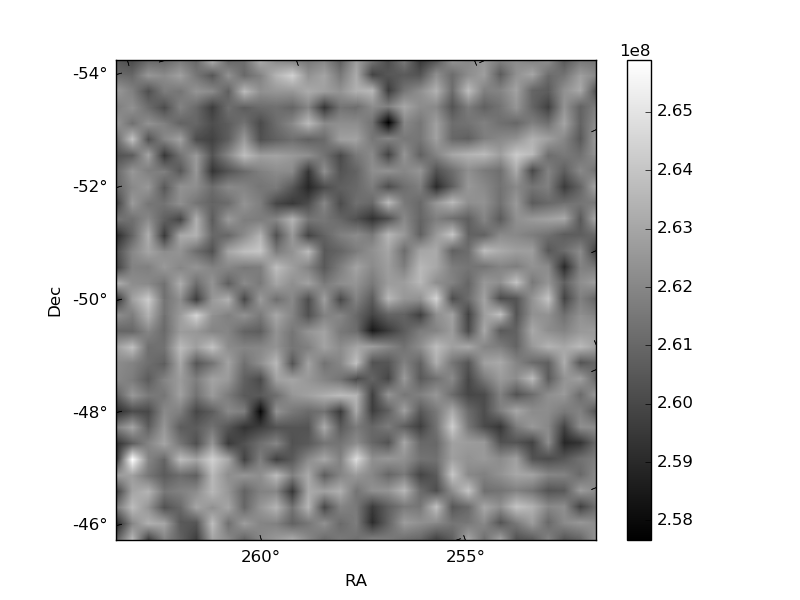
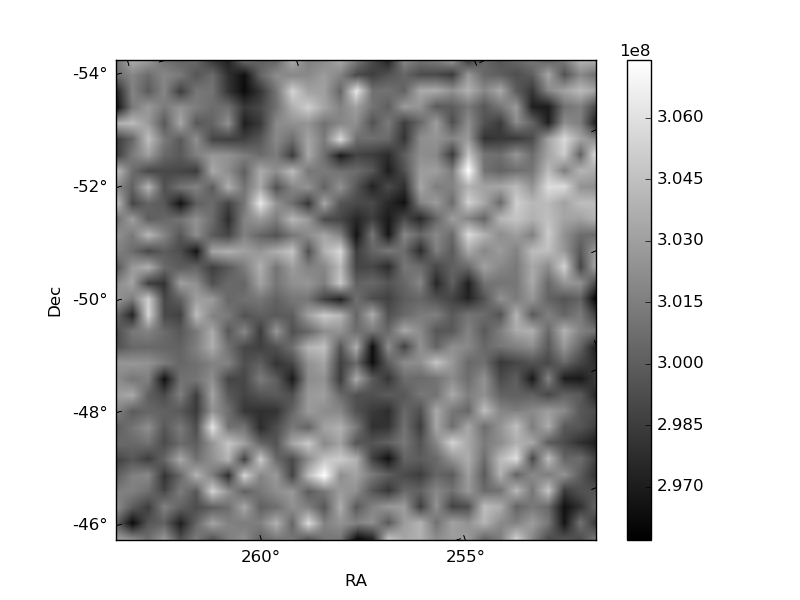
Histogram calculated using DETX and DETY for each event in the final _common_clean file
| Quadrant A | 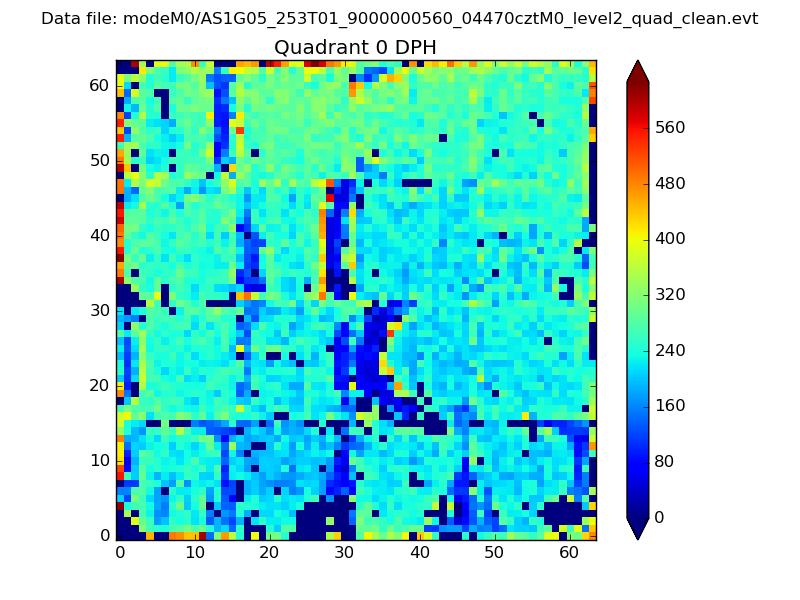 |
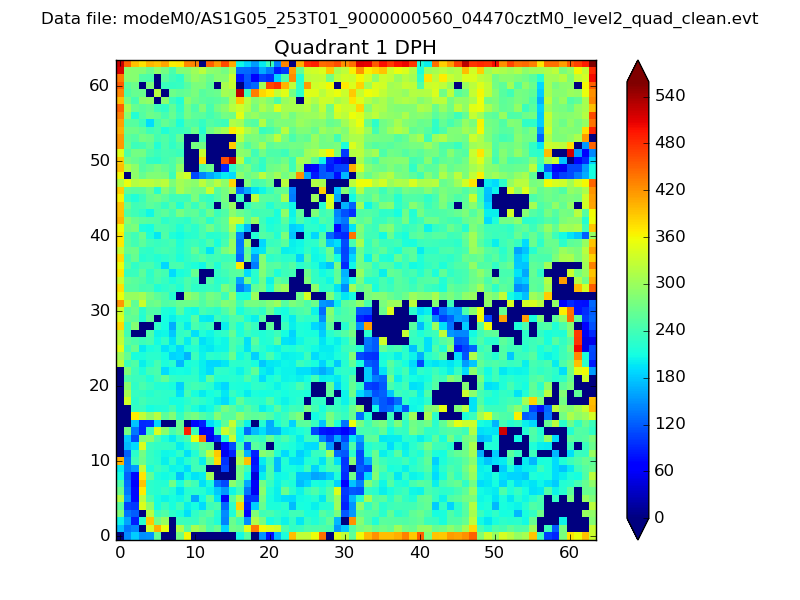 |
Quadrant B |
|---|---|---|---|
| Quadrant D | 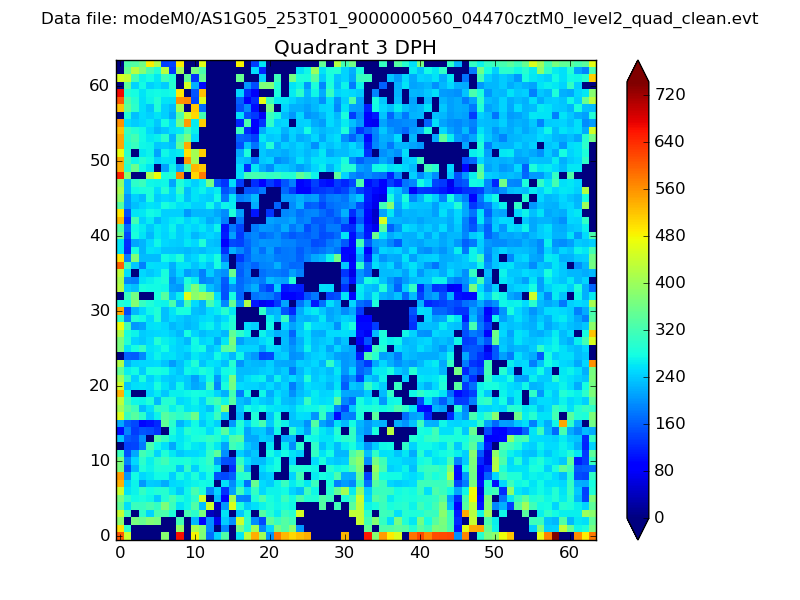 |
 |
Quadrant C |
| Plot type | Count rate plots | Images |
|---|---|---|
| Comparison with Poisson distribution Blue bars denote a histogram of data divided into 1 sec bins. Red curve is a Poisson curve with rate = median count rate of data. |
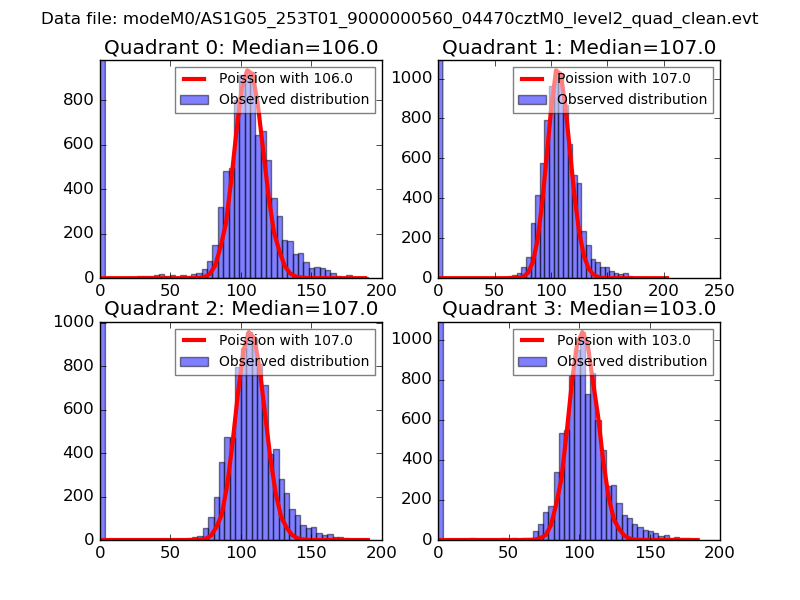 |
 |
| Quadrant-wise count rates Data is divided into 100 sec bins |
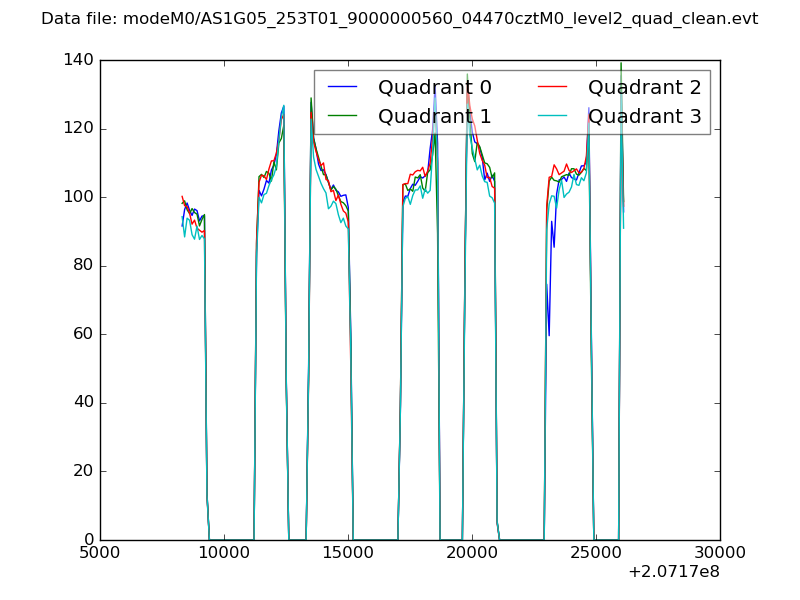 |
|
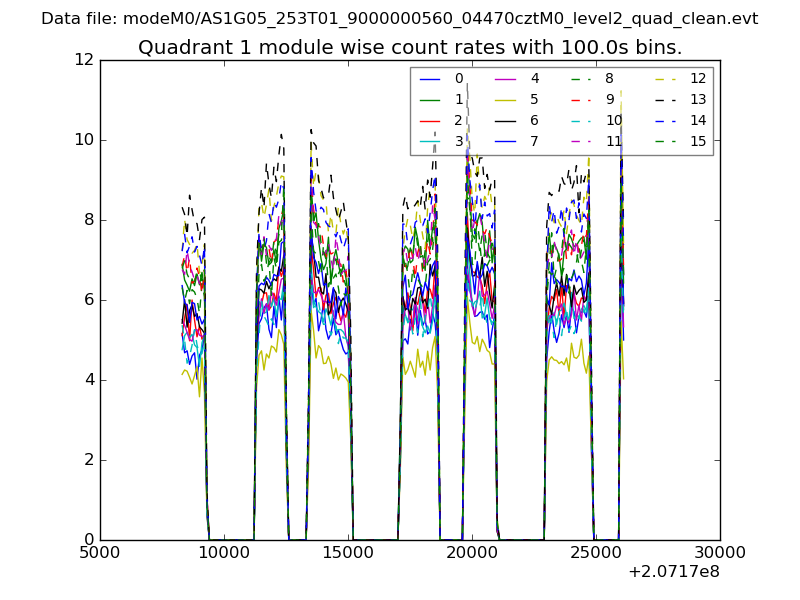
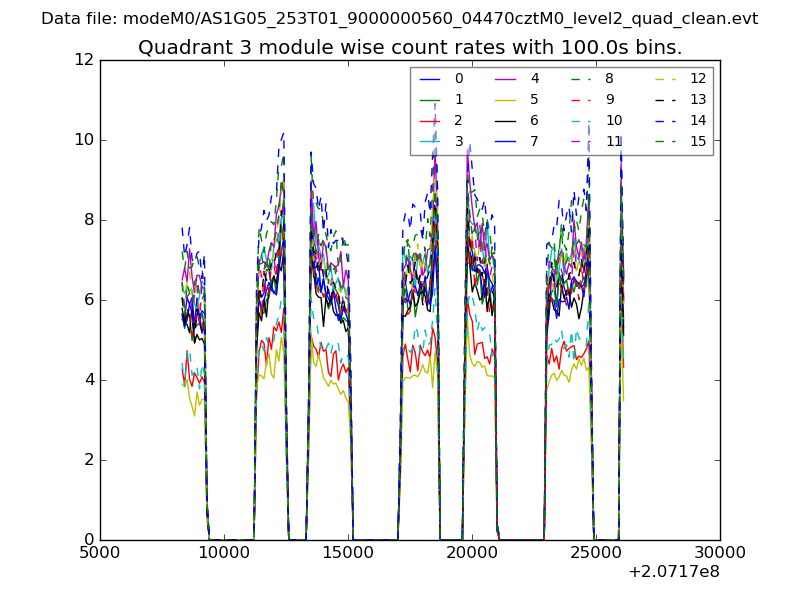
| Module-wise count rates for Quadrant A Data is divided into 100 sec bins |
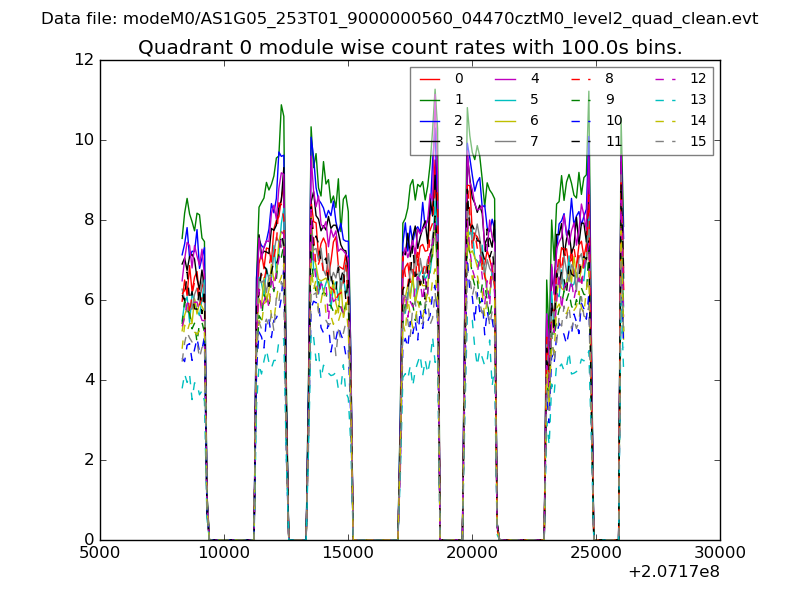 |
 |
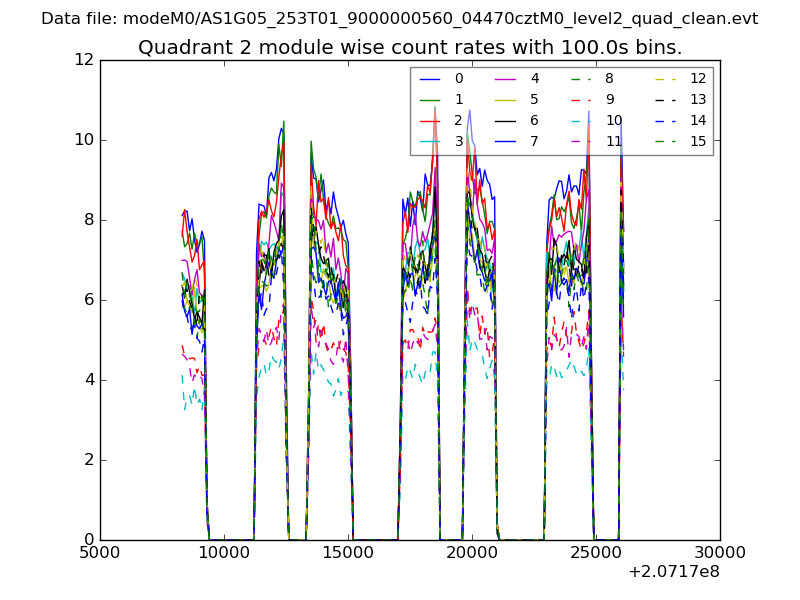
| Module-wise count rates for Quadrant B Data is divided into 100 sec bins |
 |
 |
| Module-wise count rates for Quadrant C Data is divided into 100 sec bins |
 |
 |
| Module-wise count rates for Quadrant D Data is divided into 100 sec bins |
 |
 |
| Parameter | Plot |
|---|---|
| CZT HV Monitor | 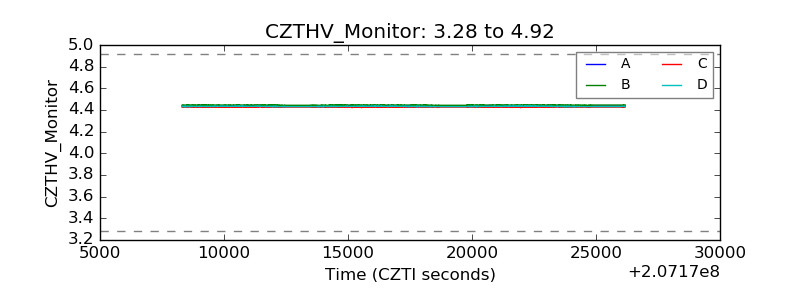 |
| D_VDD | 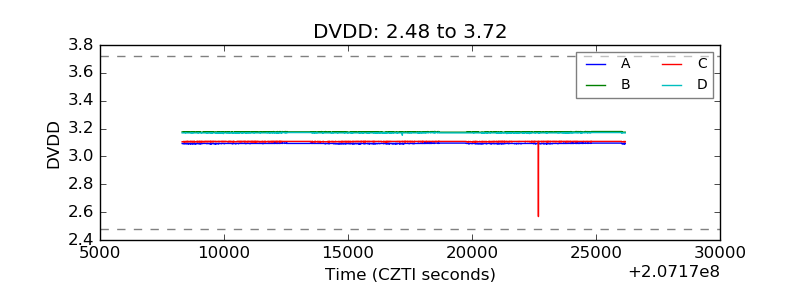 |
| Temperature 1 | 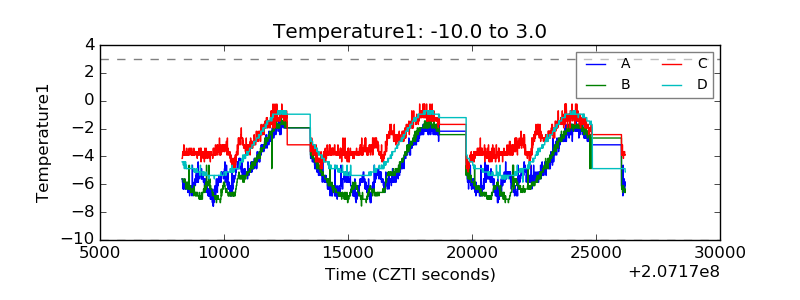 |
| Veto HV Monitor | 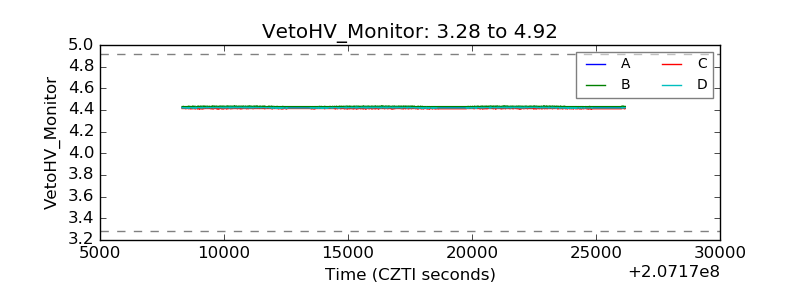 |
| Veto LLD | 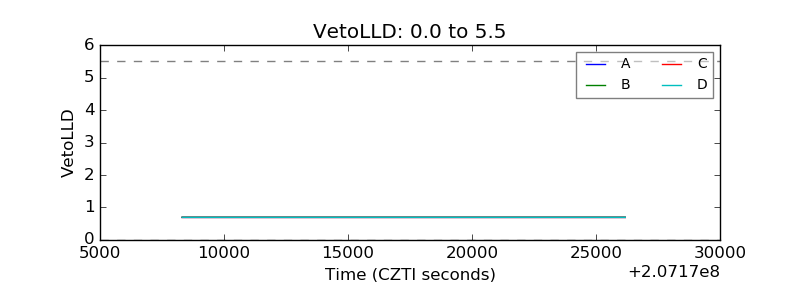 |
| Alpha Counter | 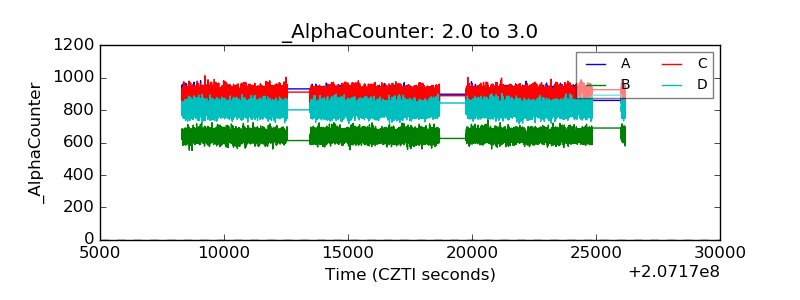 |
| _CPM_Rate | 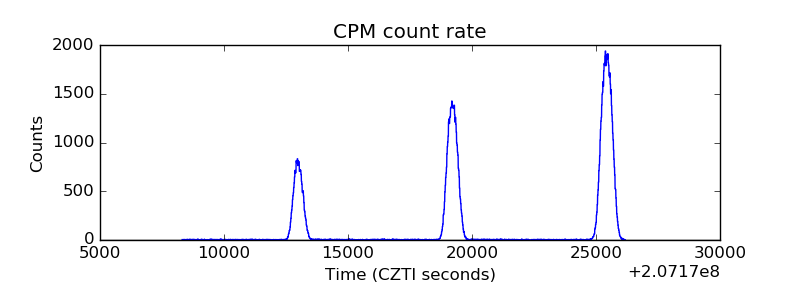 |
| CZT Counter | 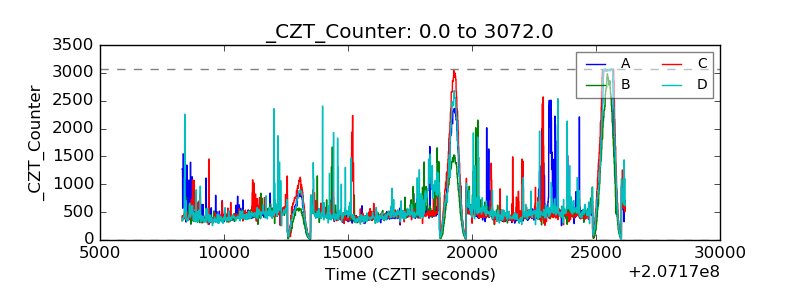 |
| +2.5 Volts monitor |  |
| +5 Volts monitor |  |
| _ROLL_ROT | 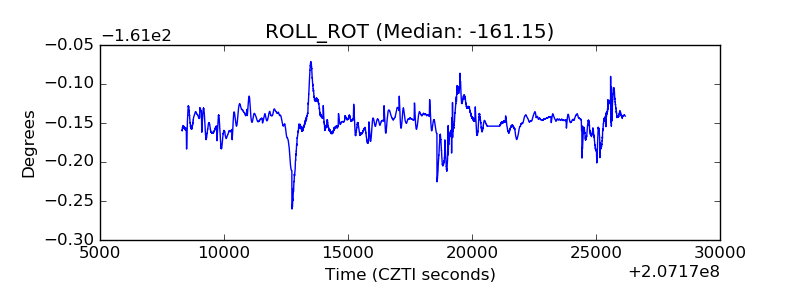 |
| _Roll_DEC | 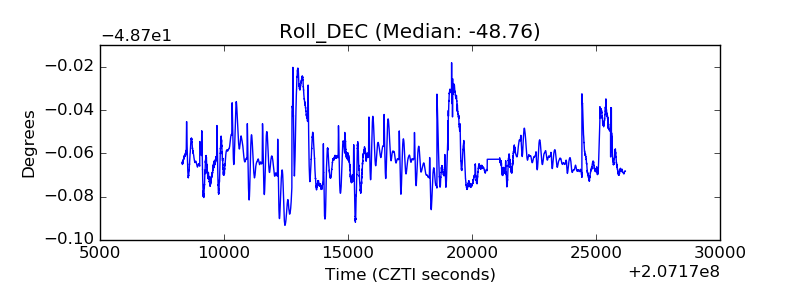 |
| _Roll_RA | 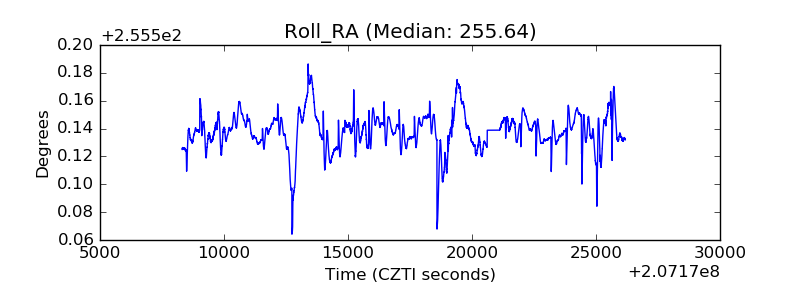 |
| Veto Counter | 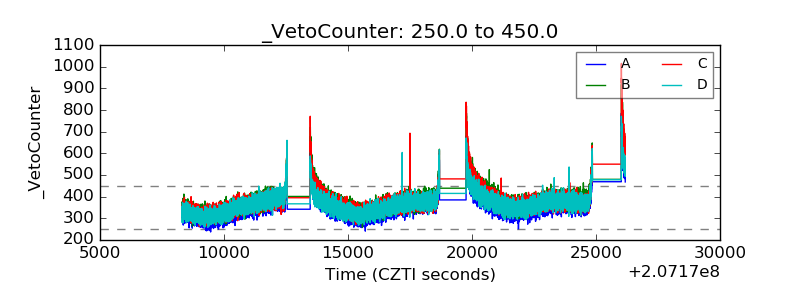 |