| Param | Original file | Final file |
|---|---|---|
| Filename | modeM0/AS1G05_253T01_9000000560_04471cztM0_level2.evt | modeM0/AS1G05_253T01_9000000560_04471cztM0_level2_quad_clean.evt |
| Size (bytes) | 2,186,081,280 | 342,676,800 |
| Size | 2.0 GB | 326.8 MB |
| Events in quadrant A | 15,976,153 | 2,063,381 |
| Events in quadrant B | 16,238,662 | 2,053,397 |
| Events in quadrant C | 15,258,553 | 2,071,777 |
| Events in quadrant D | 16,574,825 | 1,994,781 |
| Mode SS | |||
|---|---|---|---|
| Quadrant | BADHDUFLAG | Total packets | Discarded packets |
| A | 0 | 650 | 0 |
| B | 0 | 650 | 0 |
| C | 0 | 650 | 0 |
| D | 0 | 650 | 0 |
| Mode M9 | |||
|---|---|---|---|
| Quadrant | BADHDUFLAG | Total packets | Discarded packets |
| A | 0 | 51 | 0 |
| B | 0 | 51 | 0 |
| C | 0 | 51 | 0 |
| D | 0 | 51 | 0 |
| Mode M0 | |||
|---|---|---|---|
| Quadrant | BADHDUFLAG | Total packets | Discarded packets |
| A | 0 | 70254 | 25 |
| B | 0 | 70160 | 24 |
| C | 0 | 68012 | 12 |
| D | 0 | 72594 | 16 |
| Quadrant | Total seconds | Saturated seconds | Saturation percentage |
|---|---|---|---|
| A | 31946 | 529 | 1.655919% |
| B | 31945 | 325 | 1.017374% |
| C | 31950 | 147 | 0.460094% |
| D | 31948 | 487 | 1.524352% |
Noise dominated data is calculated using 1-second bins in cleaned event files. If a bin has >2000 counts, and if more than 50% of those come from <1% of pixels, then it is considered to be noise-dominated and hence unusable.
| Quadrant | # 1 sec bins | Bins with >0 counts | Bins with >2000 counts | High rate bins dominated by noise | Noise dominated (total time) | Noise dominated (detector-on time) | Marked lightcurve |
|---|---|---|---|---|---|---|---|
| A | 37013 | 31959 | 300 | 300 | 0.81% | 0.94% | 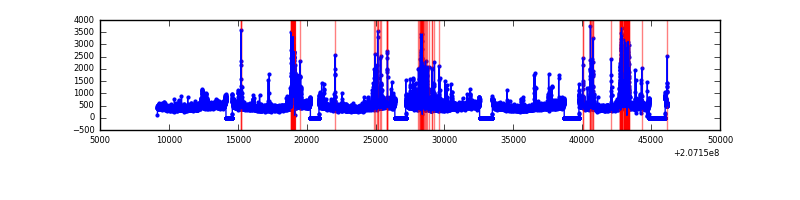 |
| B | 37013 | 31959 | 96 | 96 | 0.26% | 0.30% | 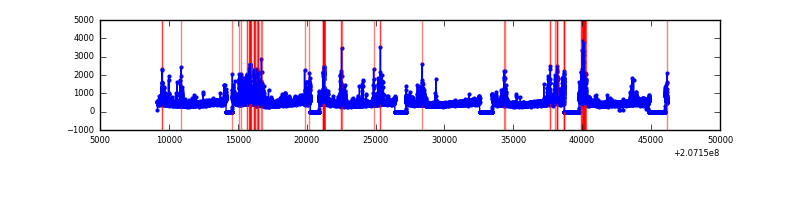 |
| C | 37013 | 31959 | 65 | 65 | 0.18% | 0.20% | 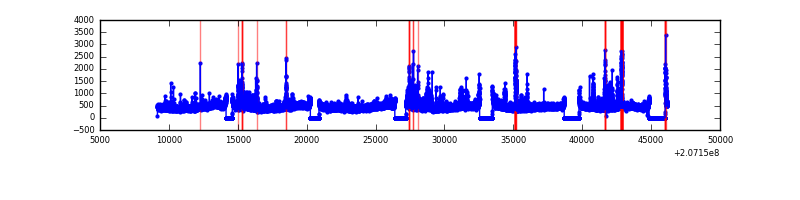 |
| D | 37013 | 31959 | 319 | 319 | 0.86% | 1.00% | 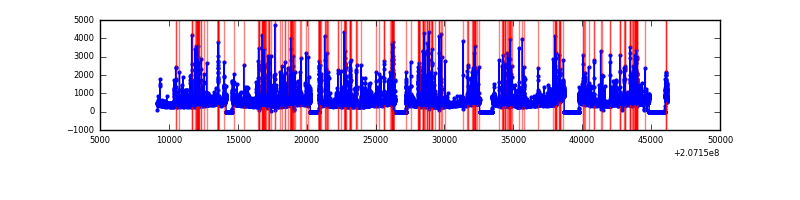 |
Top three noisy pixels from each quadrant. If the there are fewer than three noisy pixels in the level2.evt file, extra rows are filled as -1
| Pixel properties | Quadrant properties | ||||||
|---|---|---|---|---|---|---|---|
| Quadrant | DetID | PixID | Counts | Sigma | Mean | Median | Sigma |
| A | 0 | 13 | 1822023 | 2483.83 | 3591 | 3510 | 732.1 |
| A | 0 | 118 | 114141 | 151.11 | 3591 | 3510 | 732.1 |
| A | 15 | 234 | 54170 | 69.19 | 3591 | 3510 | 732.1 |
| B | 14 | 167 | 613888 | 874.27 | 3652 | 3573 | 698.1 |
| B | 4 | 48 | 478594 | 680.46 | 3652 | 3573 | 698.1 |
| B | 15 | 204 | 313506 | 443.98 | 3652 | 3573 | 698.1 |
| C | 14 | 48 | 929787 | 1143.85 | 3514 | 3530 | 809.8 |
| C | 9 | 16 | 399728 | 489.27 | 3514 | 3530 | 809.8 |
| C | 9 | 247 | 129294 | 155.31 | 3514 | 3530 | 809.8 |
| D | 13 | 235 | 1719540 | 2054.77 | 3470 | 3367 | 835.2 |
| D | 12 | 79 | 564677 | 672.05 | 3470 | 3367 | 835.2 |
| D | 2 | 136 | 349311 | 414.2 | 3470 | 3367 | 835.2 |
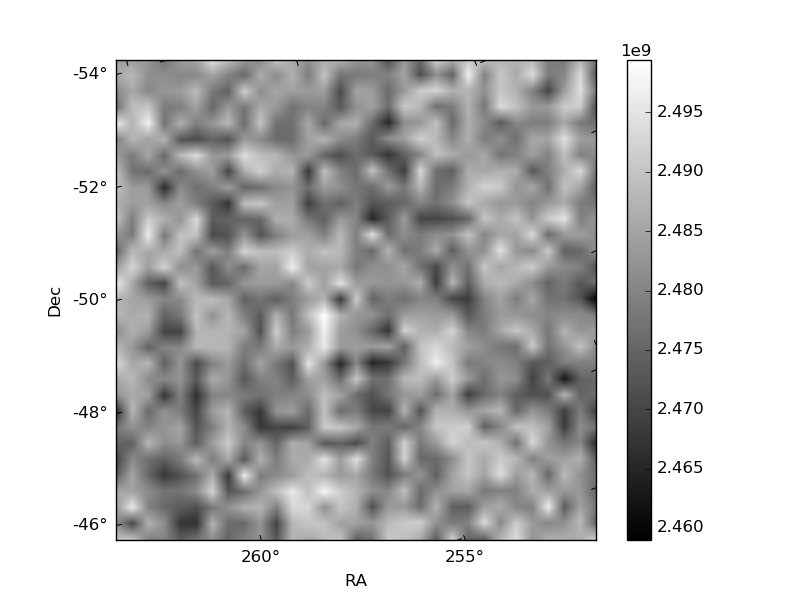
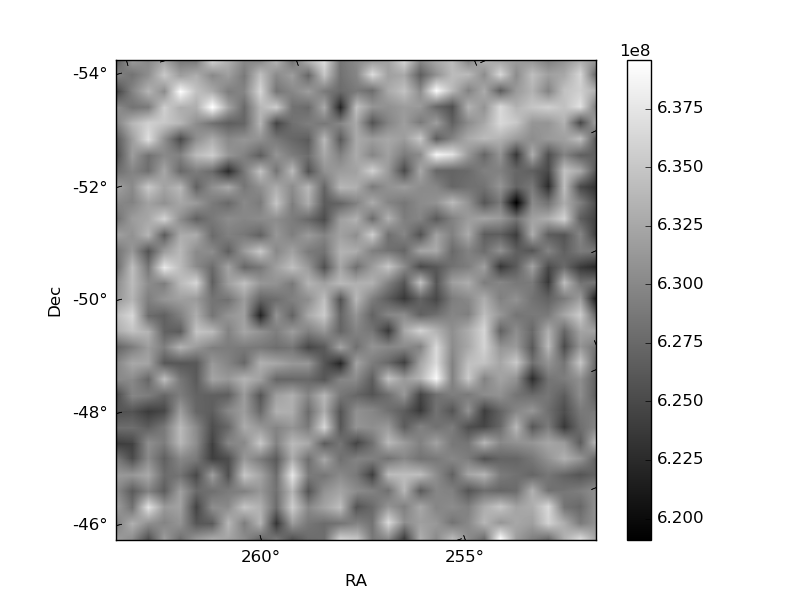
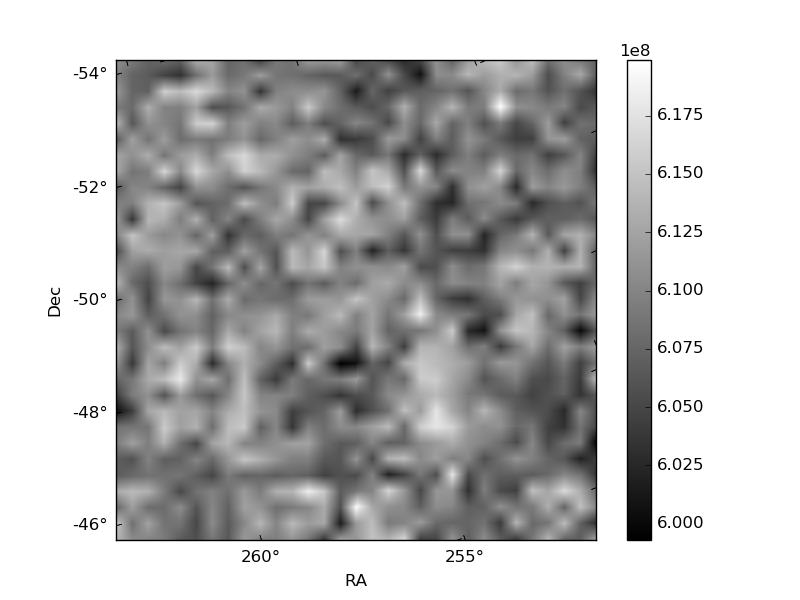
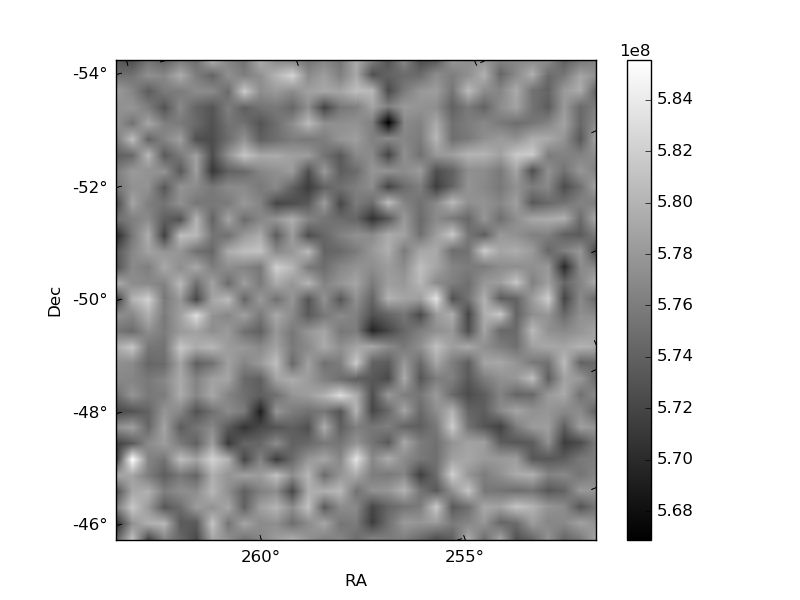
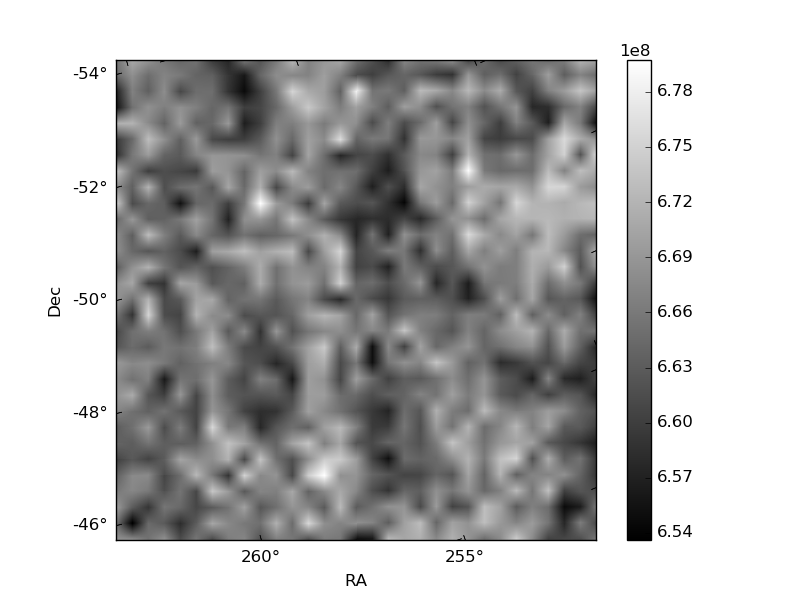
Histogram calculated using DETX and DETY for each event in the final _common_clean file
| Quadrant A | 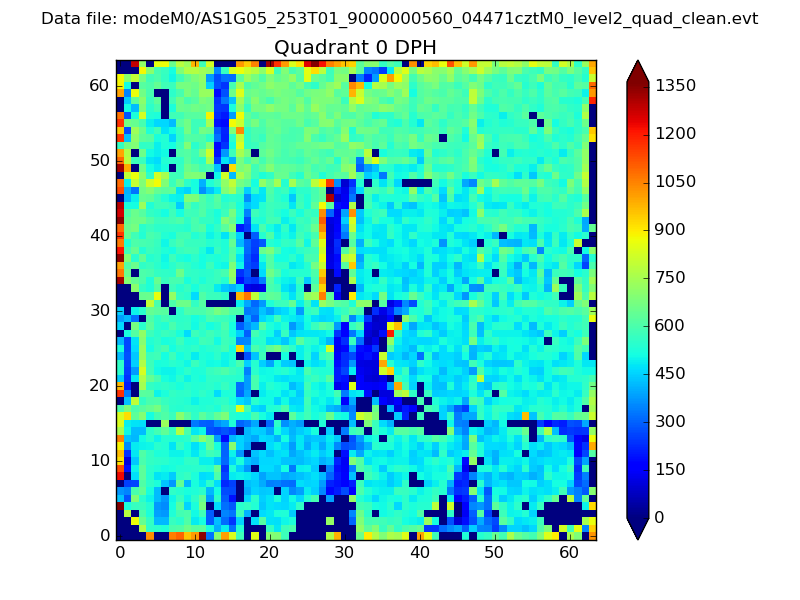 |
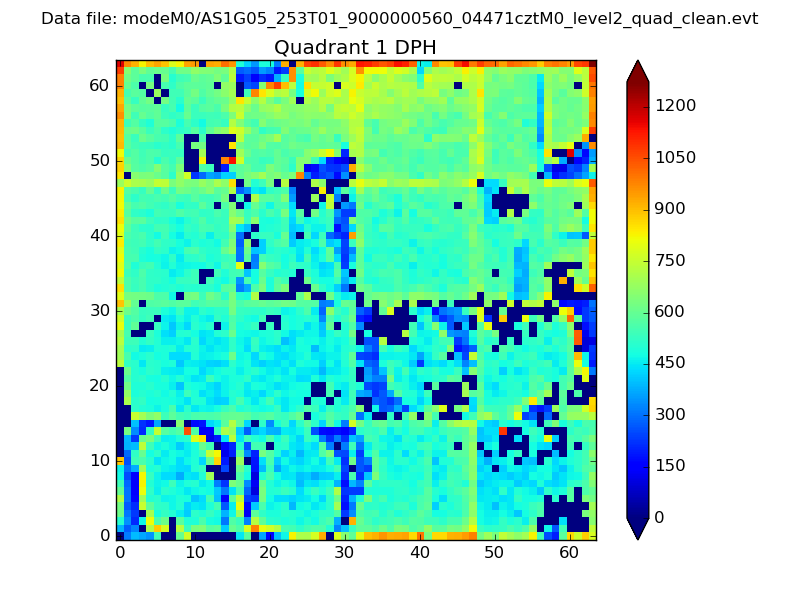 |
Quadrant B |
|---|---|---|---|
| Quadrant D | 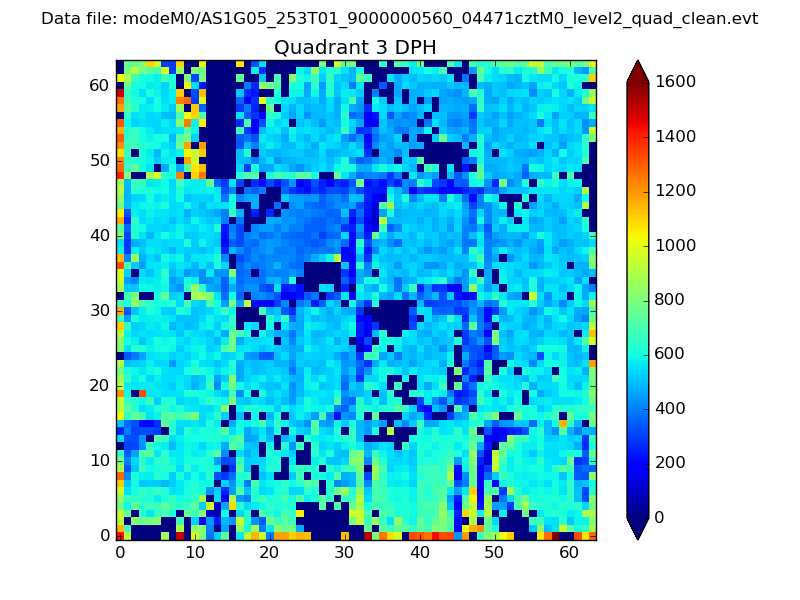 |
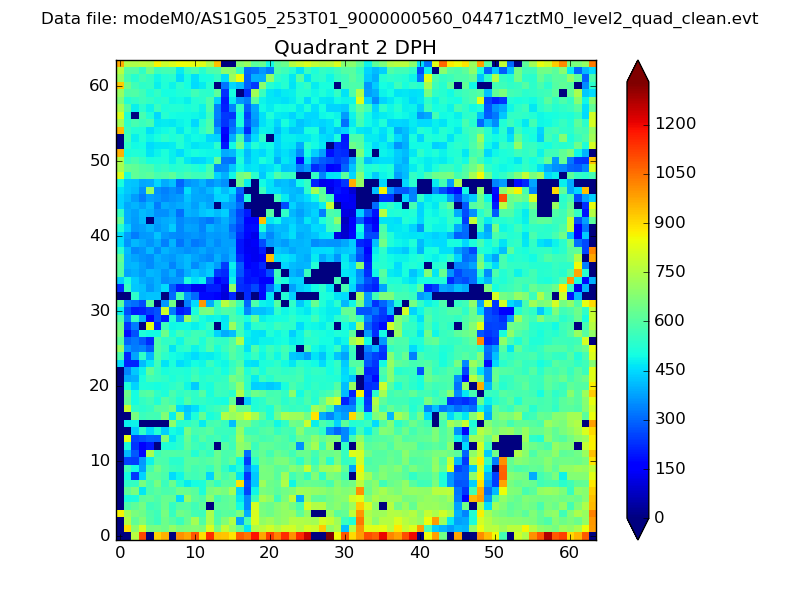 |
Quadrant C |
| Plot type | Count rate plots | Images |
|---|---|---|
| Comparison with Poisson distribution Blue bars denote a histogram of data divided into 1 sec bins. Red curve is a Poisson curve with rate = median count rate of data. |
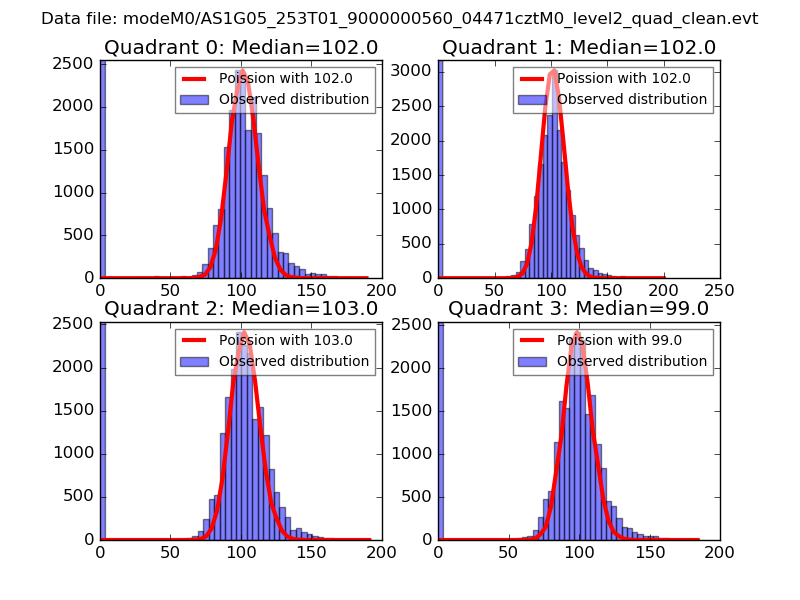 |
 |
| Quadrant-wise count rates Data is divided into 100 sec bins |
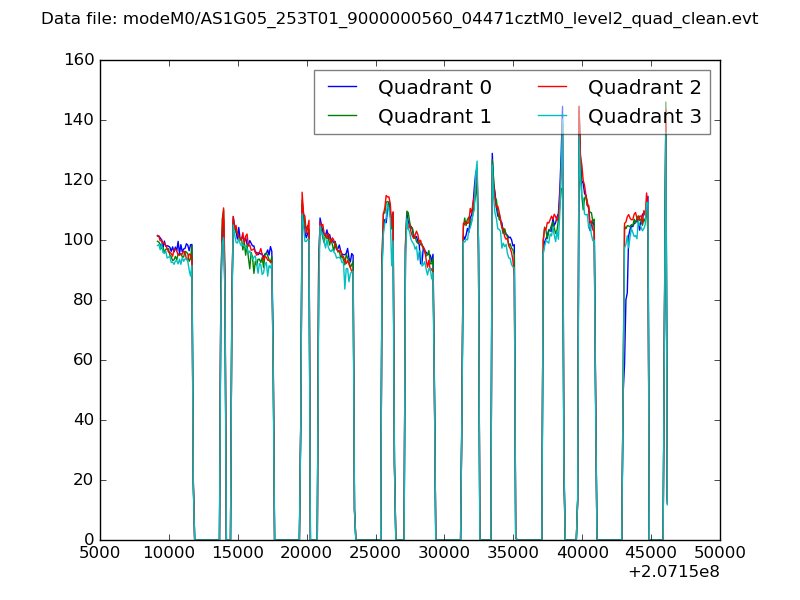 |
|
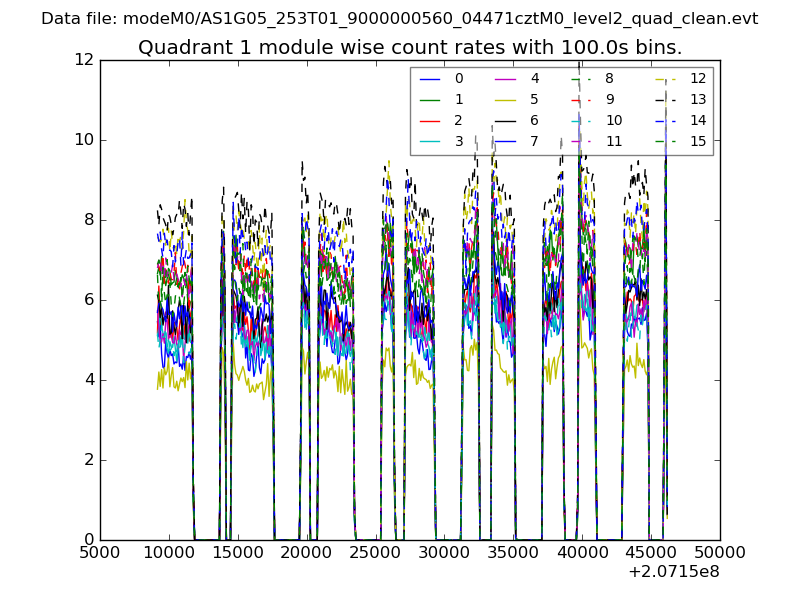
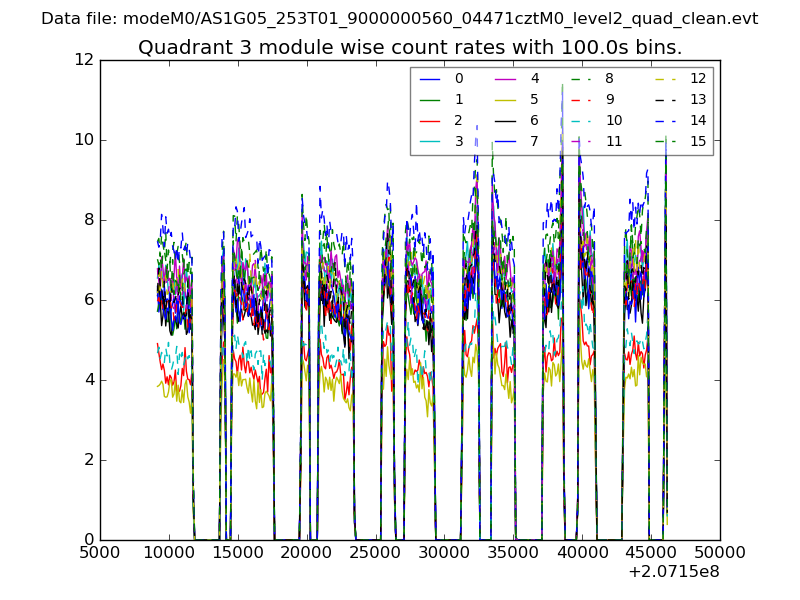
| Module-wise count rates for Quadrant A Data is divided into 100 sec bins |
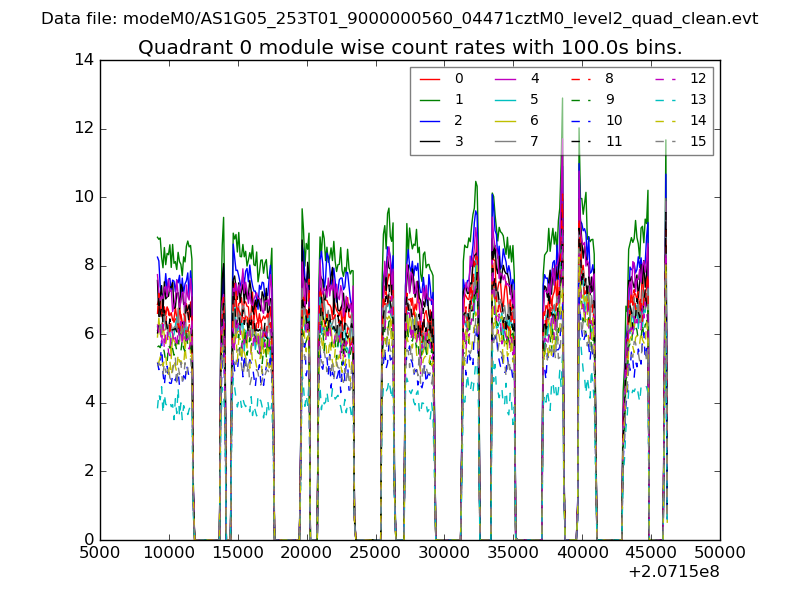 |
 |
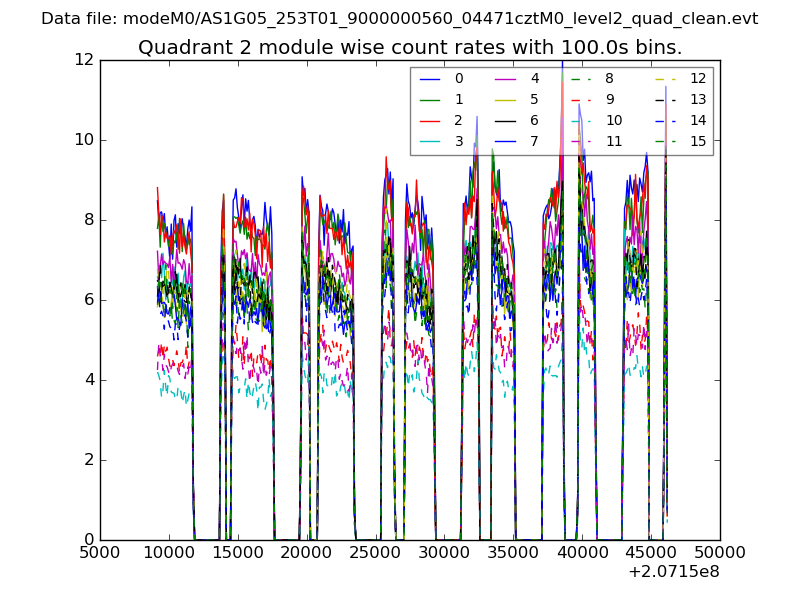
| Module-wise count rates for Quadrant B Data is divided into 100 sec bins |
 |
 |
| Module-wise count rates for Quadrant C Data is divided into 100 sec bins |
 |
 |
| Module-wise count rates for Quadrant D Data is divided into 100 sec bins |
 |
 |
| Parameter | Plot |
|---|---|
| CZT HV Monitor | 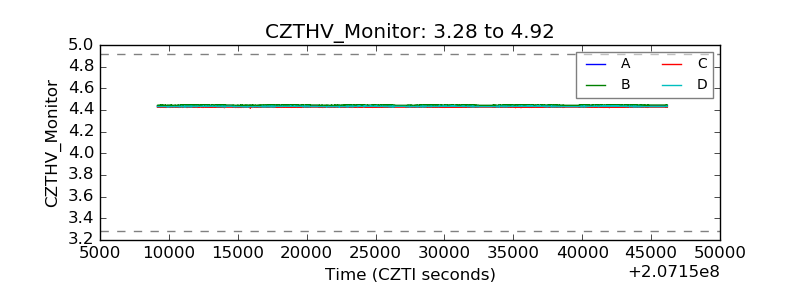 |
| D_VDD | 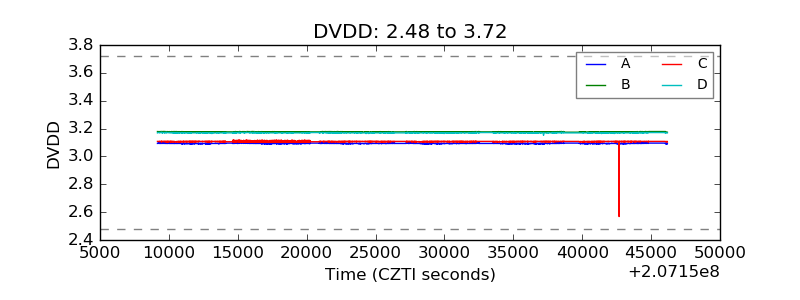 |
| Temperature 1 | 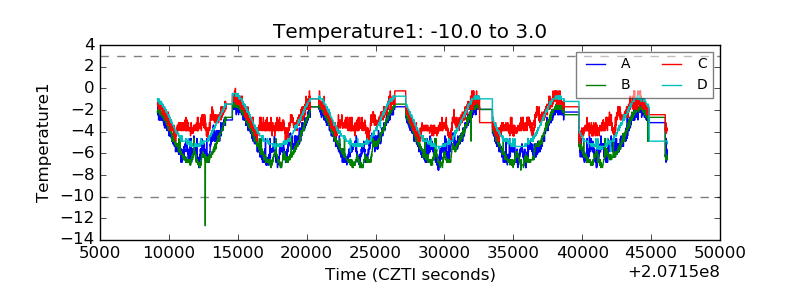 |
| Veto HV Monitor | 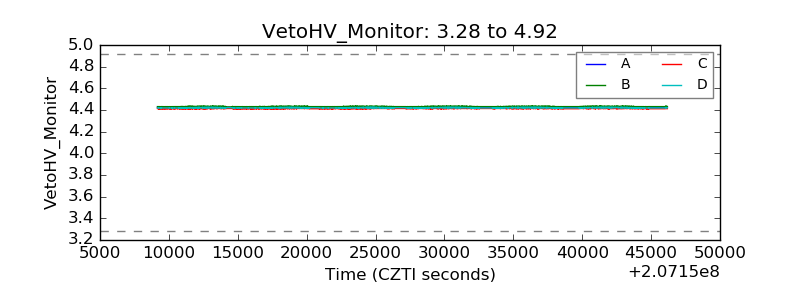 |
| Veto LLD | 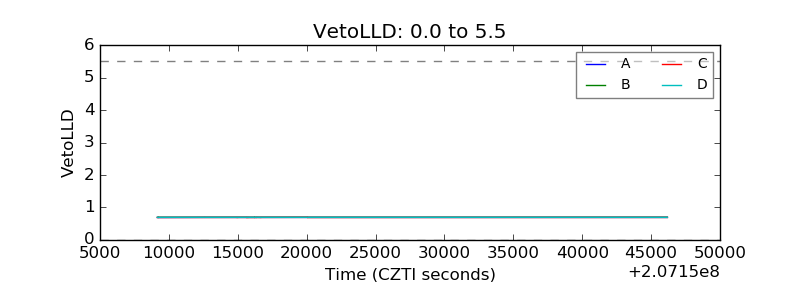 |
| Alpha Counter | 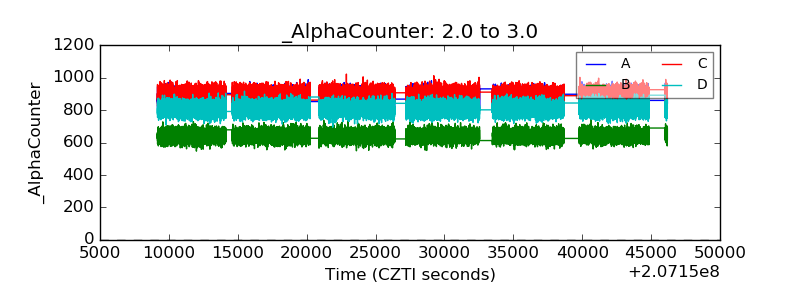 |
| _CPM_Rate | 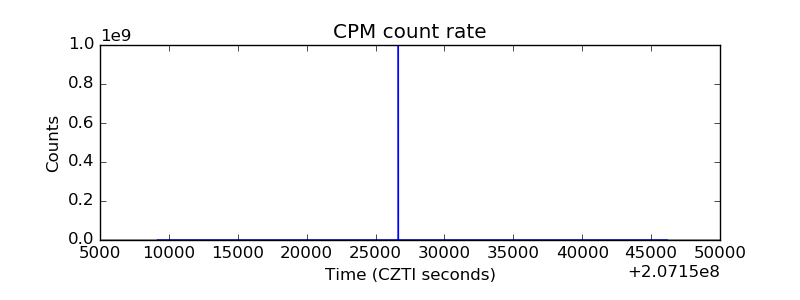 |
| CZT Counter | 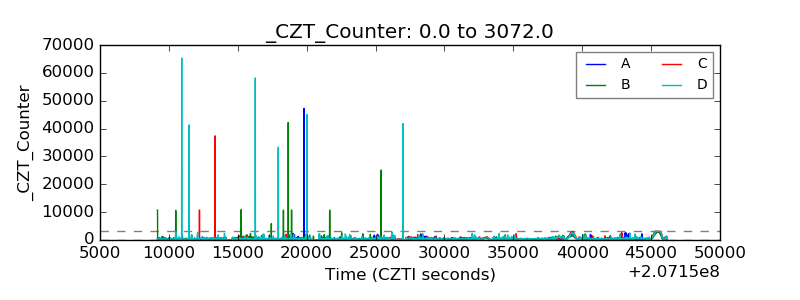 |
| +2.5 Volts monitor |  |
| +5 Volts monitor |  |
| _ROLL_ROT | 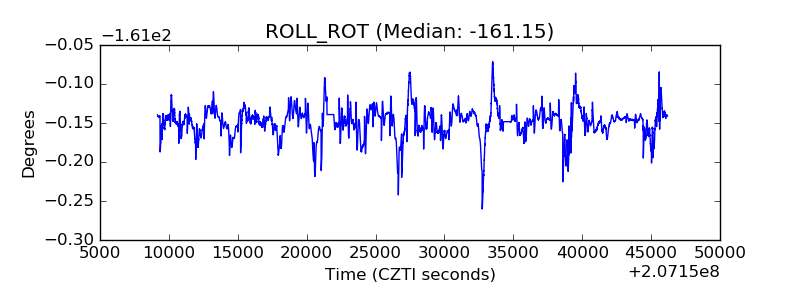 |
| _Roll_DEC | 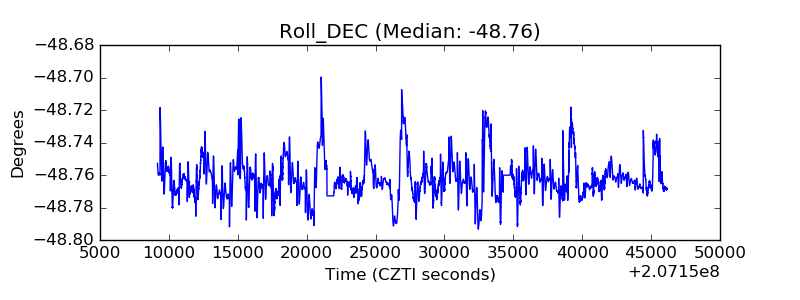 |
| _Roll_RA | 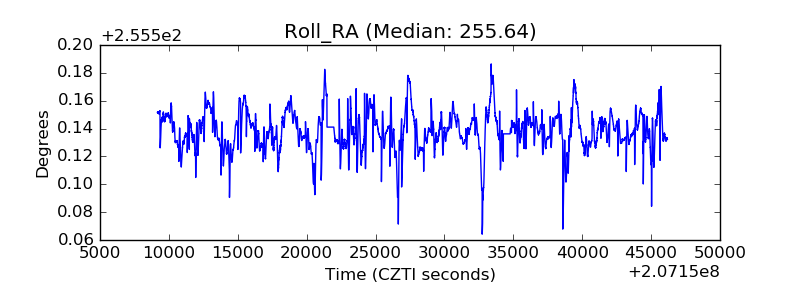 |
| Veto Counter | 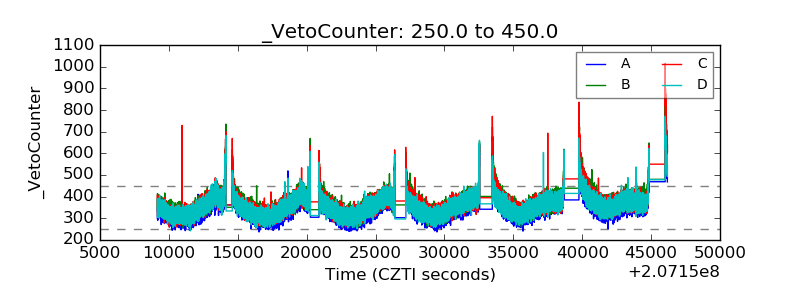 |