| Param | Original file | Final file |
|---|---|---|
| Filename | modeM0/AS1SLEW_01234_9000000555_04442cztM0_level2.evt | modeM0/AS1SLEW_01234_9000000555_04442cztM0_level2_quad_clean.evt |
| Size (bytes) | 96,963,840 | 4,011,840 |
| Size | 92.5 MB | 3.8 MB |
| Events in quadrant A | 704,848 | 3,829 |
| Events in quadrant B | 730,656 | 3,827 |
| Events in quadrant C | 688,347 | 3,615 |
| Events in quadrant D | 713,100 | 3,601 |
| Mode M0 | |||
|---|---|---|---|
| Quadrant | BADHDUFLAG | Total packets | Discarded packets |
| A | 0 | 2916 | 2 |
| B | 0 | 2990 | 1 |
| C | 0 | 2892 | 1 |
| D | 0 | 3047 | 1 |
| Mode SS | |||
|---|---|---|---|
| Quadrant | BADHDUFLAG | Total packets | Discarded packets |
| A | 0 | 30 | 0 |
| B | 0 | 30 | 0 |
| C | 0 | 30 | 0 |
| D | 0 | 30 | 0 |
| Quadrant | Total seconds | Saturated seconds | Saturation percentage |
|---|---|---|---|
| A | 1415 | 1 | 0.070671% |
| B | 1415 | 2 | 0.141343% |
| C | 1415 | 1 | 0.070671% |
| D | 1415 | 13 | 0.918728% |
Noise dominated data is calculated using 1-second bins in cleaned event files. If a bin has >2000 counts, and if more than 50% of those come from <1% of pixels, then it is considered to be noise-dominated and hence unusable.
| Quadrant | # 1 sec bins | Bins with >0 counts | Bins with >2000 counts | High rate bins dominated by noise | Noise dominated (total time) | Noise dominated (detector-on time) | Marked lightcurve |
|---|---|---|---|---|---|---|---|
| A | 1415 | 1415 | 0 | 0 | 0.00% | 0.00% | 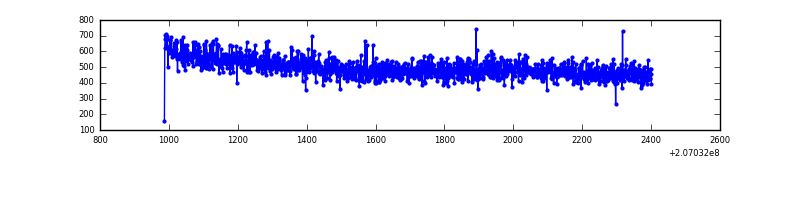 |
| B | 1415 | 1415 | 0 | 0 | 0.00% | 0.00% | 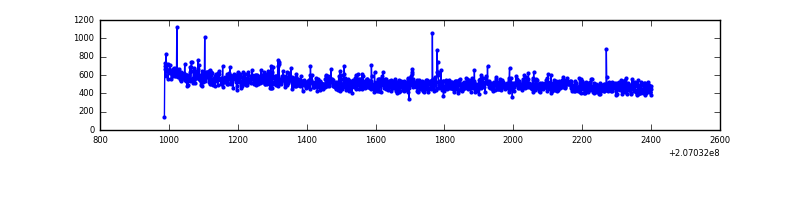 |
| C | 1415 | 1415 | 0 | 0 | 0.00% | 0.00% | 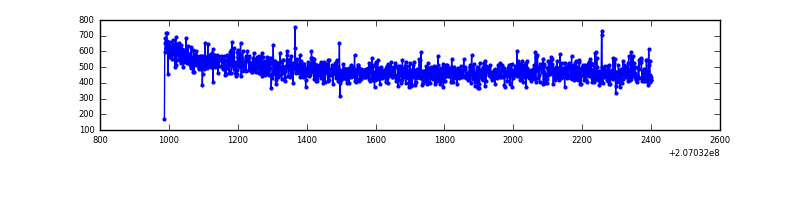 |
| D | 1415 | 1415 | 11 | 11 | 0.78% | 0.78% | 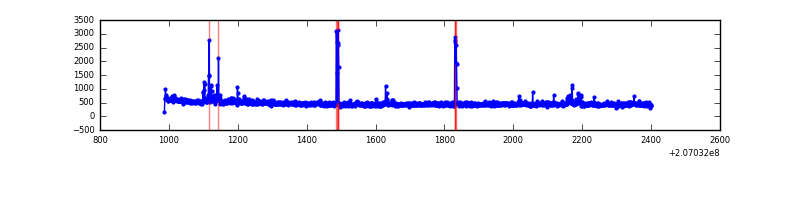 |
Top three noisy pixels from each quadrant. If the there are fewer than three noisy pixels in the level2.evt file, extra rows are filled as -1
| Pixel properties | Quadrant properties | ||||||
|---|---|---|---|---|---|---|---|
| Quadrant | DetID | PixID | Counts | Sigma | Mean | Median | Sigma |
| A | 12 | 194 | 1825 | 42.5 | 183 | 180 | 38.7 |
| A | 0 | 226 | 1787 | 41.52 | 183 | 180 | 38.7 |
| A | 13 | 254 | 538 | 9.25 | 183 | 180 | 38.7 |
| B | 4 | 48 | 12732 | 341.39 | 185 | 181 | 36.8 |
| B | 12 | 111 | 3234 | 83.04 | 185 | 181 | 36.8 |
| B | 4 | 200 | 2656 | 67.32 | 185 | 181 | 36.8 |
| C | 9 | 247 | 2326 | 50.73 | 175 | 176 | 42.4 |
| C | 9 | 16 | 1615 | 33.95 | 175 | 176 | 42.4 |
| C | 13 | 61 | 1397 | 28.81 | 175 | 176 | 42.4 |
| D | 8 | 112 | 30164 | 710.28 | 171 | 166 | 42.2 |
| D | 13 | 239 | 23960 | 563.39 | 171 | 166 | 42.2 |
| D | 4 | 95 | 6174 | 142.26 | 171 | 166 | 42.2 |
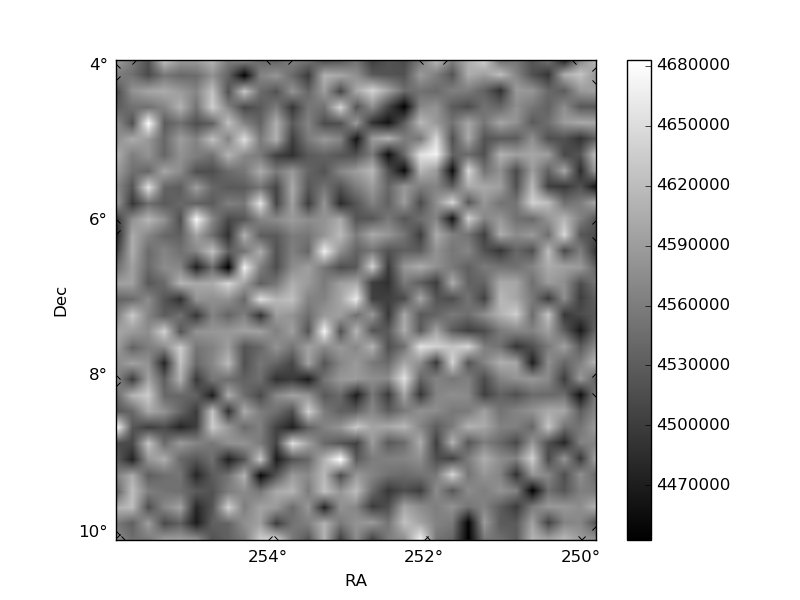
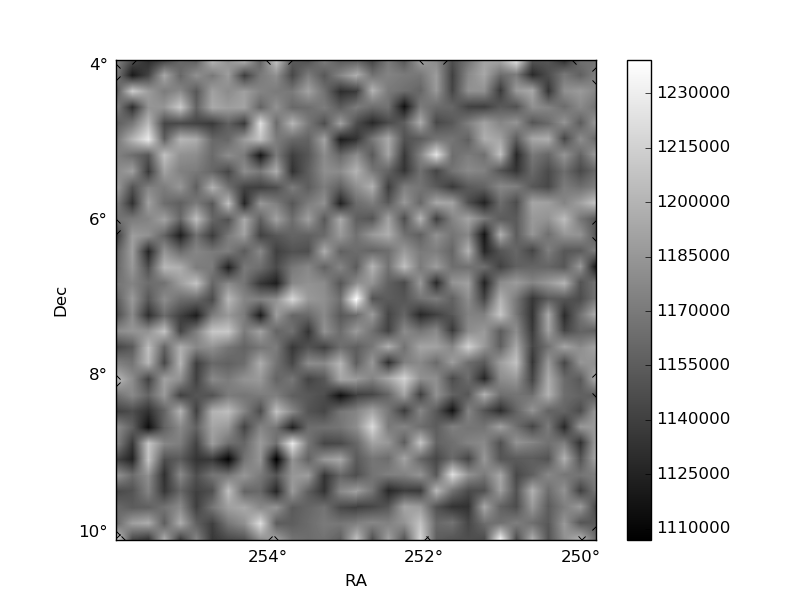
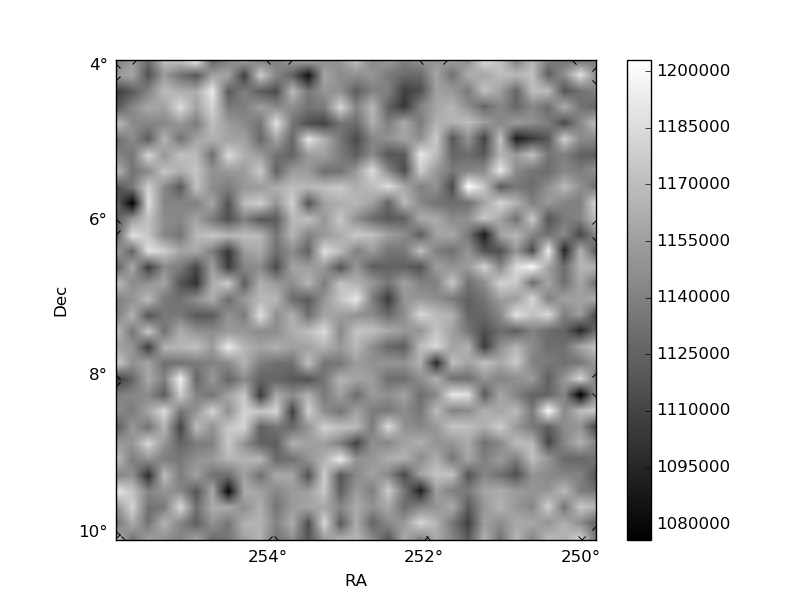
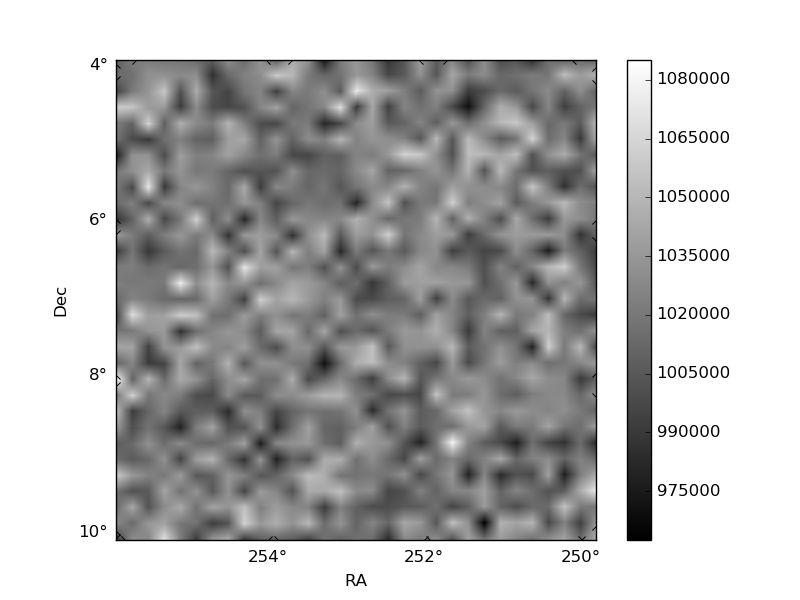
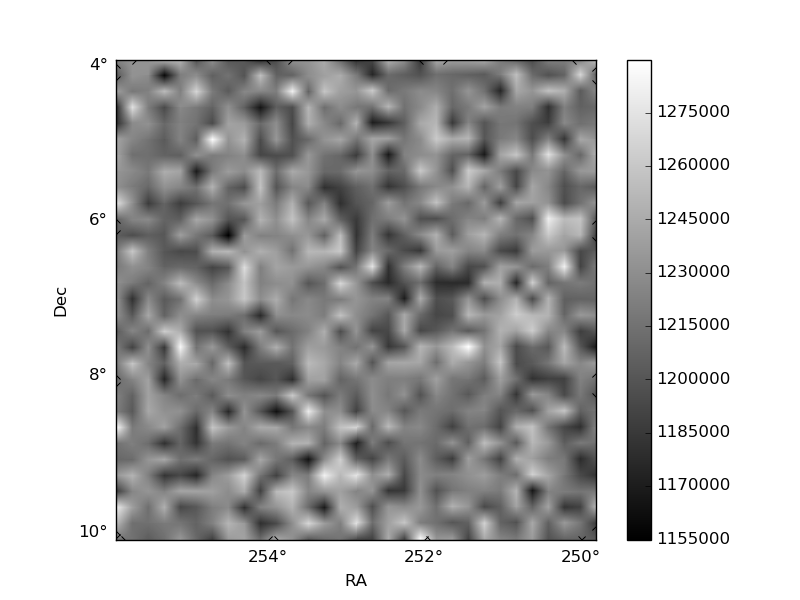
Histogram calculated using DETX and DETY for each event in the final _common_clean file
| Quadrant A | 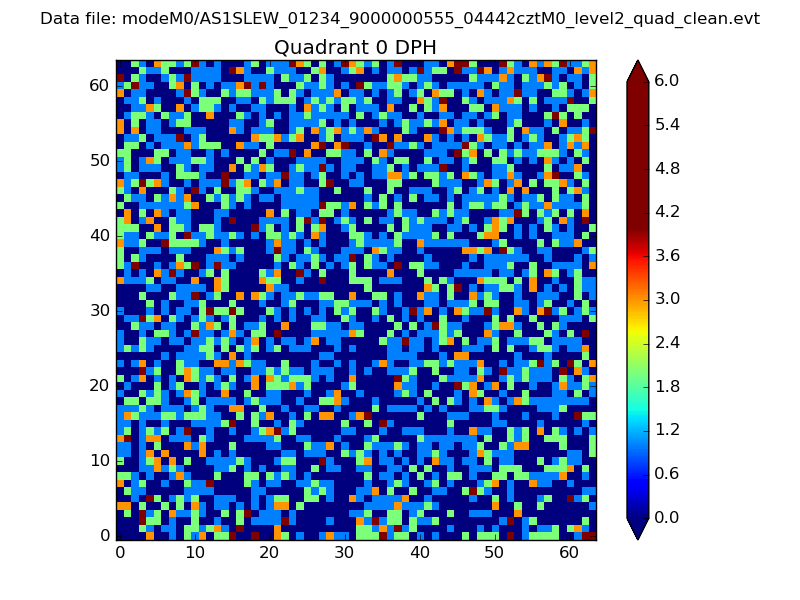 |
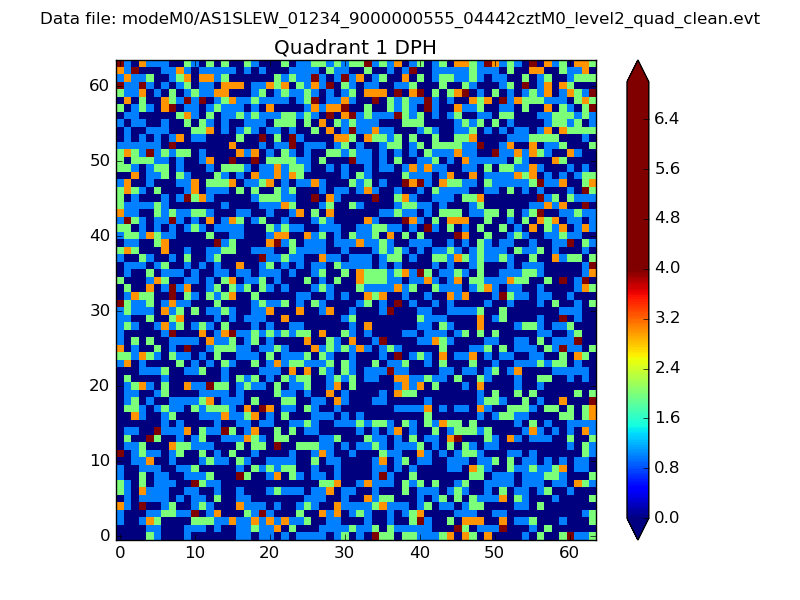 |
Quadrant B |
|---|---|---|---|
| Quadrant D | 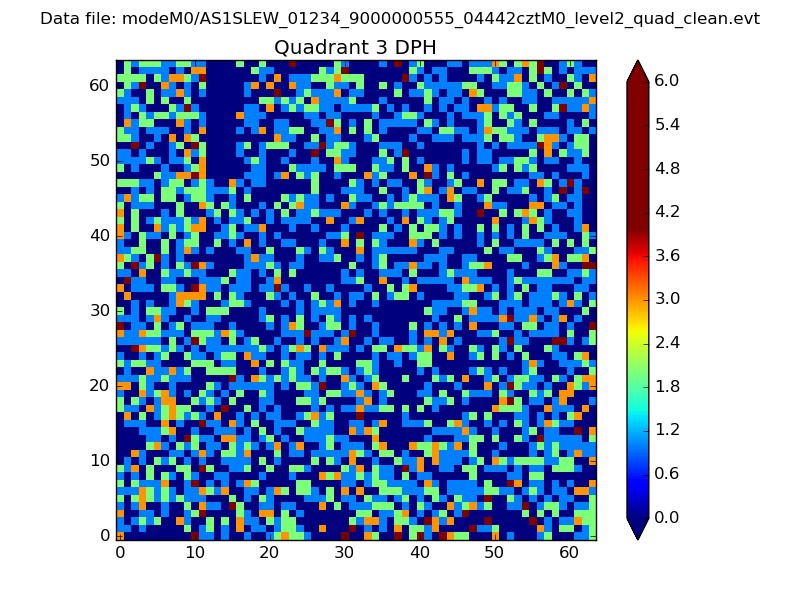 |
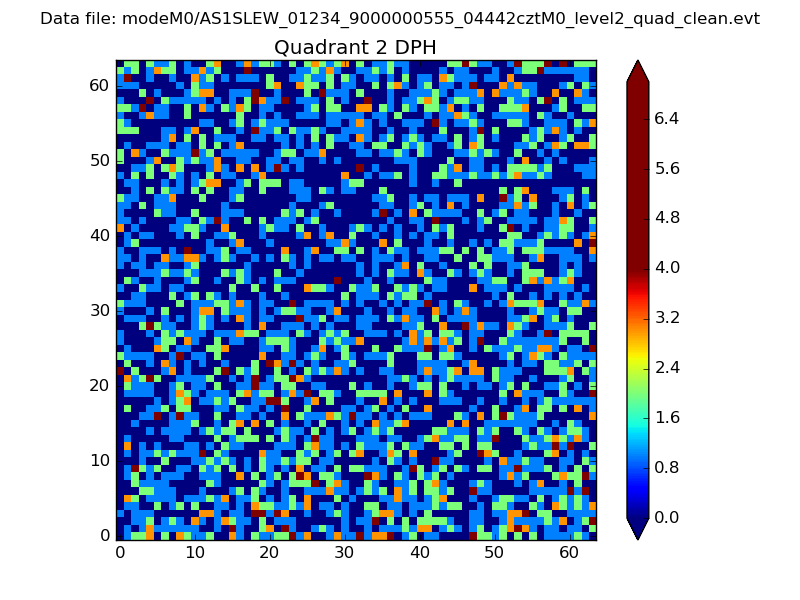 |
Quadrant C |
| Plot type | Count rate plots | Images |
|---|---|---|
| Comparison with Poisson distribution Blue bars denote a histogram of data divided into 1 sec bins. Red curve is a Poisson curve with rate = median count rate of data. |
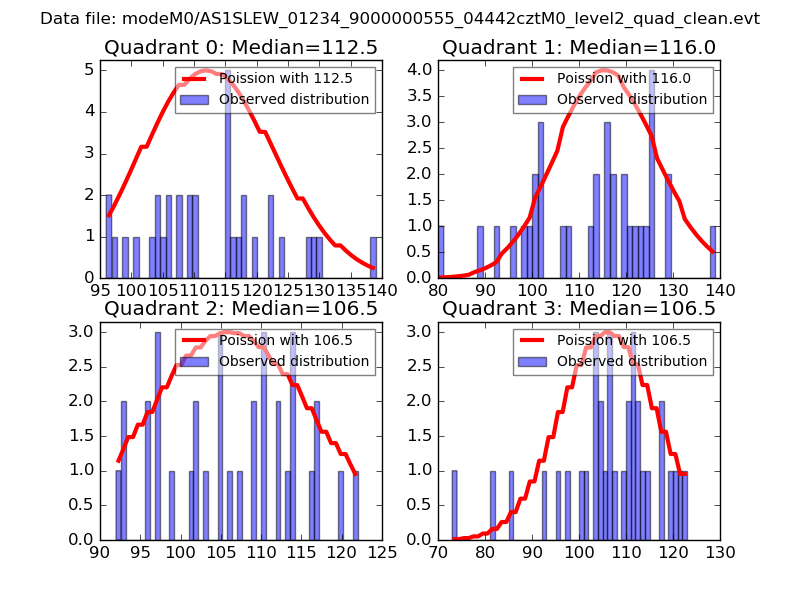 |
 |
| Quadrant-wise count rates Data is divided into 100 sec bins |
 |
|
| Module-wise count rates for Quadrant A Data is divided into 100 sec bins |
 |
 |
| Module-wise count rates for Quadrant B Data is divided into 100 sec bins |
 |
 |
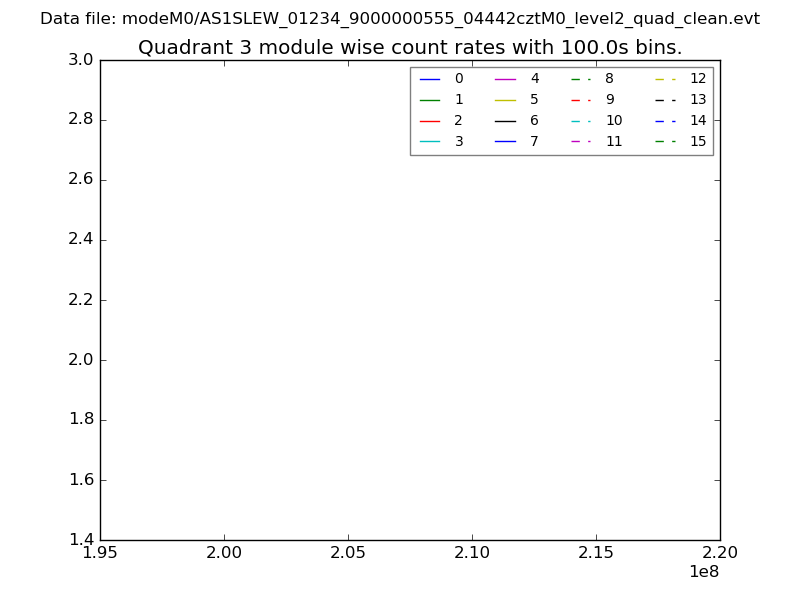
| Module-wise count rates for Quadrant C Data is divided into 100 sec bins |
 |
 |
| Module-wise count rates for Quadrant D Data is divided into 100 sec bins |
 |
 |
| Parameter | Plot |
|---|---|
| CZT HV Monitor |  |
| D_VDD | 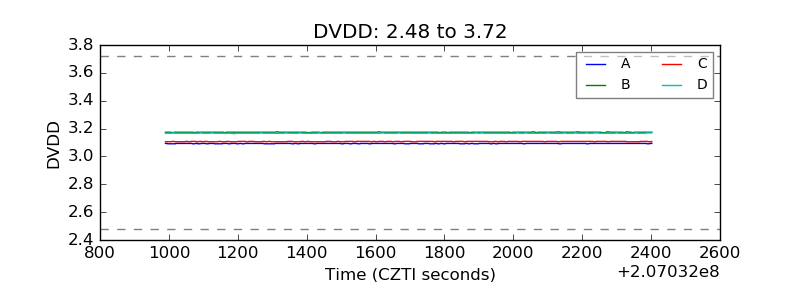 |
| Temperature 1 | 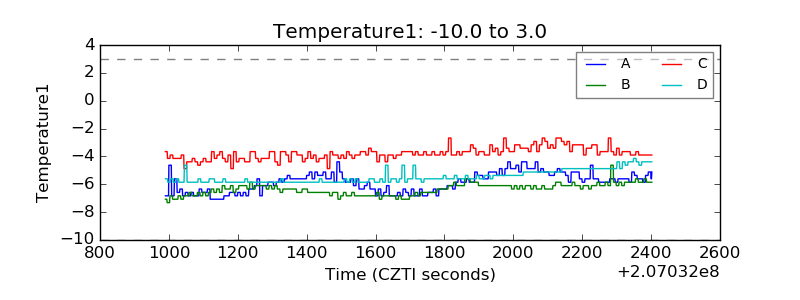 |
| Veto HV Monitor | 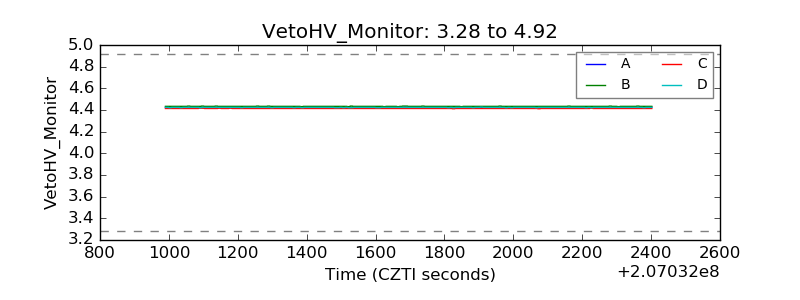 |
| Veto LLD | 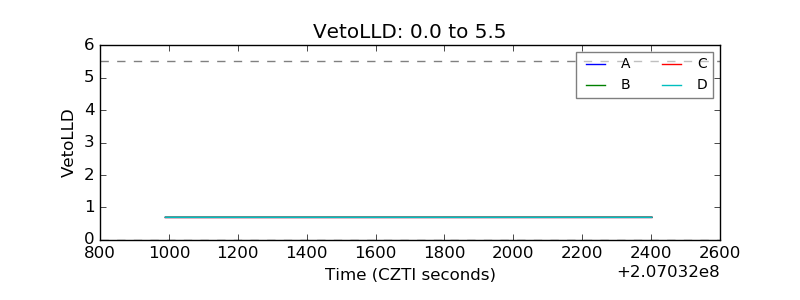 |
| Alpha Counter | 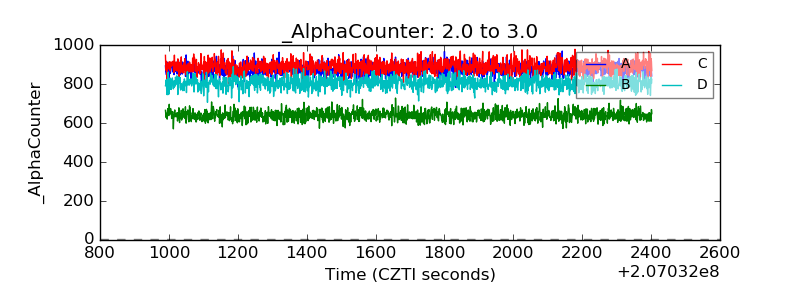 |
| _CPM_Rate | 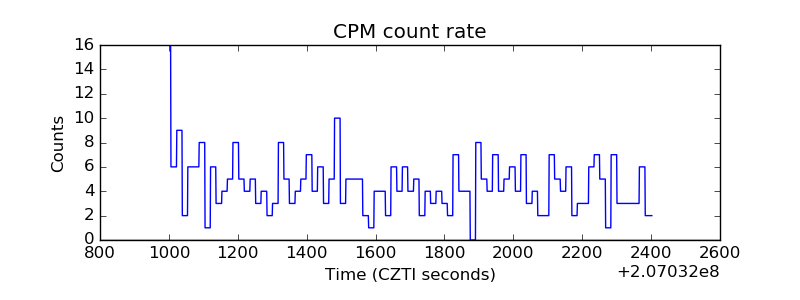 |
| CZT Counter | 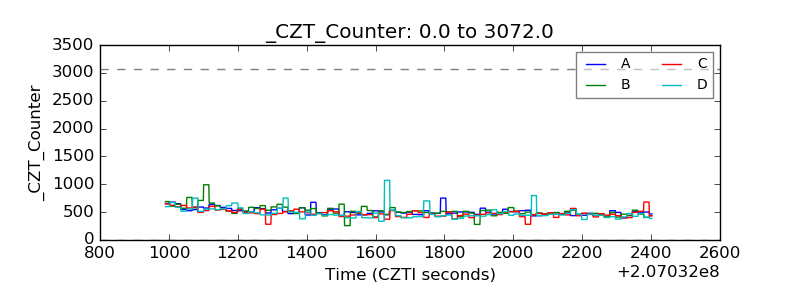 |
| +2.5 Volts monitor |  |
| +5 Volts monitor |  |
| _ROLL_ROT | 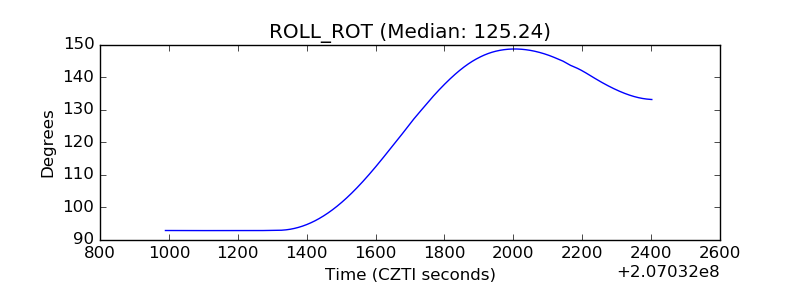 |
| _Roll_DEC | 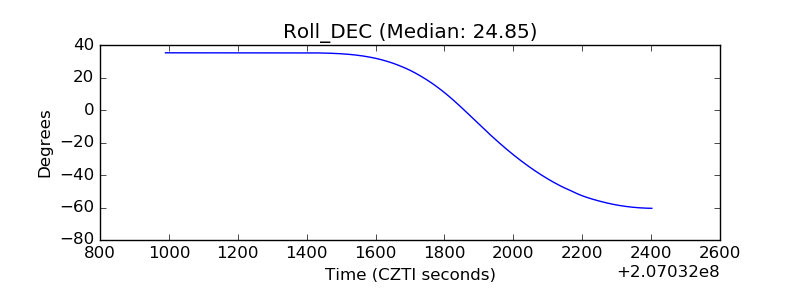 |
| _Roll_RA | 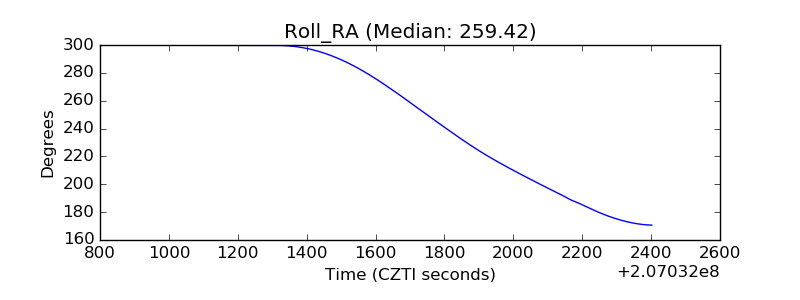 |
| Veto Counter | 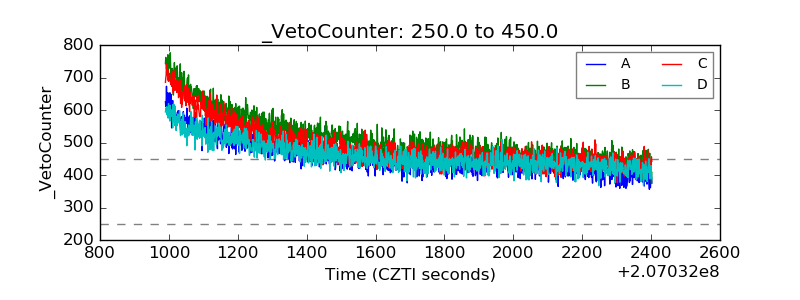 |