| Param | Original file | Final file |
|---|---|---|
| Filename | modeM0/AS1SLEW_01234_9000000555_04443cztM0_level2.evt | modeM0/AS1SLEW_01234_9000000555_04443cztM0_level2_quad_clean.evt |
| Size (bytes) | 99,207,360 | 4,610,880 |
| Size | 94.6 MB | 4.4 MB |
| Events in quadrant A | 721,345 | 7,703 |
| Events in quadrant B | 747,154 | 7,960 |
| Events in quadrant C | 705,006 | 7,522 |
| Events in quadrant D | 729,064 | 7,343 |
| Mode M0 | |||
|---|---|---|---|
| Quadrant | BADHDUFLAG | Total packets | Discarded packets |
| A | 0 | 2987 | 1 |
| B | 0 | 3062 | 1 |
| C | 0 | 2965 | 1 |
| D | 0 | 3119 | 1 |
| Mode SS | |||
|---|---|---|---|
| Quadrant | BADHDUFLAG | Total packets | Discarded packets |
| A | 0 | 30 | 0 |
| B | 0 | 30 | 0 |
| C | 0 | 30 | 0 |
| D | 0 | 30 | 0 |
| Quadrant | Total seconds | Saturated seconds | Saturation percentage |
|---|---|---|---|
| A | 1451 | 1 | 0.068918% |
| B | 1451 | 2 | 0.137836% |
| C | 1451 | 1 | 0.068918% |
| D | 1451 | 13 | 0.895934% |
Noise dominated data is calculated using 1-second bins in cleaned event files. If a bin has >2000 counts, and if more than 50% of those come from <1% of pixels, then it is considered to be noise-dominated and hence unusable.
| Quadrant | # 1 sec bins | Bins with >0 counts | Bins with >2000 counts | High rate bins dominated by noise | Noise dominated (total time) | Noise dominated (detector-on time) | Marked lightcurve |
|---|---|---|---|---|---|---|---|
| A | 1451 | 1451 | 0 | 0 | 0.00% | 0.00% | 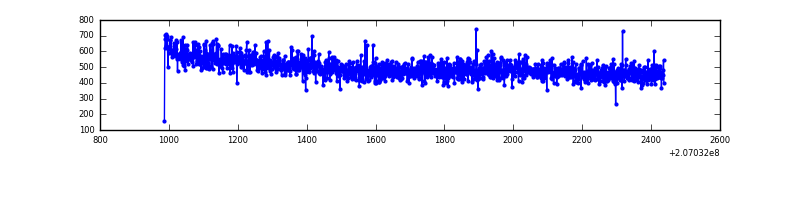 |
| B | 1451 | 1451 | 0 | 0 | 0.00% | 0.00% | 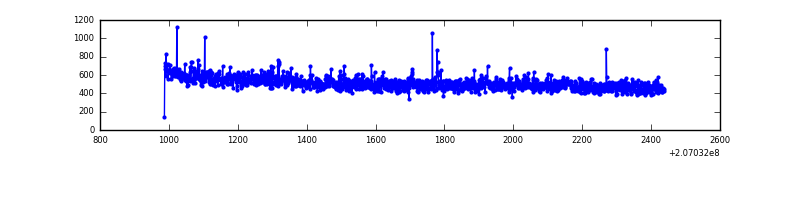 |
| C | 1451 | 1451 | 0 | 0 | 0.00% | 0.00% | 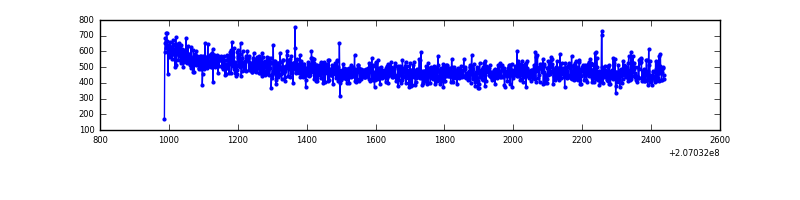 |
| D | 1451 | 1451 | 11 | 11 | 0.76% | 0.76% | 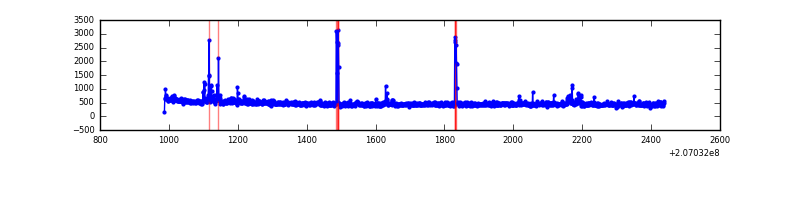 |
Top three noisy pixels from each quadrant. If the there are fewer than three noisy pixels in the level2.evt file, extra rows are filled as -1
| Pixel properties | Quadrant properties | ||||||
|---|---|---|---|---|---|---|---|
| Quadrant | DetID | PixID | Counts | Sigma | Mean | Median | Sigma |
| A | 12 | 194 | 1873 | 42.55 | 187 | 184 | 39.7 |
| A | 0 | 226 | 1820 | 41.21 | 187 | 184 | 39.7 |
| A | 13 | 254 | 543 | 9.04 | 187 | 184 | 39.7 |
| B | 4 | 48 | 12890 | 338.88 | 189 | 185 | 37.5 |
| B | 12 | 111 | 3318 | 83.57 | 189 | 185 | 37.5 |
| B | 4 | 200 | 2659 | 65.99 | 189 | 185 | 37.5 |
| C | 9 | 247 | 2329 | 49.63 | 179 | 181 | 43.3 |
| C | 9 | 16 | 1623 | 33.32 | 179 | 181 | 43.3 |
| C | 13 | 61 | 1433 | 28.93 | 179 | 181 | 43.3 |
| D | 8 | 112 | 30169 | 692.4 | 175 | 170 | 43.3 |
| D | 13 | 239 | 24370 | 558.55 | 175 | 170 | 43.3 |
| D | 4 | 95 | 6179 | 138.69 | 175 | 170 | 43.3 |
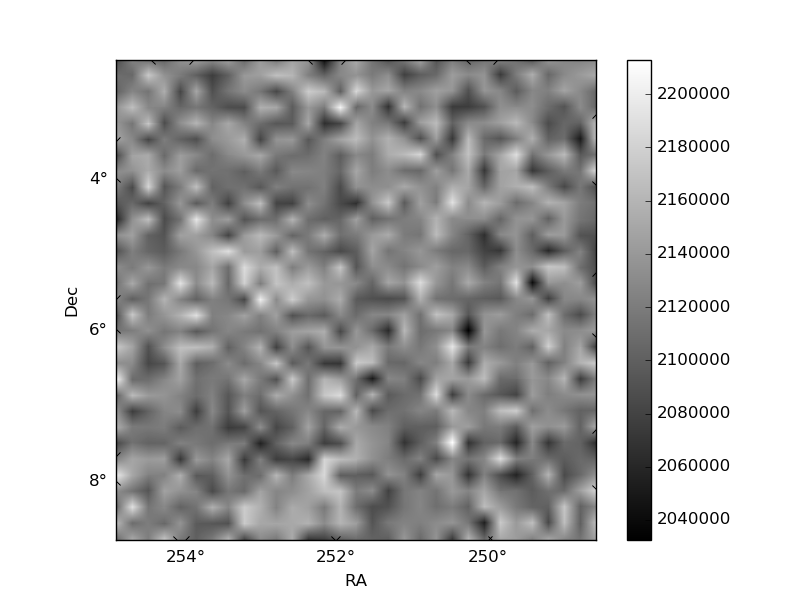
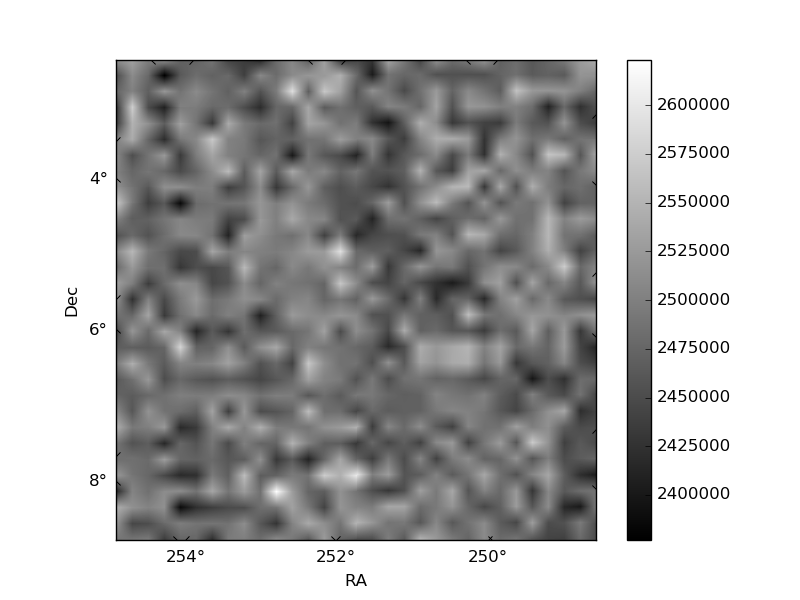
Histogram calculated using DETX and DETY for each event in the final _common_clean file
| Quadrant A | 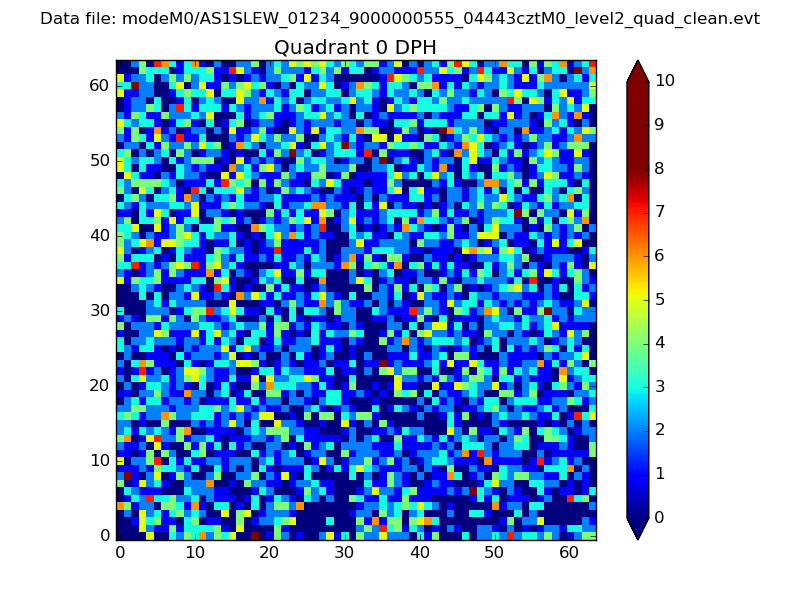 |
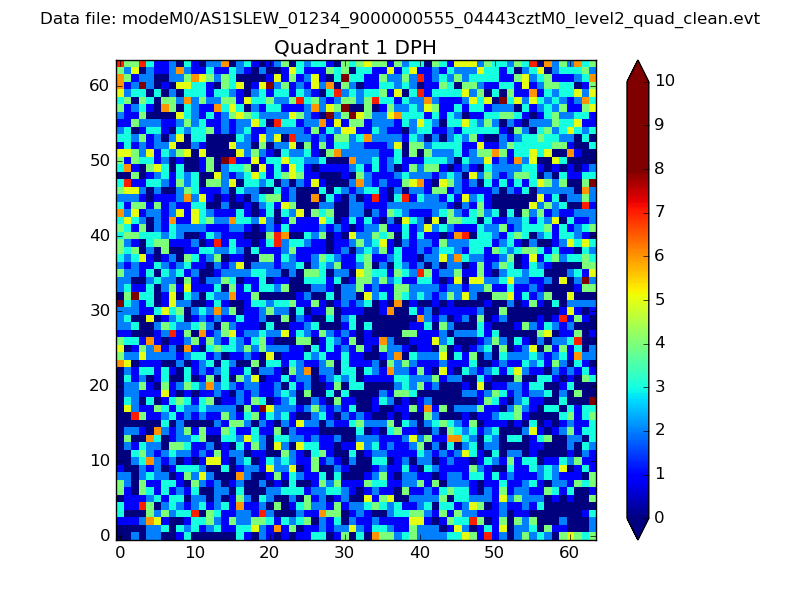 |
Quadrant B |
|---|---|---|---|
| Quadrant D | 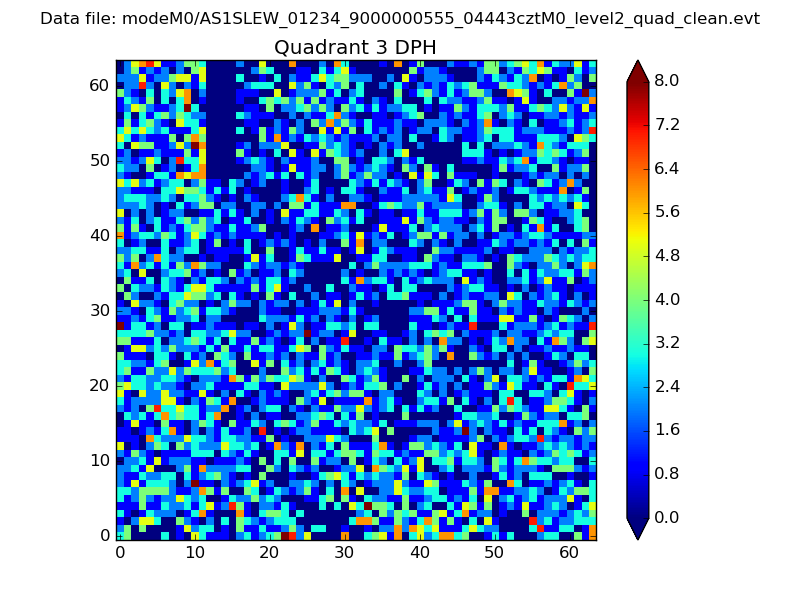 |
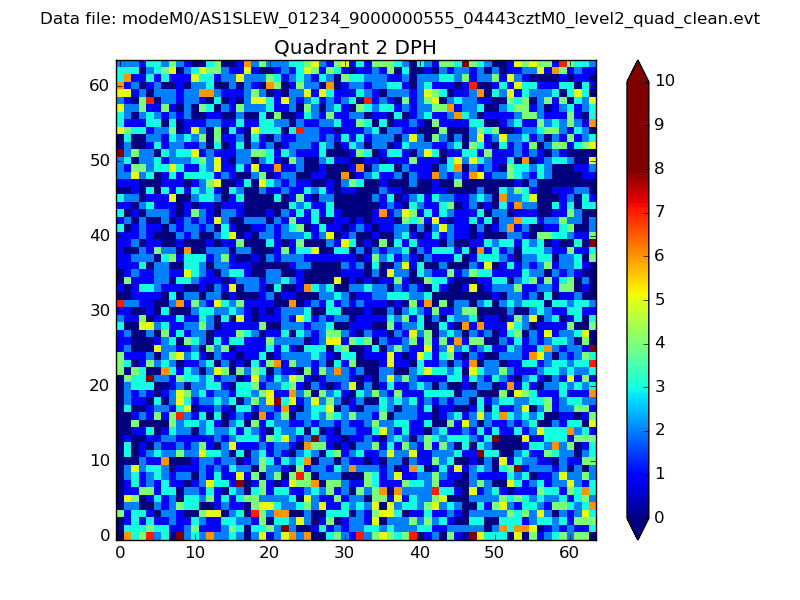 |
Quadrant C |
| Plot type | Count rate plots | Images |
|---|---|---|
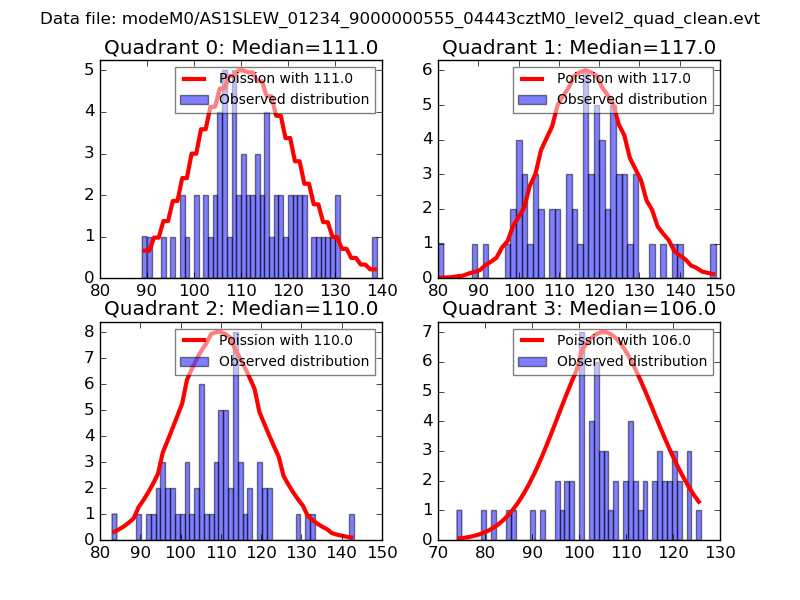
| Comparison with Poisson distribution Blue bars denote a histogram of data divided into 1 sec bins. Red curve is a Poisson curve with rate = median count rate of data. |
 |
 |
| Quadrant-wise count rates Data is divided into 100 sec bins |
 |
|
| Module-wise count rates for Quadrant A Data is divided into 100 sec bins |
 |
 |
| Module-wise count rates for Quadrant B Data is divided into 100 sec bins |
 |
 |
| Module-wise count rates for Quadrant C Data is divided into 100 sec bins |
 |
 |
| Module-wise count rates for Quadrant D Data is divided into 100 sec bins |
 |
 |
| Parameter | Plot |
|---|---|
| CZT HV Monitor | 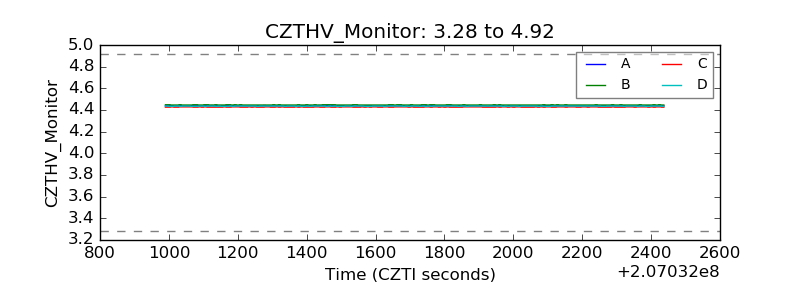 |
| D_VDD | 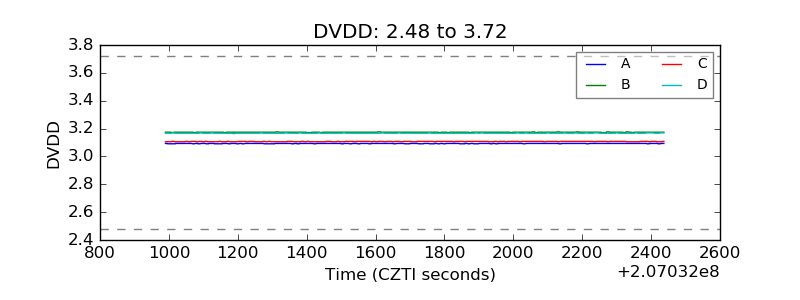 |
| Temperature 1 |  |
| Veto HV Monitor | 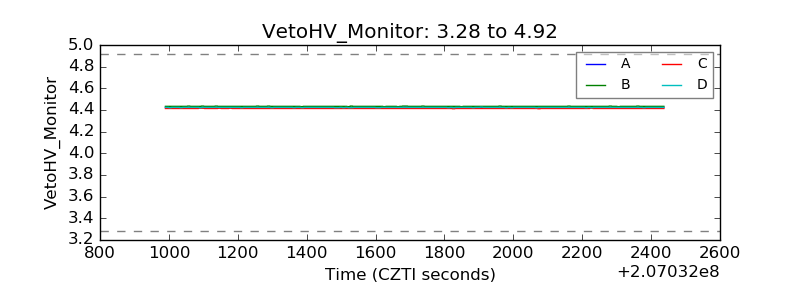 |
| Veto LLD | 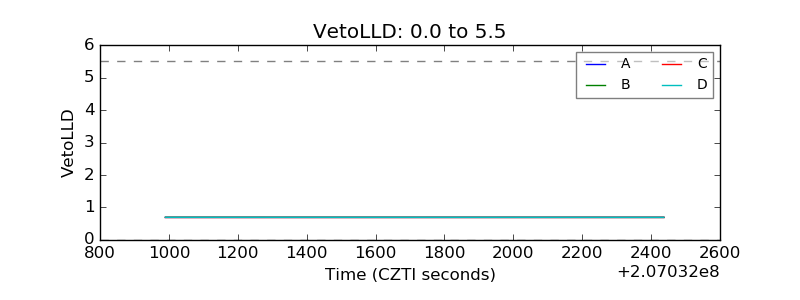 |
| Alpha Counter | 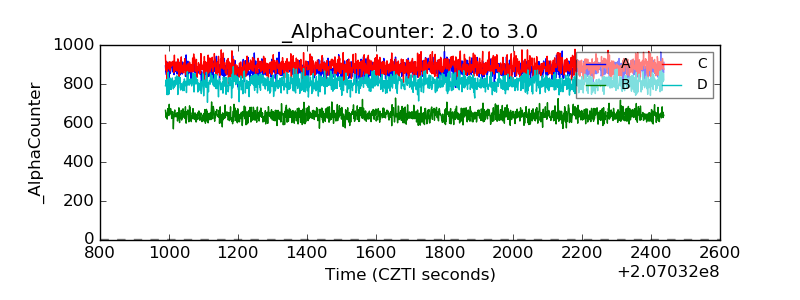 |
| _CPM_Rate | 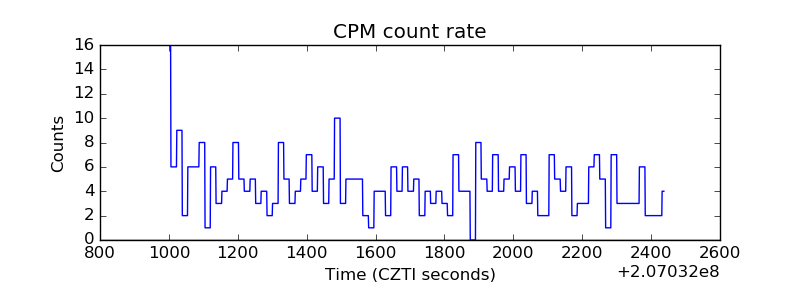 |
| CZT Counter | 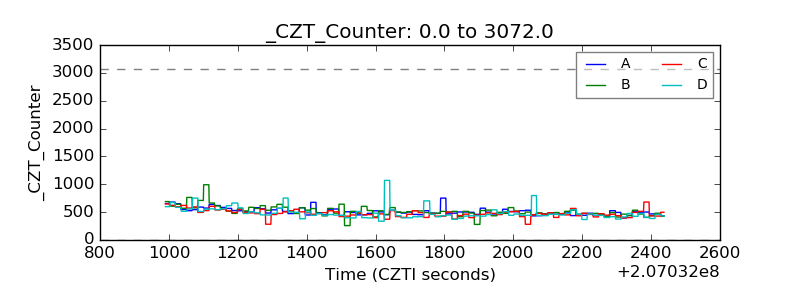 |
| +2.5 Volts monitor |  |
| +5 Volts monitor | 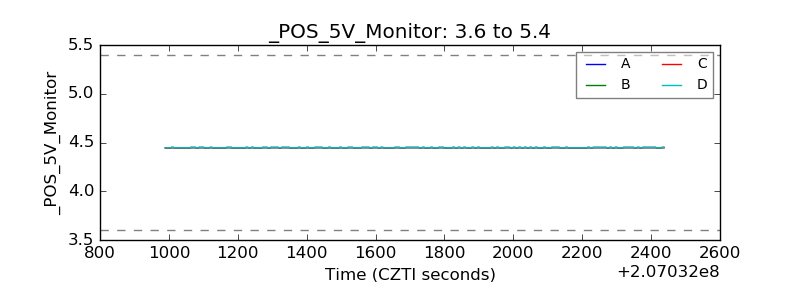 |
| _ROLL_ROT | 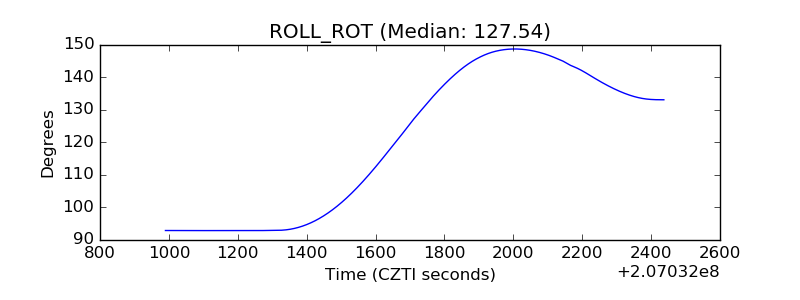 |
| _Roll_DEC | 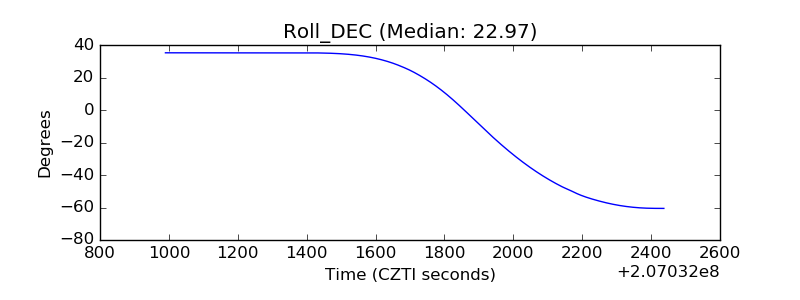 |
| _Roll_RA | 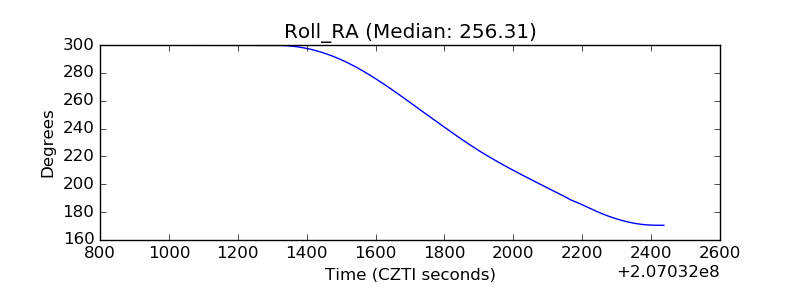 |
| Veto Counter | 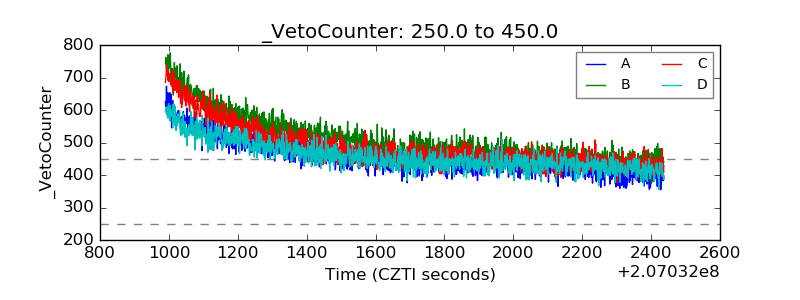 |