| Param | Original file | Final file |
|---|---|---|
| Filename | modeM0/AS1G05_253T03_9000000562_04470cztM0_level2.evt | modeM0/AS1G05_253T03_9000000562_04470cztM0_level2_quad_clean.evt |
| Size (bytes) | 68,607,360 | 6,264,000 |
| Size | 65.4 MB | 6.0 MB |
| Events in quadrant A | 439,085 | 28,060 |
| Events in quadrant B | 456,641 | 28,497 |
| Events in quadrant C | 448,365 | 28,098 |
| Events in quadrant D | 661,741 | 26,622 |
| Mode SS | |||
|---|---|---|---|
| Quadrant | BADHDUFLAG | Total packets | Discarded packets |
| A | 0 | 20 | 0 |
| B | 0 | 20 | 0 |
| C | 0 | 20 | 0 |
| D | 0 | 20 | 0 |
| Mode M0 | |||
|---|---|---|---|
| Quadrant | BADHDUFLAG | Total packets | Discarded packets |
| A | 0 | 2024 | 1 |
| B | 0 | 2022 | 0 |
| C | 0 | 2031 | 0 |
| D | 0 | 2607 | 0 |
| Quadrant | Total seconds | Saturated seconds | Saturation percentage |
|---|---|---|---|
| A | 1009 | 0 | 0.000000% |
| B | 1009 | 0 | 0.000000% |
| C | 1009 | 0 | 0.000000% |
| D | 1009 | 46 | 4.558969% |
Noise dominated data is calculated using 1-second bins in cleaned event files. If a bin has >2000 counts, and if more than 50% of those come from <1% of pixels, then it is considered to be noise-dominated and hence unusable.
| Quadrant | # 1 sec bins | Bins with >0 counts | Bins with >2000 counts | High rate bins dominated by noise | Noise dominated (total time) | Noise dominated (detector-on time) | Marked lightcurve |
|---|---|---|---|---|---|---|---|
| A | 1009 | 1009 | 0 | 0 | 0.00% | 0.00% |  |
| B | 1009 | 1009 | 0 | 0 | 0.00% | 0.00% |  |
| C | 1009 | 1009 | 0 | 0 | 0.00% | 0.00% | 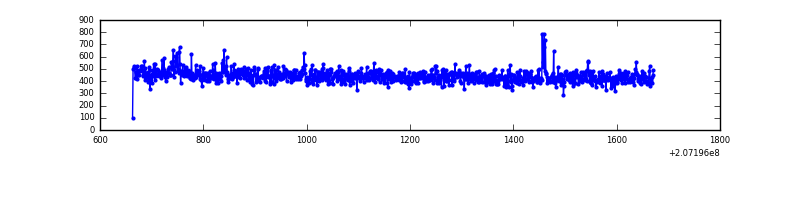 |
| D | 1009 | 1009 | 44 | 44 | 4.36% | 4.36% | 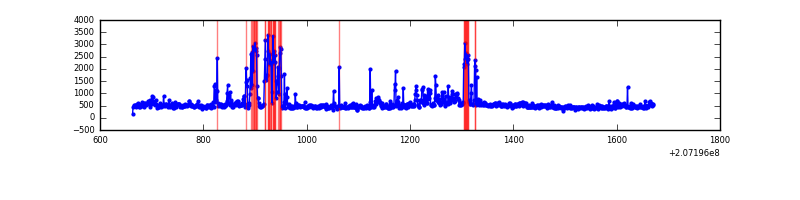 |
Top three noisy pixels from each quadrant. If the there are fewer than three noisy pixels in the level2.evt file, extra rows are filled as -1
| Pixel properties | Quadrant properties | ||||||
|---|---|---|---|---|---|---|---|
| Quadrant | DetID | PixID | Counts | Sigma | Mean | Median | Sigma |
| A | 0 | 118 | 2247 | 85.66 | 113 | 111 | 24.9 |
| A | 0 | 13 | 1346 | 49.53 | 113 | 111 | 24.9 |
| A | 0 | 226 | 1257 | 45.96 | 113 | 111 | 24.9 |
| B | 15 | 204 | 2553 | 101.13 | 117 | 115 | 24.1 |
| B | 12 | 111 | 1949 | 76.08 | 117 | 115 | 24.1 |
| B | 4 | 48 | 1568 | 60.27 | 117 | 115 | 24.1 |
| C | 14 | 225 | 2280 | 77.84 | 113 | 113 | 27.8 |
| C | 14 | 48 | 1677 | 56.18 | 113 | 113 | 27.8 |
| C | 9 | 247 | 1017 | 32.47 | 113 | 113 | 27.8 |
| D | 8 | 112 | 139226 | 5000.04 | 107 | 104 | 27.8 |
| D | 13 | 235 | 51312 | 1840.41 | 107 | 104 | 27.8 |
| D | 12 | 79 | 35366 | 1267.31 | 107 | 104 | 27.8 |
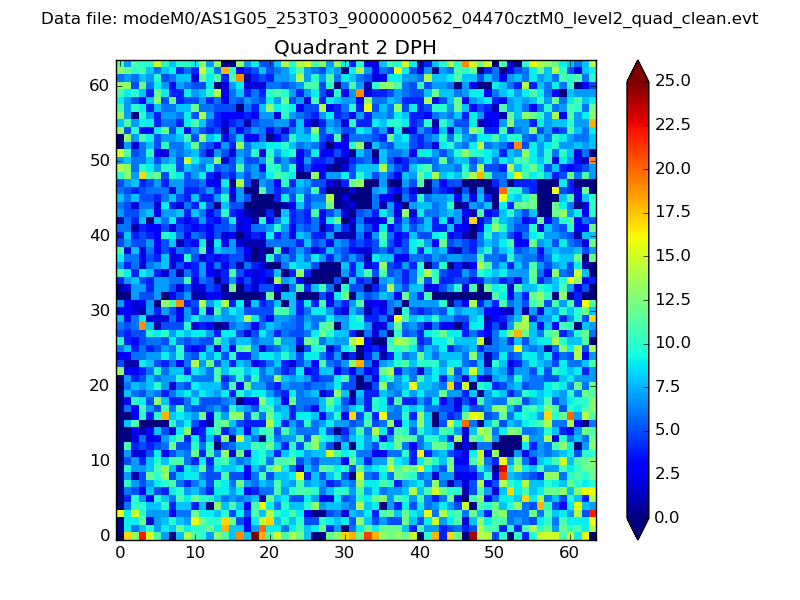
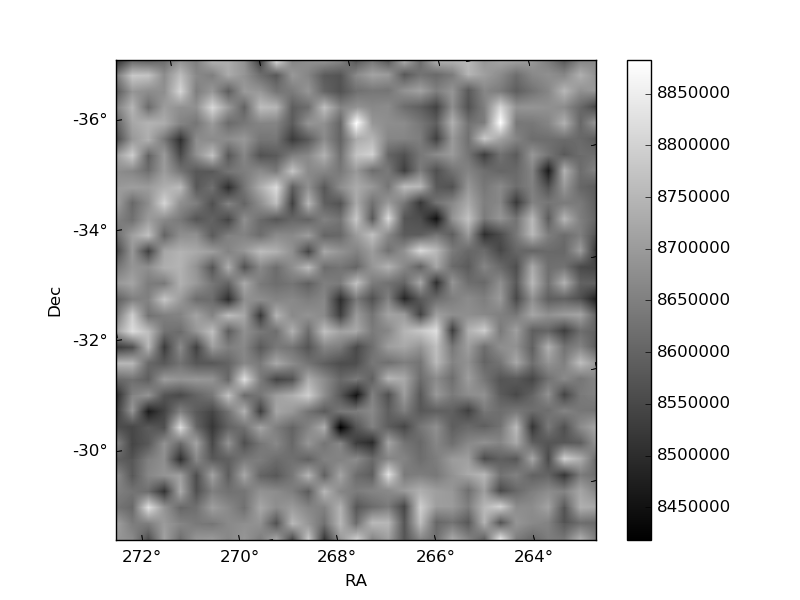
Histogram calculated using DETX and DETY for each event in the final _common_clean file
| Quadrant A | 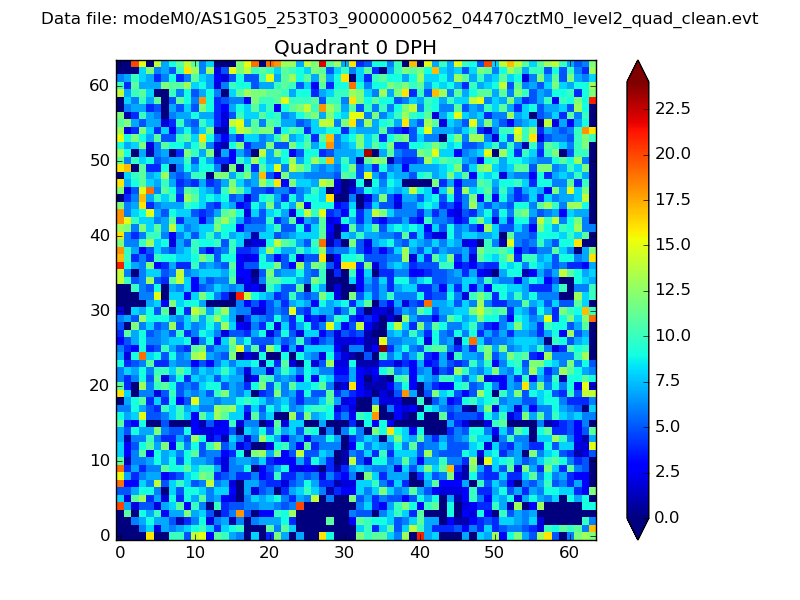 |
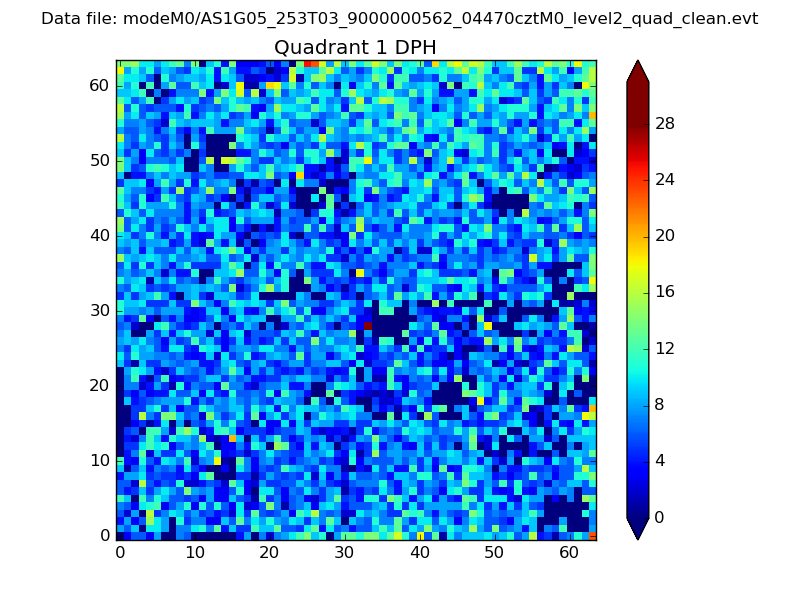 |
Quadrant B |
|---|---|---|---|
| Quadrant D | 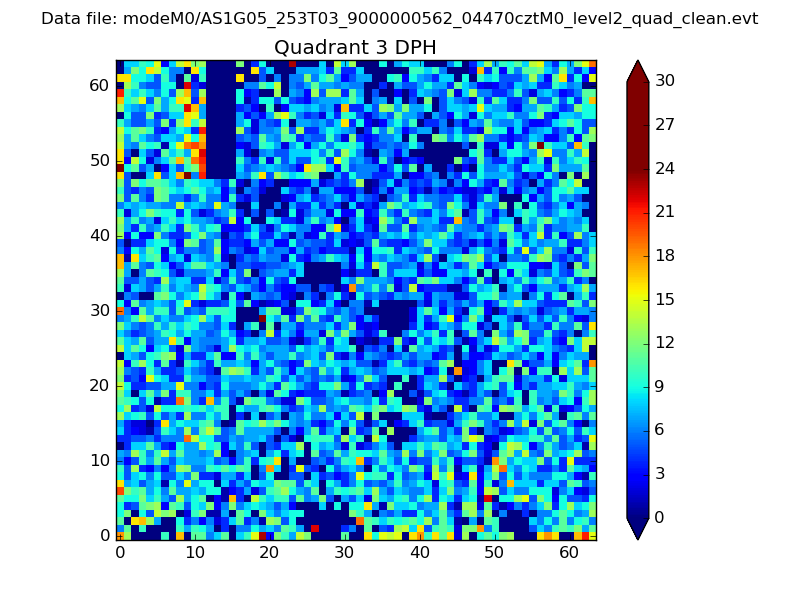 |
 |
Quadrant C |
| Plot type | Count rate plots | Images |
|---|---|---|
| Comparison with Poisson distribution Blue bars denote a histogram of data divided into 1 sec bins. Red curve is a Poisson curve with rate = median count rate of data. |
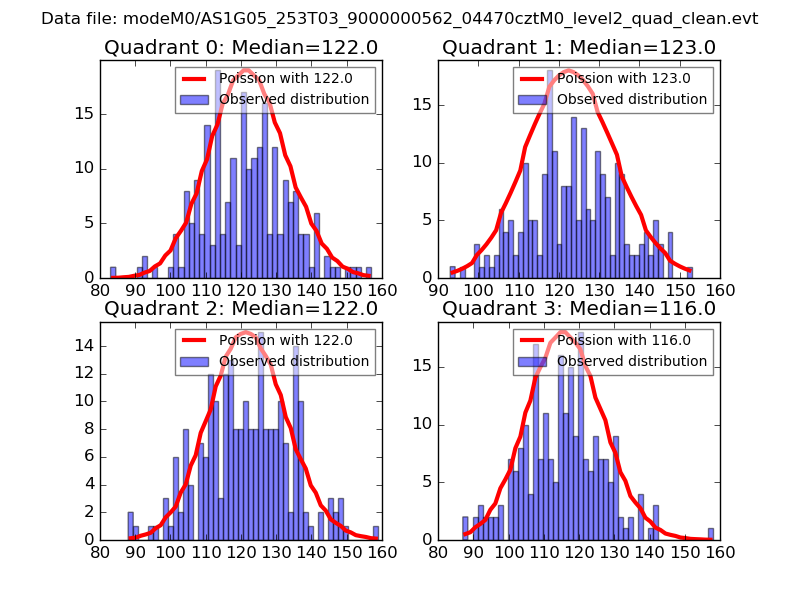 |
 |
| Quadrant-wise count rates Data is divided into 100 sec bins |
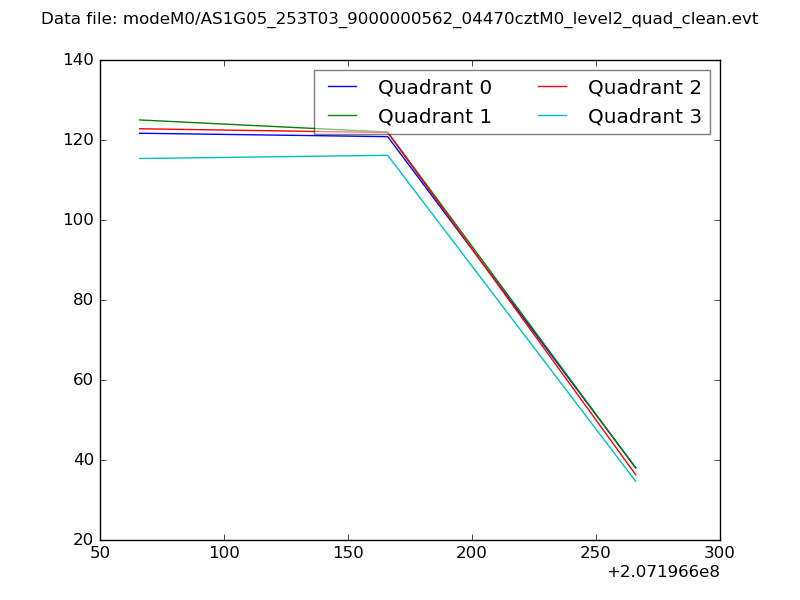 |
|
| Module-wise count rates for Quadrant A Data is divided into 100 sec bins |
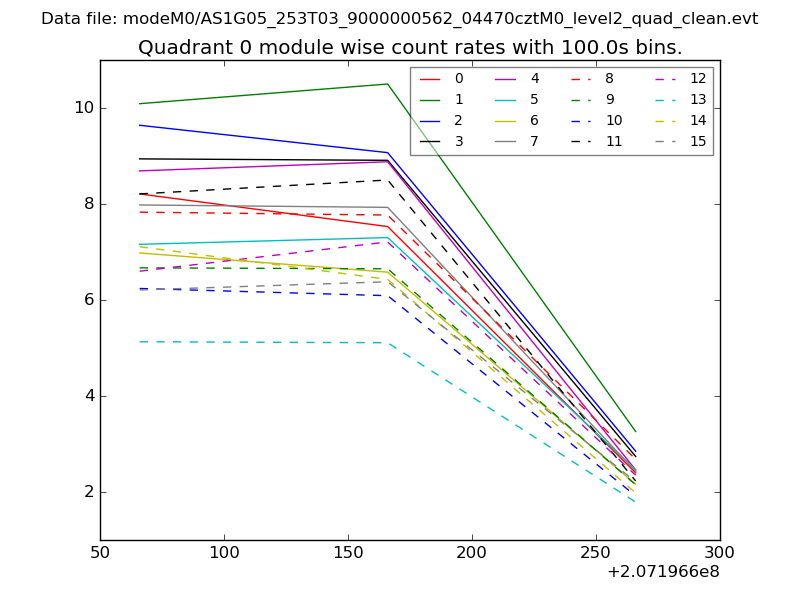 |
 |
| Module-wise count rates for Quadrant B Data is divided into 100 sec bins |
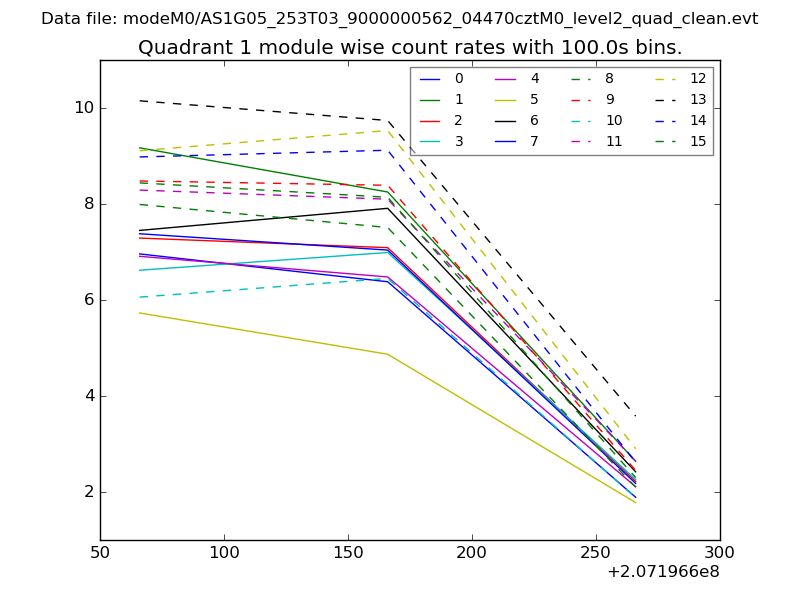 |
 |
| Module-wise count rates for Quadrant C Data is divided into 100 sec bins |
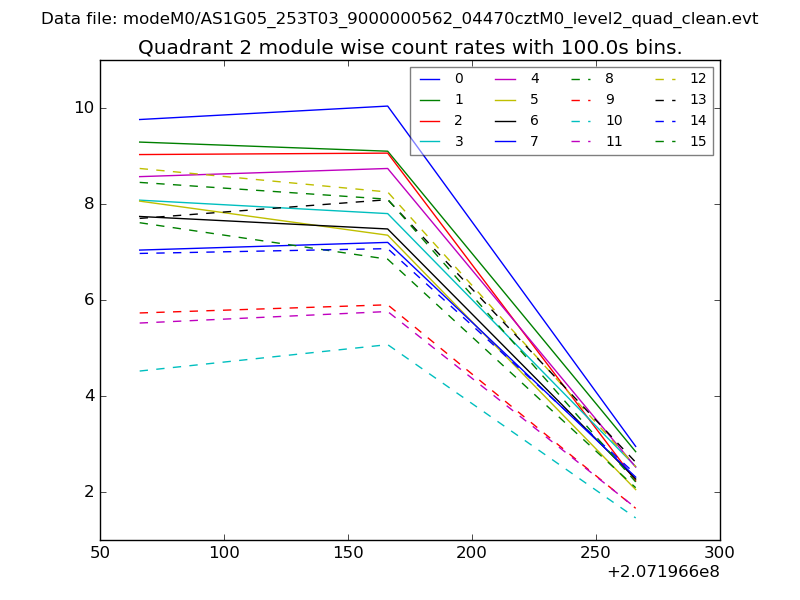 |
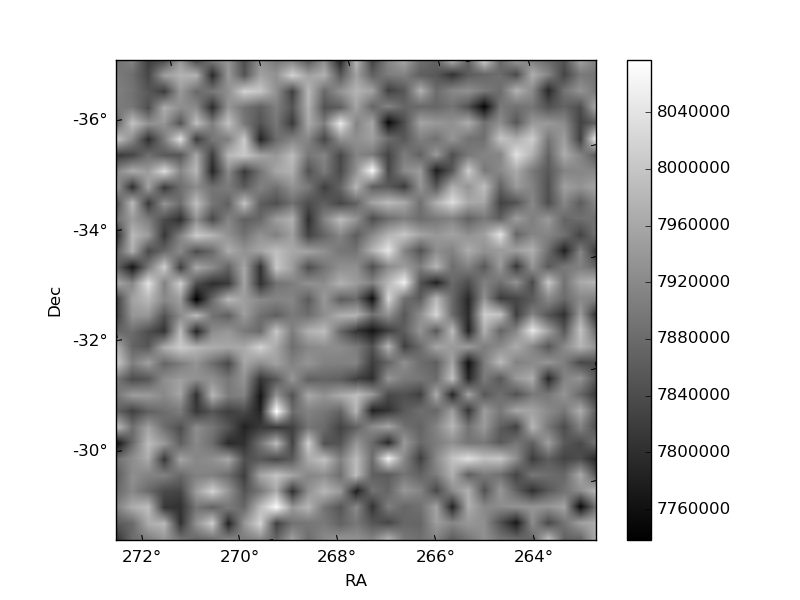 |
| Module-wise count rates for Quadrant D Data is divided into 100 sec bins |
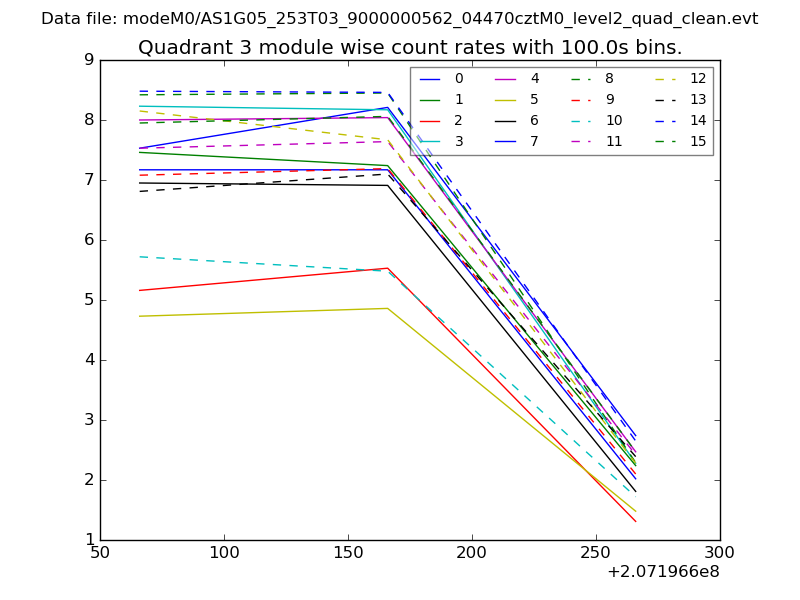 |
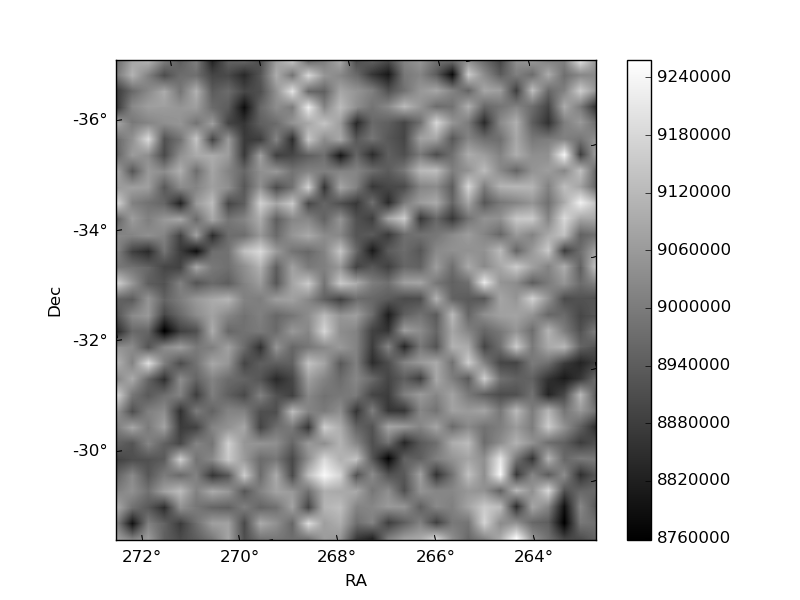 |
| Parameter | Plot |
|---|---|
| CZT HV Monitor | 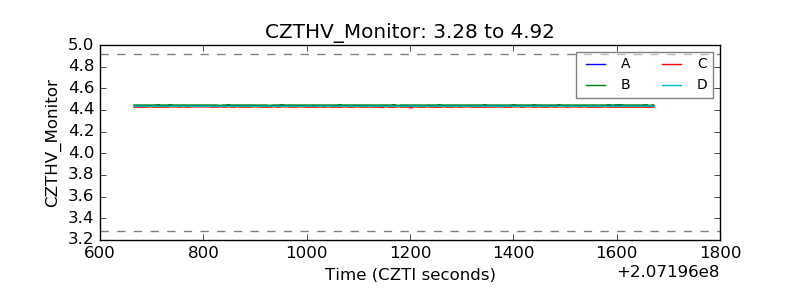 |
| D_VDD | 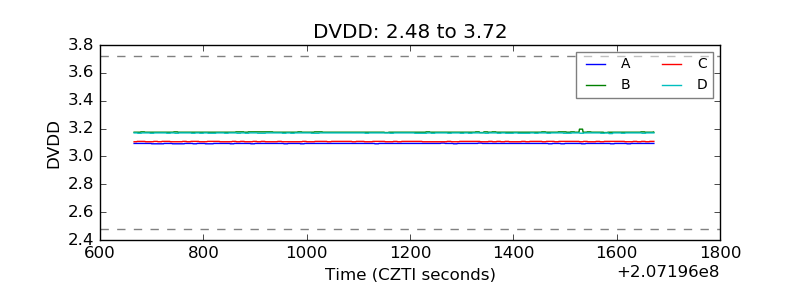 |
| Temperature 1 | 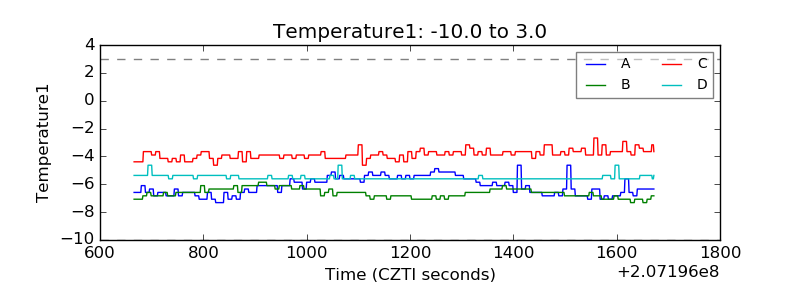 |
| Veto HV Monitor | 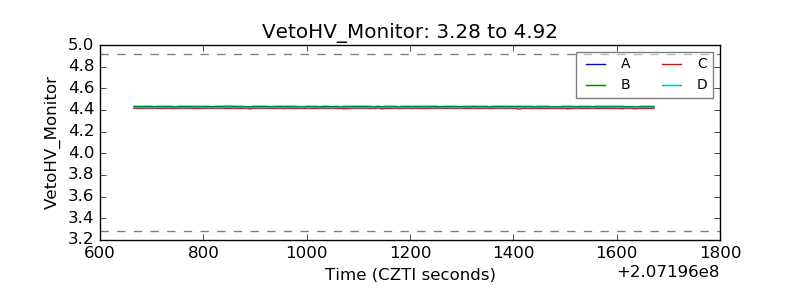 |
| Veto LLD | 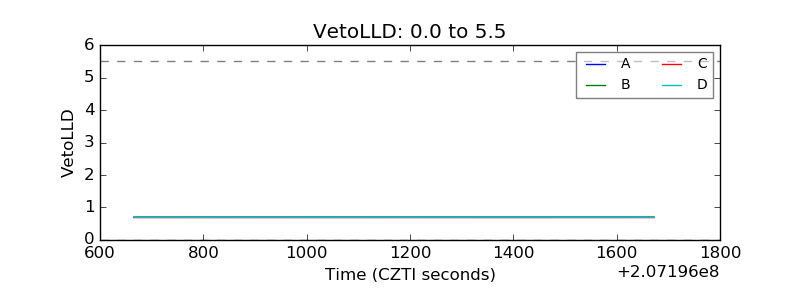 |
| Alpha Counter | 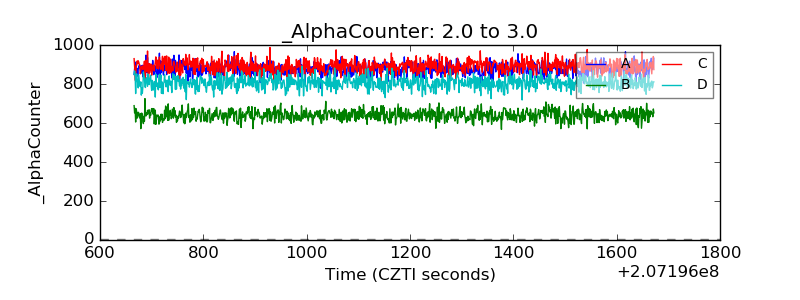 |
| _CPM_Rate | 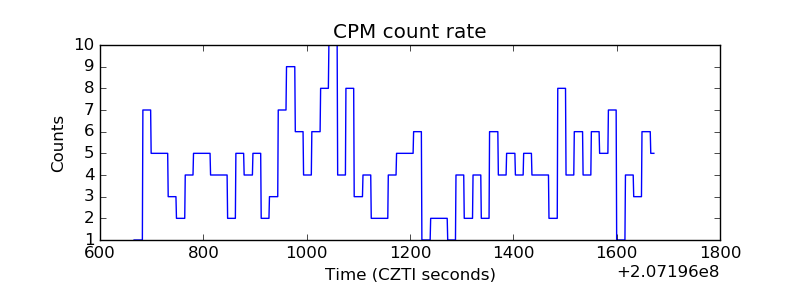 |
| CZT Counter | 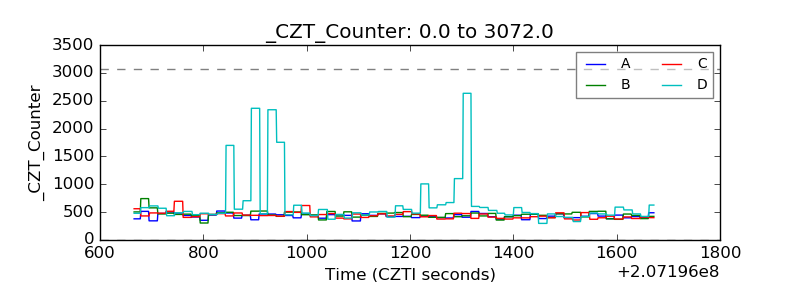 |
| +2.5 Volts monitor |  |
| +5 Volts monitor |  |
| _ROLL_ROT | 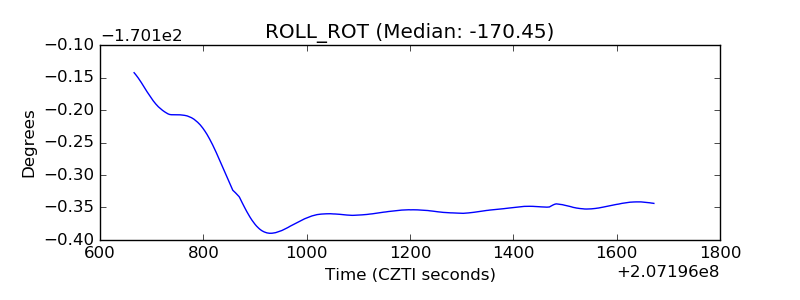 |
| _Roll_DEC | 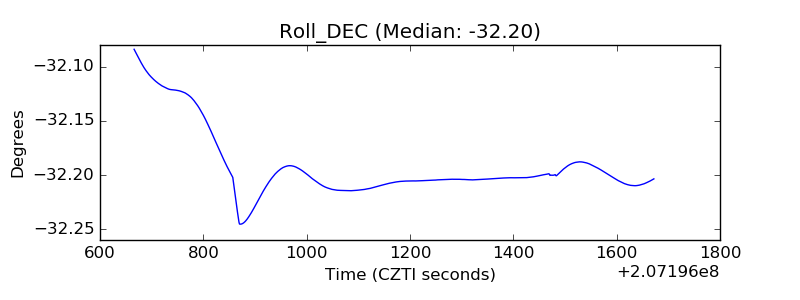 |
| _Roll_RA | 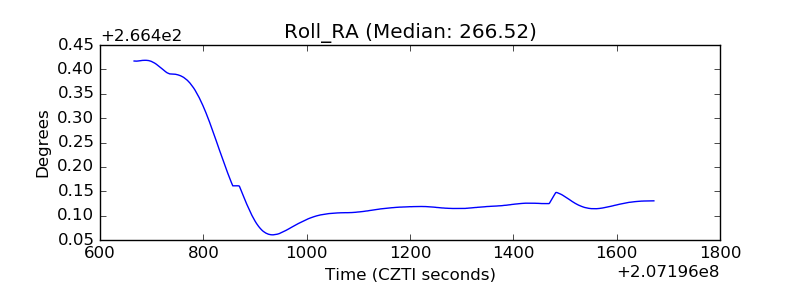 |
| Veto Counter | 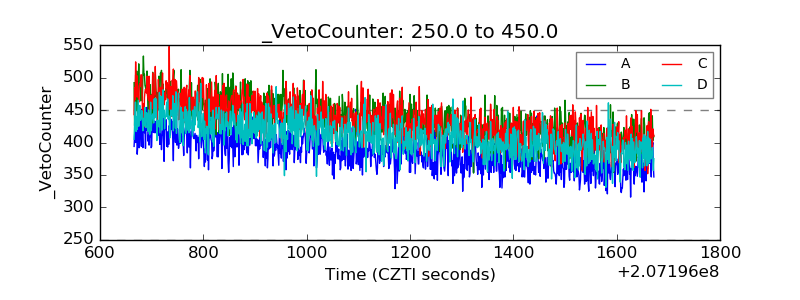 |