| Param | Original file | Final file |
|---|---|---|
| Filename | modeM0/AS1G05_253T03_9000000562_04472cztM0_level2.evt | modeM0/AS1G05_253T03_9000000562_04472cztM0_level2_quad_clean.evt |
| Size (bytes) | 456,791,040 | 48,758,400 |
| Size | 435.6 MB | 46.5 MB |
| Events in quadrant A | 3,585,323 | 260,896 |
| Events in quadrant B | 2,927,522 | 273,114 |
| Events in quadrant C | 2,887,915 | 275,566 |
| Events in quadrant D | 4,032,420 | 253,798 |
| Mode SS | |||
|---|---|---|---|
| Quadrant | BADHDUFLAG | Total packets | Discarded packets |
| A | 0 | 120 | 0 |
| B | 0 | 120 | 0 |
| C | 0 | 120 | 0 |
| D | 0 | 120 | 0 |
| Mode M9 | |||
|---|---|---|---|
| Quadrant | BADHDUFLAG | Total packets | Discarded packets |
| A | 0 | 13 | 0 |
| B | 0 | 13 | 0 |
| C | 0 | 13 | 0 |
| D | 0 | 13 | 0 |
| Mode M0 | |||
|---|---|---|---|
| Quadrant | BADHDUFLAG | Total packets | Discarded packets |
| A | 0 | 14440 | 2 |
| B | 0 | 12262 | 1 |
| C | 0 | 12336 | 1 |
| D | 0 | 15848 | 1 |
| Quadrant | Total seconds | Saturated seconds | Saturation percentage |
|---|---|---|---|
| A | 5901 | 311 | 5.270293% |
| B | 5901 | 57 | 0.965938% |
| C | 5901 | 56 | 0.948992% |
| D | 5901 | 181 | 3.067277% |
Noise dominated data is calculated using 1-second bins in cleaned event files. If a bin has >2000 counts, and if more than 50% of those come from <1% of pixels, then it is considered to be noise-dominated and hence unusable.
| Quadrant | # 1 sec bins | Bins with >0 counts | Bins with >2000 counts | High rate bins dominated by noise | Noise dominated (total time) | Noise dominated (detector-on time) | Marked lightcurve |
|---|---|---|---|---|---|---|---|
| A | 7176 | 5902 | 144 | 144 | 2.01% | 2.44% | 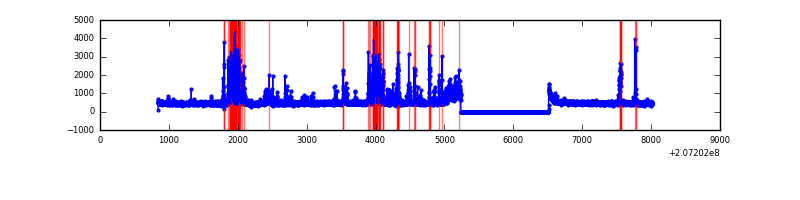 |
| B | 7176 | 5902 | 0 | 0 | 0.00% | 0.00% | 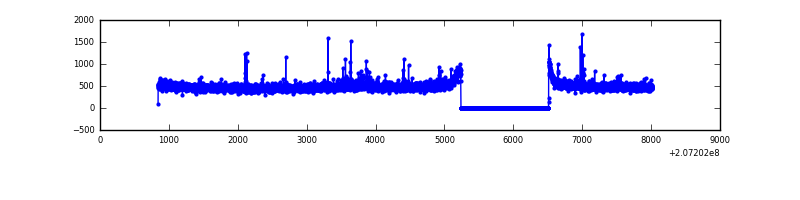 |
| C | 7176 | 5902 | 6 | 6 | 0.08% | 0.10% | 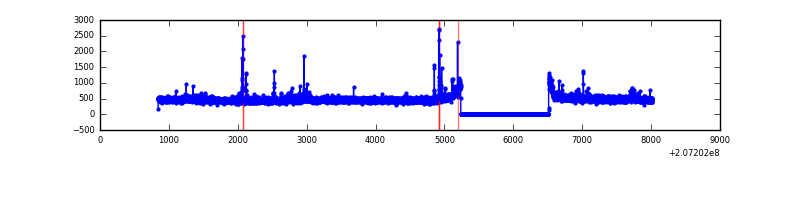 |
| D | 7176 | 5902 | 101 | 101 | 1.41% | 1.71% | 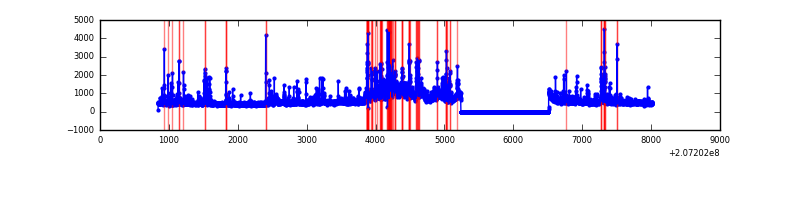 |
Top three noisy pixels from each quadrant. If the there are fewer than three noisy pixels in the level2.evt file, extra rows are filled as -1
| Pixel properties | Quadrant properties | ||||||
|---|---|---|---|---|---|---|---|
| Quadrant | DetID | PixID | Counts | Sigma | Mean | Median | Sigma |
| A | 0 | 13 | 639087 | 4454.56 | 706 | 692 | 143.3 |
| A | 0 | 118 | 136582 | 948.21 | 706 | 692 | 143.3 |
| A | 13 | 251 | 48358 | 332.6 | 706 | 692 | 143.3 |
| B | 15 | 204 | 29488 | 206.05 | 733 | 717 | 139.6 |
| B | 4 | 48 | 12264 | 82.7 | 733 | 717 | 139.6 |
| B | 15 | 185 | 12075 | 81.34 | 733 | 717 | 139.6 |
| C | 14 | 48 | 101678 | 617.99 | 710 | 712 | 163.4 |
| C | 9 | 16 | 6948 | 38.17 | 710 | 712 | 163.4 |
| C | 9 | 247 | 6717 | 36.76 | 710 | 712 | 163.4 |
| D | 12 | 79 | 744804 | 4394.61 | 694 | 674 | 169.3 |
| D | 13 | 235 | 300905 | 1773.08 | 694 | 674 | 169.3 |
| D | 12 | 233 | 165497 | 973.4 | 694 | 674 | 169.3 |
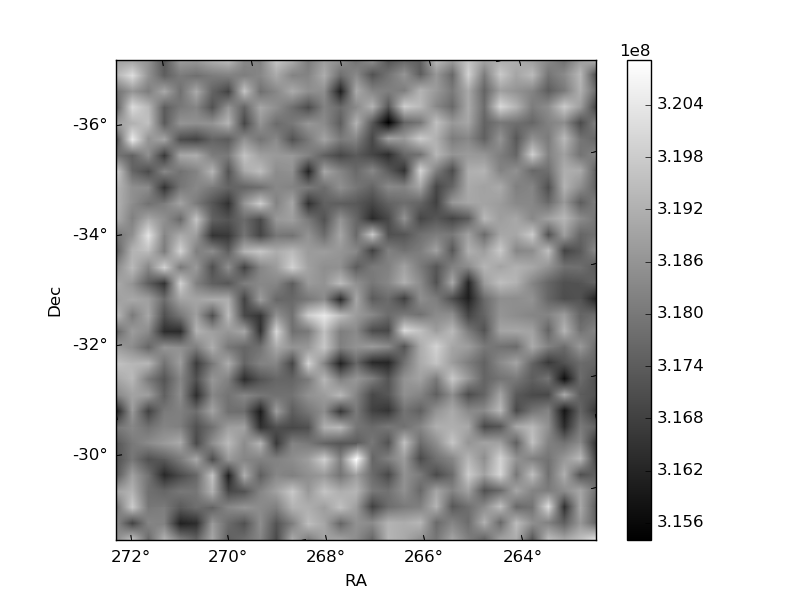
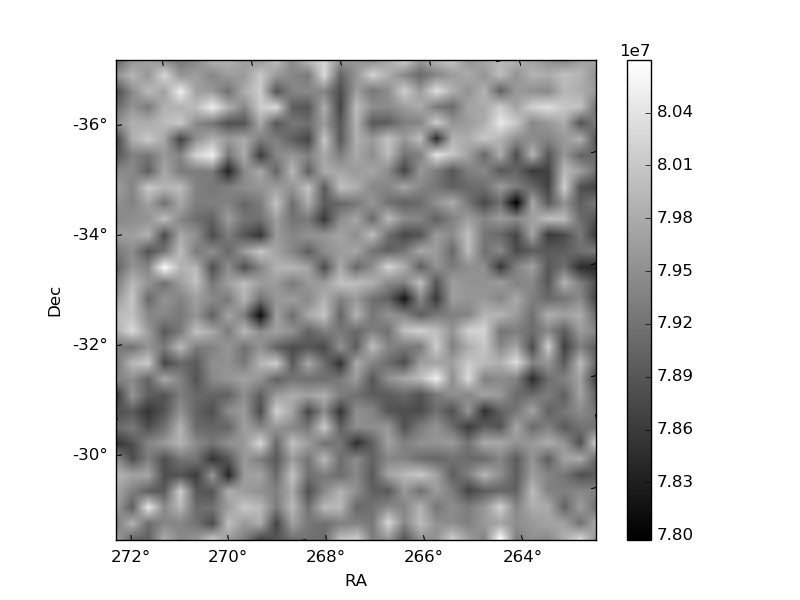
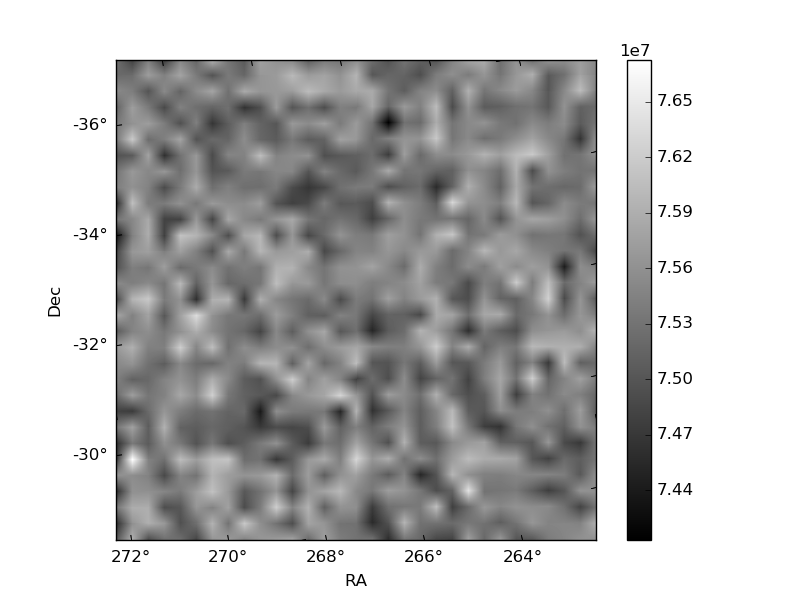
Histogram calculated using DETX and DETY for each event in the final _common_clean file
| Quadrant A | 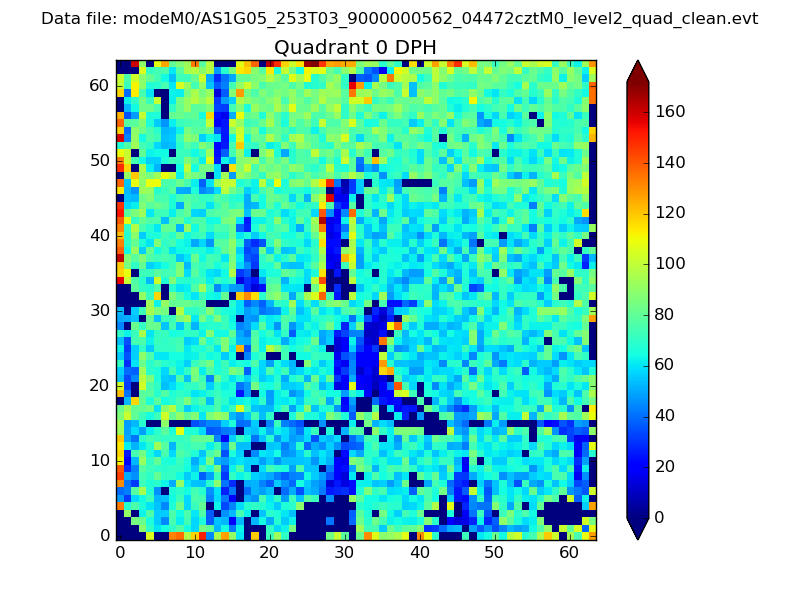 |
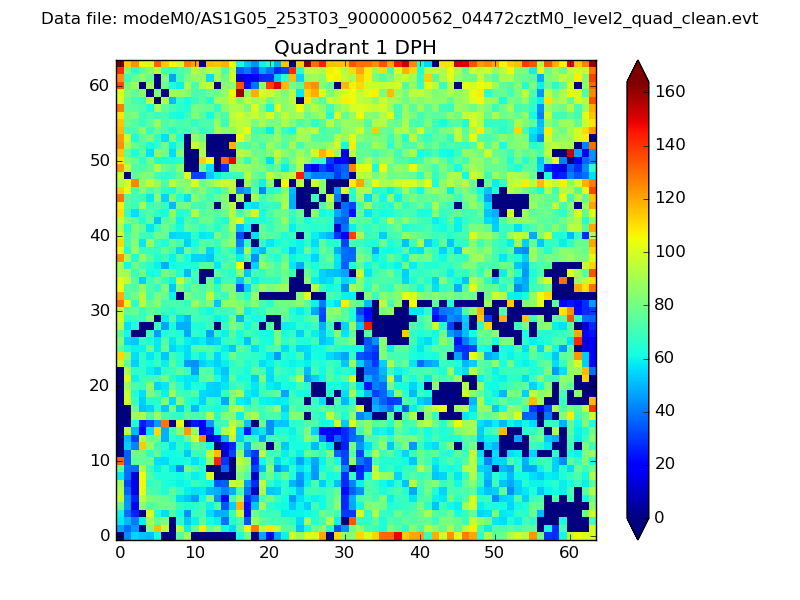 |
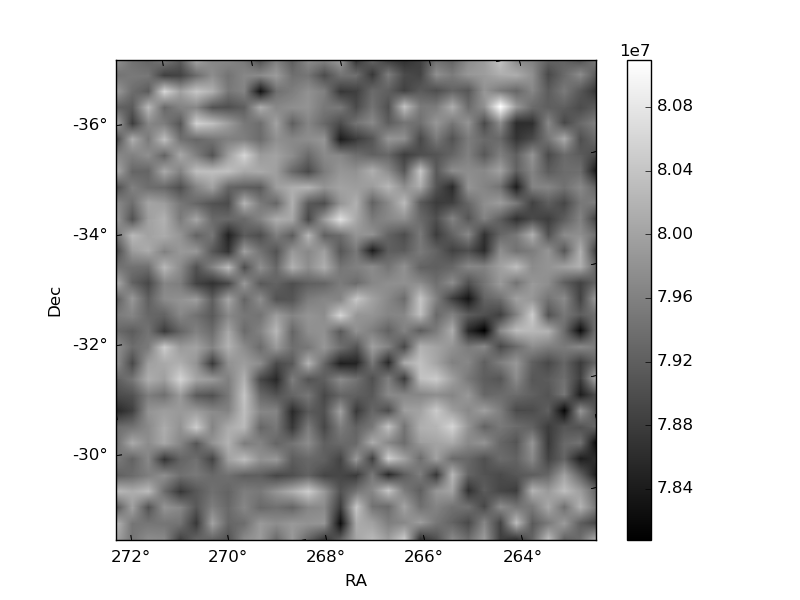
Quadrant B |
|---|---|---|---|
| Quadrant D | 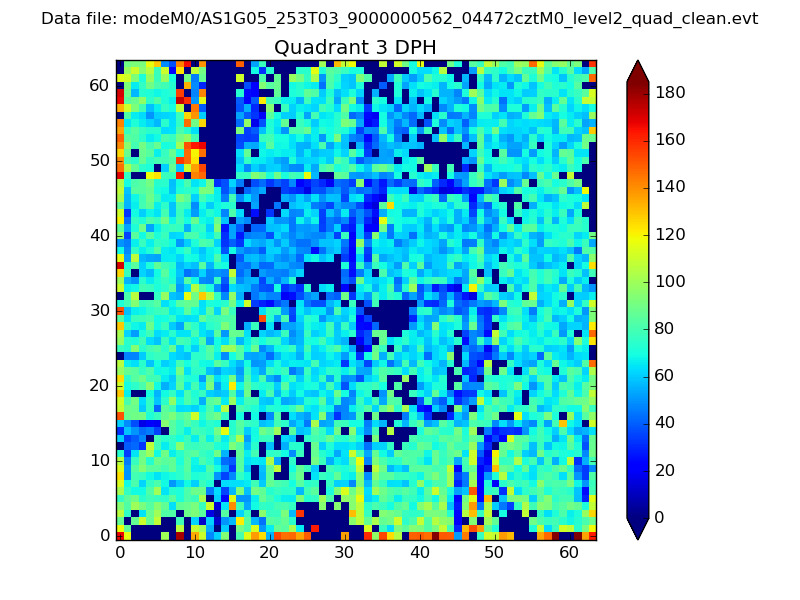 |
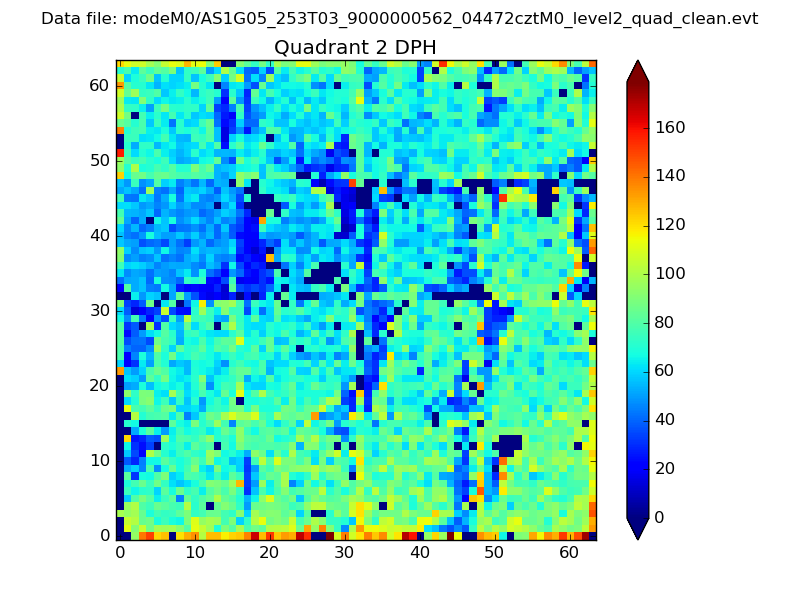 |
Quadrant C |
| Plot type | Count rate plots | Images |
|---|---|---|
| Comparison with Poisson distribution Blue bars denote a histogram of data divided into 1 sec bins. Red curve is a Poisson curve with rate = median count rate of data. |
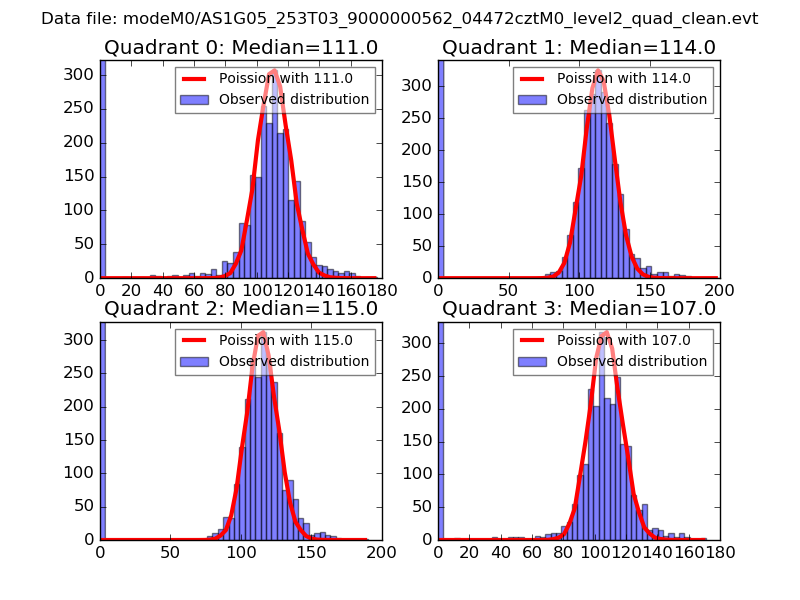 |
 |
| Quadrant-wise count rates Data is divided into 100 sec bins |
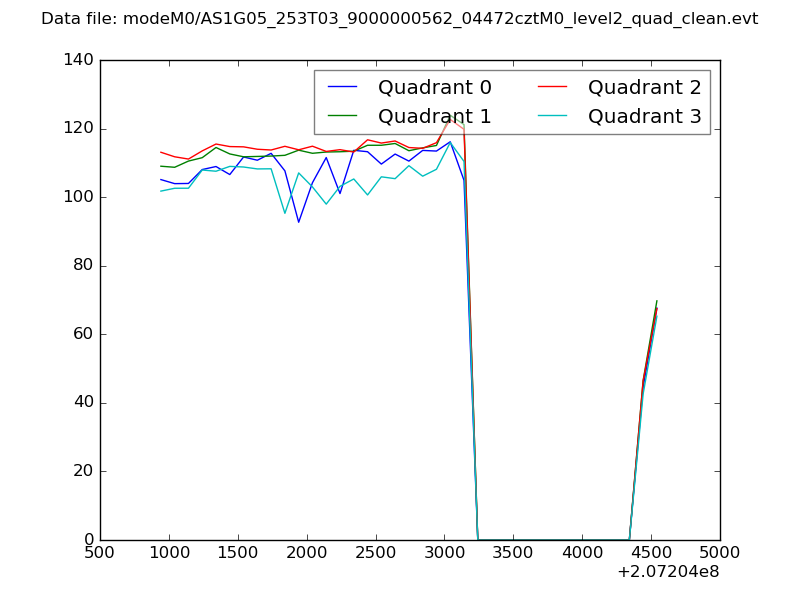 |
|
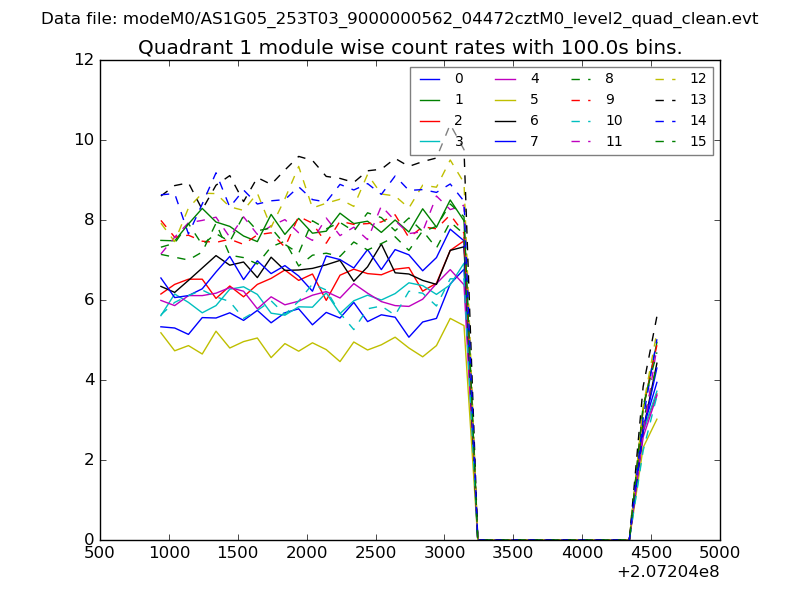
| Module-wise count rates for Quadrant A Data is divided into 100 sec bins |
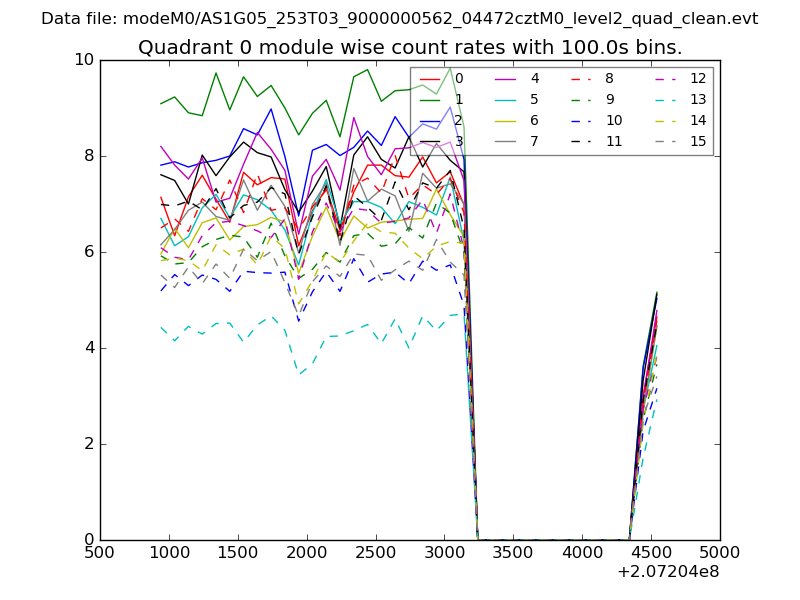 |
 |
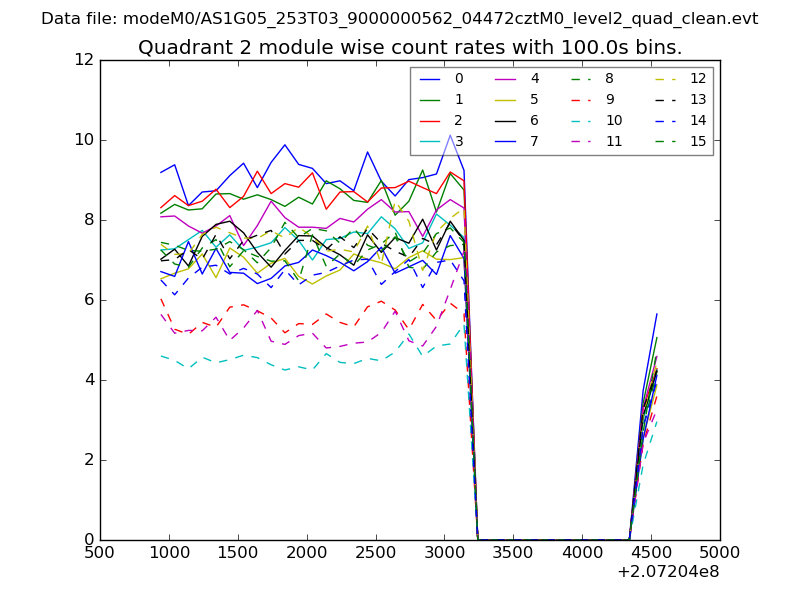
| Module-wise count rates for Quadrant B Data is divided into 100 sec bins |
 |
 |
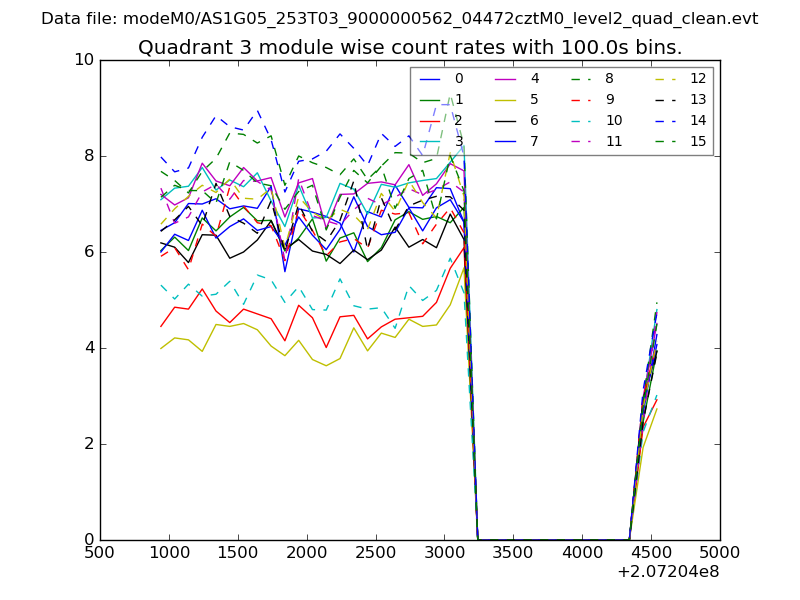
| Module-wise count rates for Quadrant C Data is divided into 100 sec bins |
 |
 |
| Module-wise count rates for Quadrant D Data is divided into 100 sec bins |
 |
 |
| Parameter | Plot |
|---|---|
| CZT HV Monitor | 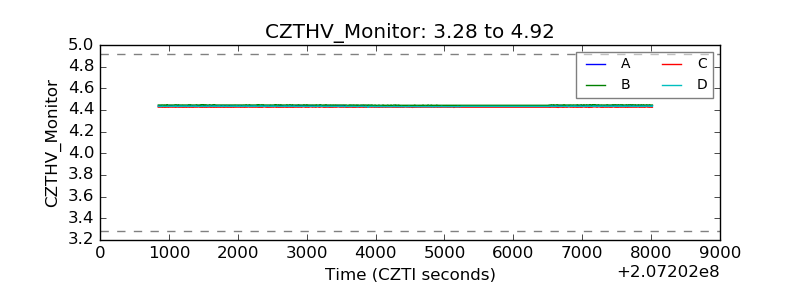 |
| D_VDD | 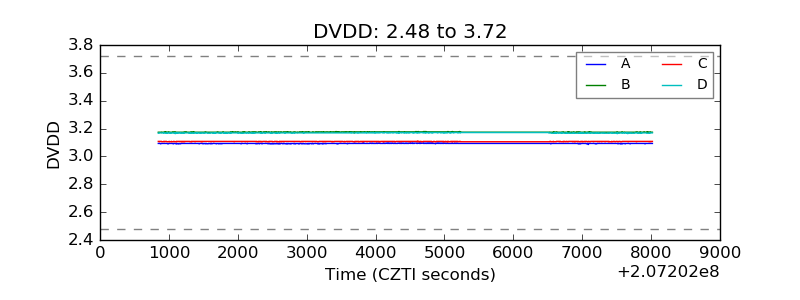 |
| Temperature 1 | 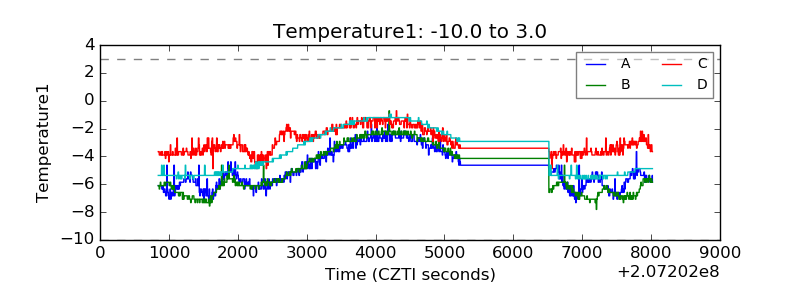 |
| Veto HV Monitor | 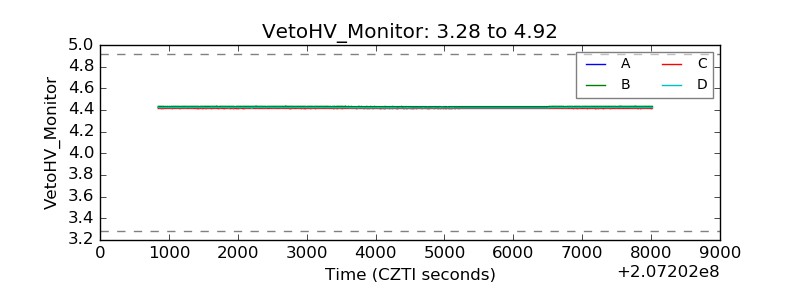 |
| Veto LLD | 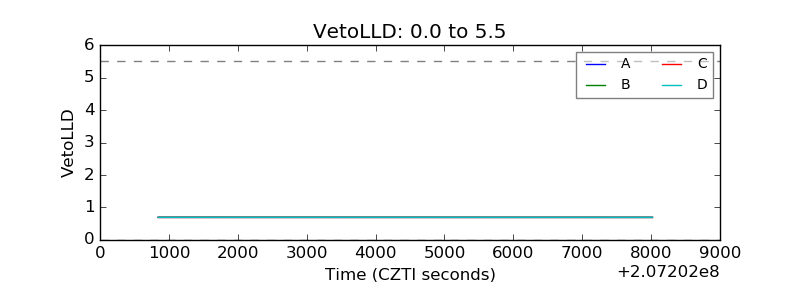 |
| Alpha Counter | 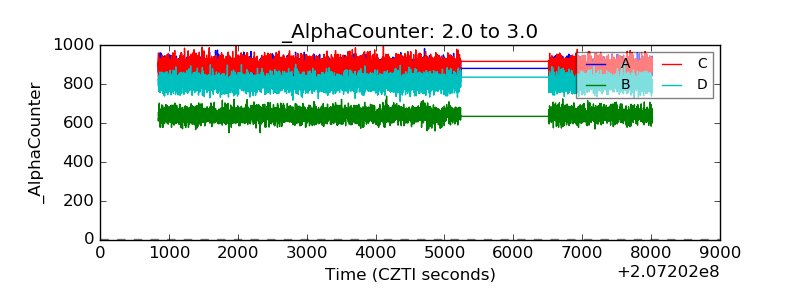 |
| _CPM_Rate | 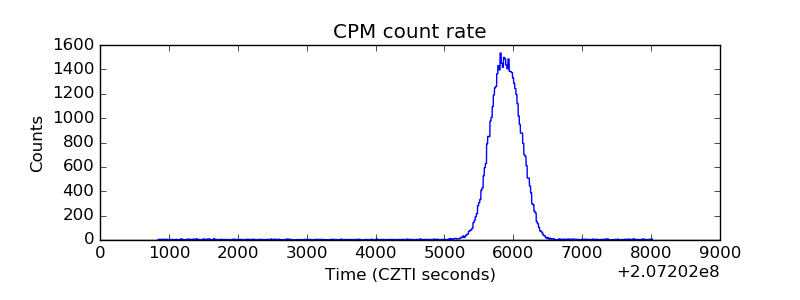 |
| CZT Counter | 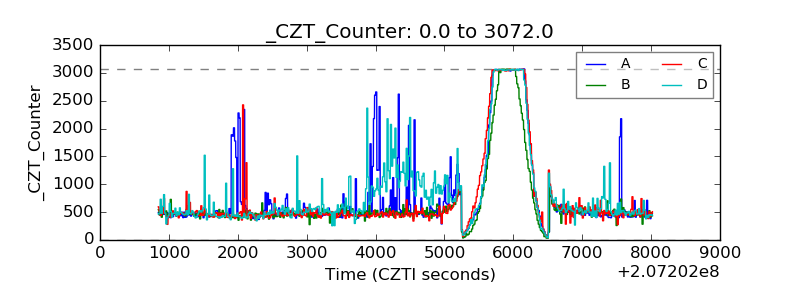 |
| +2.5 Volts monitor |  |
| +5 Volts monitor |  |
| _ROLL_ROT | 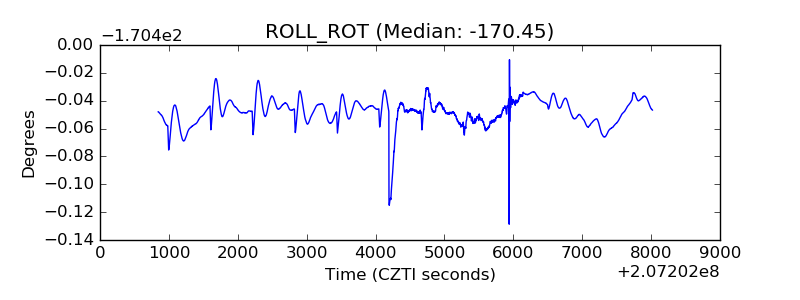 |
| _Roll_DEC | 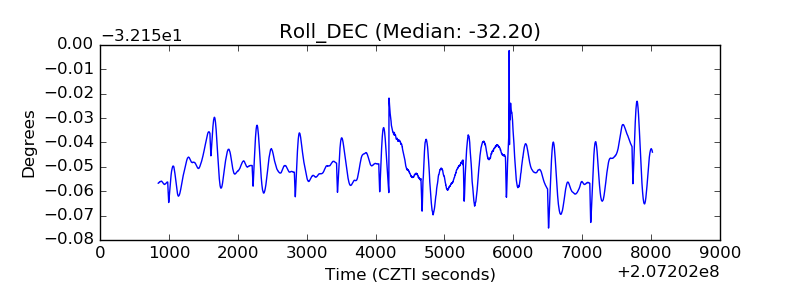 |
| _Roll_RA | 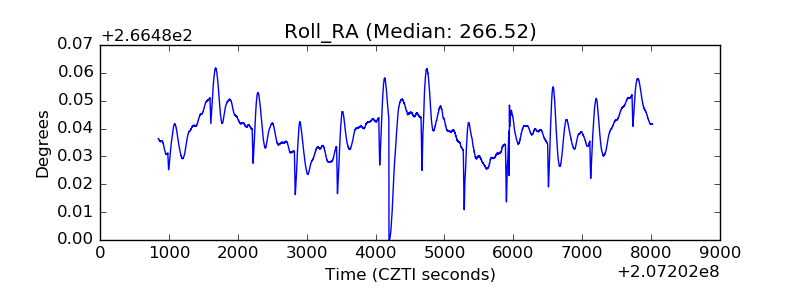 |
| Veto Counter | 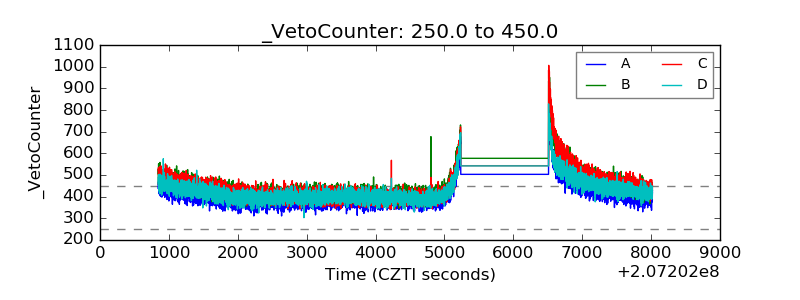 |