| Param | Original file | Final file |
|---|---|---|
| Filename | modeM0/AS1G05_253T03_9000000562_04474cztM0_level2.evt | modeM0/AS1G05_253T03_9000000562_04474cztM0_level2_quad_clean.evt |
| Size (bytes) | 480,960,000 | 61,390,080 |
| Size | 458.7 MB | 58.5 MB |
| Events in quadrant A | 4,671,800 | 350,813 |
| Events in quadrant B | 2,984,623 | 365,208 |
| Events in quadrant C | 3,006,134 | 368,797 |
| Events in quadrant D | 3,488,509 | 347,247 |
| Mode SS | |||
|---|---|---|---|
| Quadrant | BADHDUFLAG | Total packets | Discarded packets |
| A | 0 | 124 | 0 |
| B | 0 | 124 | 0 |
| C | 0 | 124 | 0 |
| D | 0 | 124 | 0 |
| Mode M9 | |||
|---|---|---|---|
| Quadrant | BADHDUFLAG | Total packets | Discarded packets |
| A | 0 | 10 | 0 |
| B | 0 | 10 | 0 |
| C | 0 | 10 | 0 |
| D | 0 | 10 | 0 |
| Mode M0 | |||
|---|---|---|---|
| Quadrant | BADHDUFLAG | Total packets | Discarded packets |
| A | 0 | 17972 | 4 |
| B | 0 | 12699 | 1 |
| C | 0 | 13053 | 1 |
| D | 0 | 14497 | 1 |
| Quadrant | Total seconds | Saturated seconds | Saturation percentage |
|---|---|---|---|
| A | 6107 | 513 | 8.400196% |
| B | 6108 | 105 | 1.719057% |
| C | 6108 | 117 | 1.915521% |
| D | 6108 | 231 | 3.781925% |
Noise dominated data is calculated using 1-second bins in cleaned event files. If a bin has >2000 counts, and if more than 50% of those come from <1% of pixels, then it is considered to be noise-dominated and hence unusable.
| Quadrant | # 1 sec bins | Bins with >0 counts | Bins with >2000 counts | High rate bins dominated by noise | Noise dominated (total time) | Noise dominated (detector-on time) | Marked lightcurve |
|---|---|---|---|---|---|---|---|
| A | 7143 | 6109 | 291 | 291 | 4.07% | 4.76% |  |
| B | 7143 | 6109 | 0 | 0 | 0.00% | 0.00% | 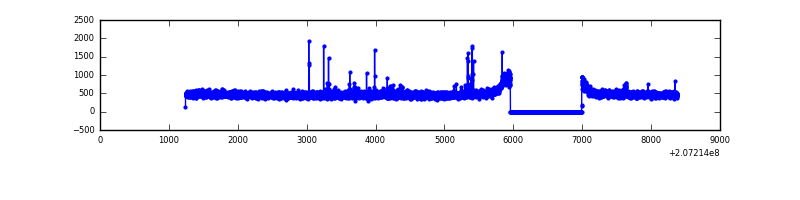 |
| C | 7143 | 6109 | 15 | 15 | 0.21% | 0.25% | 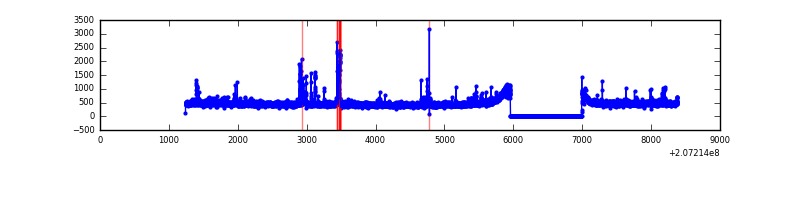 |
| D | 7143 | 6109 | 100 | 100 | 1.40% | 1.64% | 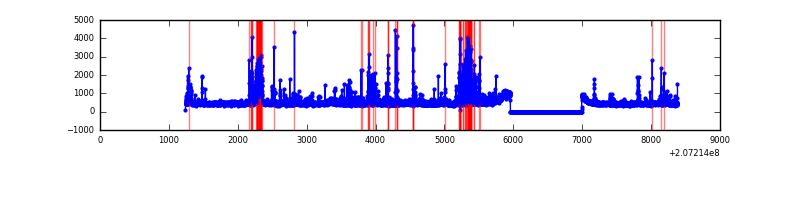 |
Top three noisy pixels from each quadrant. If the there are fewer than three noisy pixels in the level2.evt file, extra rows are filled as -1
| Pixel properties | Quadrant properties | ||||||
|---|---|---|---|---|---|---|---|
| Quadrant | DetID | PixID | Counts | Sigma | Mean | Median | Sigma |
| A | 0 | 13 | 1461913 | 9912.19 | 717 | 699 | 147.4 |
| A | 0 | 118 | 390803 | 2646.28 | 717 | 699 | 147.4 |
| A | 0 | 226 | 43858 | 292.77 | 717 | 699 | 147.4 |
| B | 15 | 204 | 37647 | 255.77 | 743 | 726 | 144.4 |
| B | 4 | 48 | 22876 | 153.44 | 743 | 726 | 144.4 |
| B | 15 | 185 | 15675 | 103.56 | 743 | 726 | 144.4 |
| C | 14 | 48 | 98498 | 582.67 | 721 | 724 | 167.8 |
| C | 9 | 54 | 51984 | 305.48 | 721 | 724 | 167.8 |
| C | 9 | 16 | 15885 | 90.35 | 721 | 724 | 167.8 |
| D | 13 | 235 | 551263 | 3169.01 | 710 | 687 | 173.7 |
| D | 5 | 51 | 70523 | 401.96 | 710 | 687 | 173.7 |
| D | 12 | 79 | 60104 | 341.99 | 710 | 687 | 173.7 |
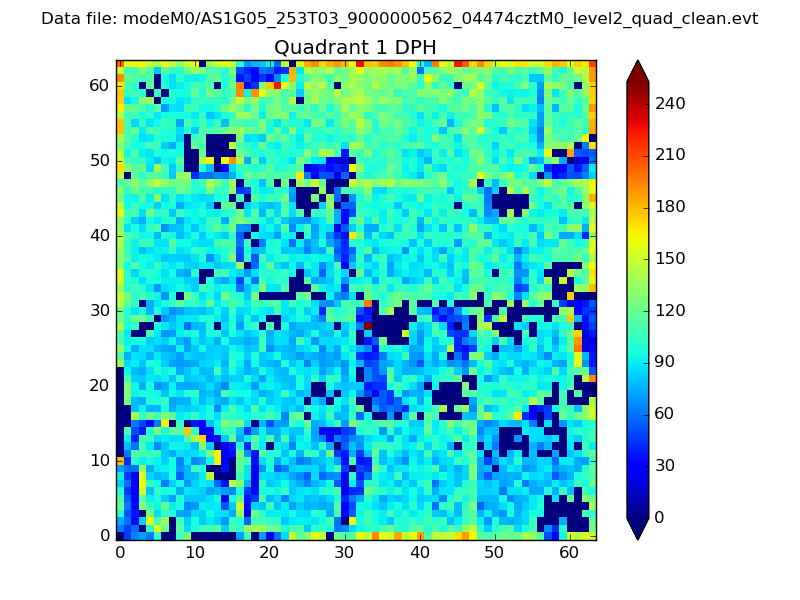
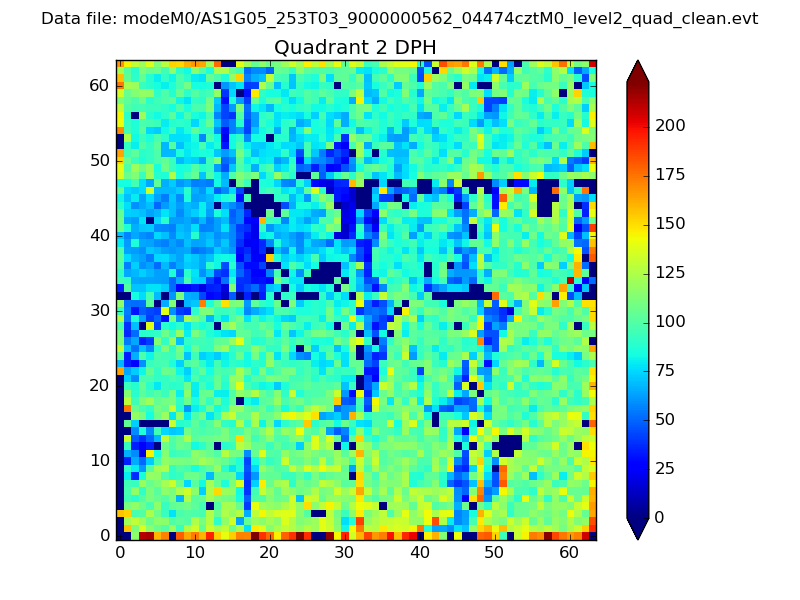
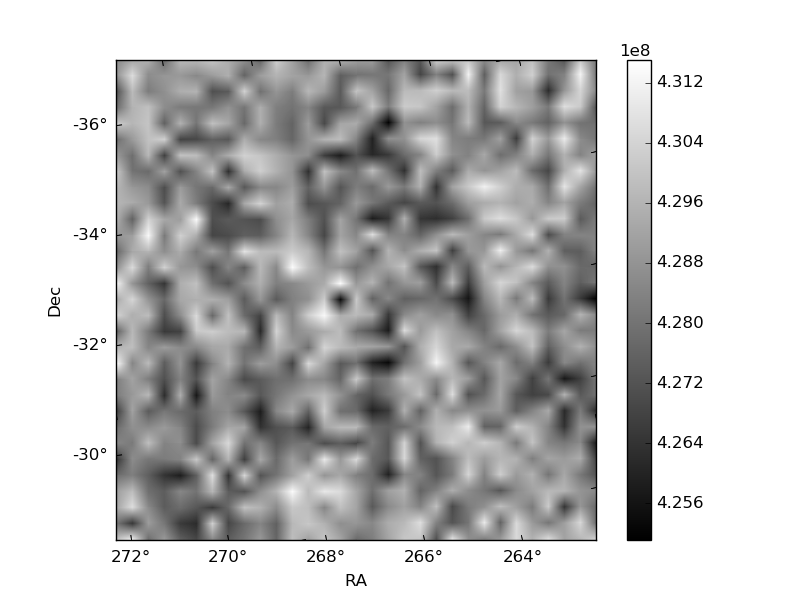
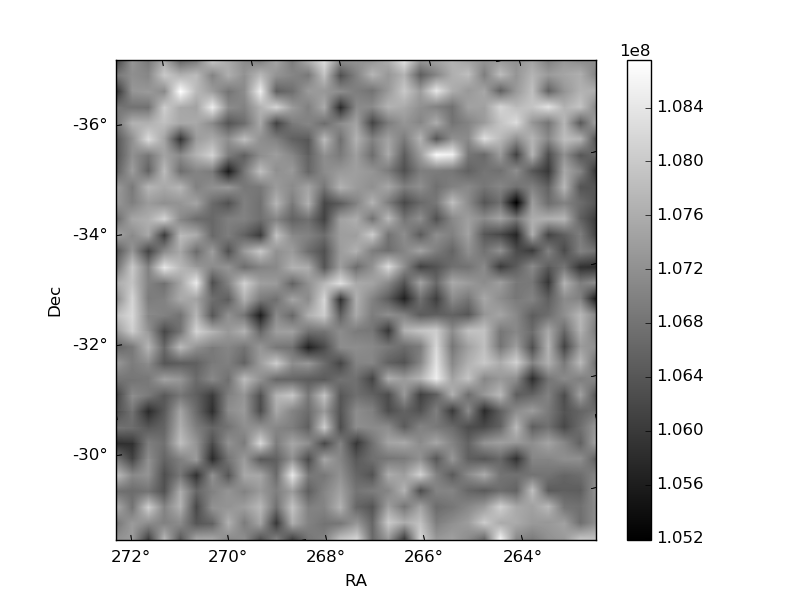
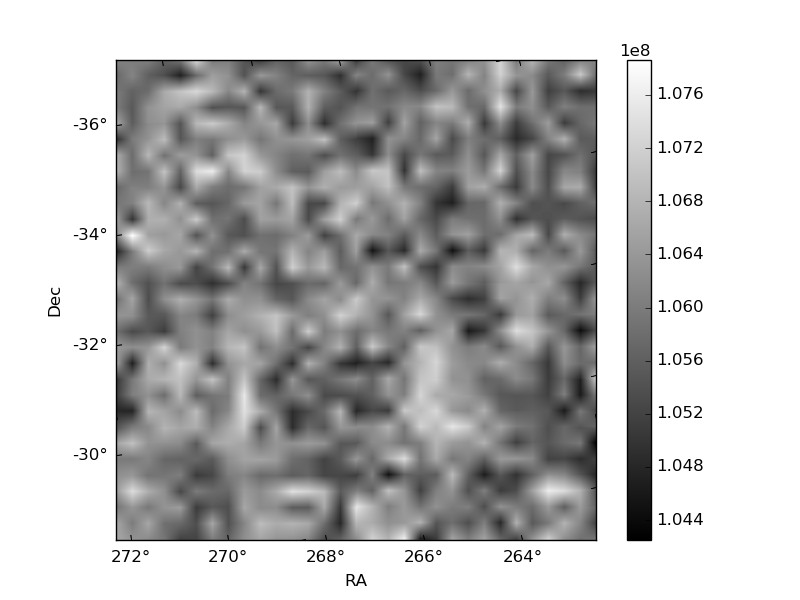
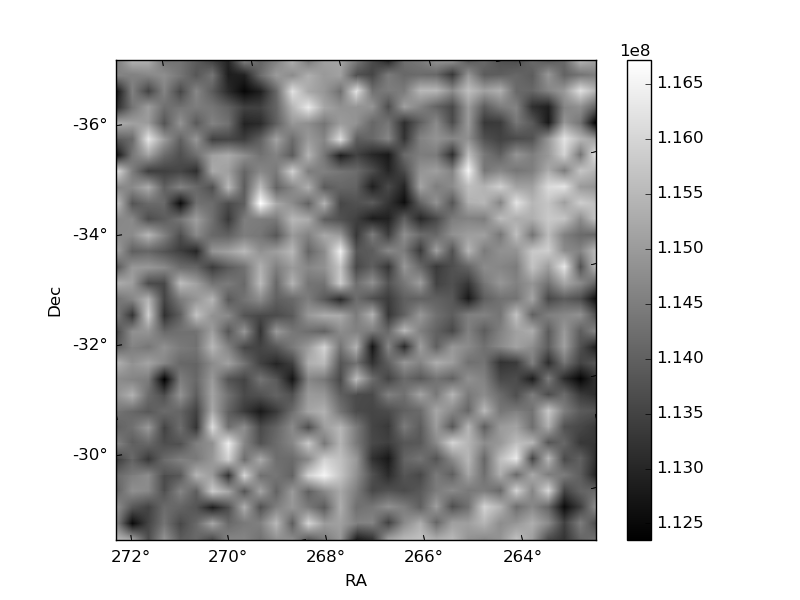
Histogram calculated using DETX and DETY for each event in the final _common_clean file
| Quadrant A | 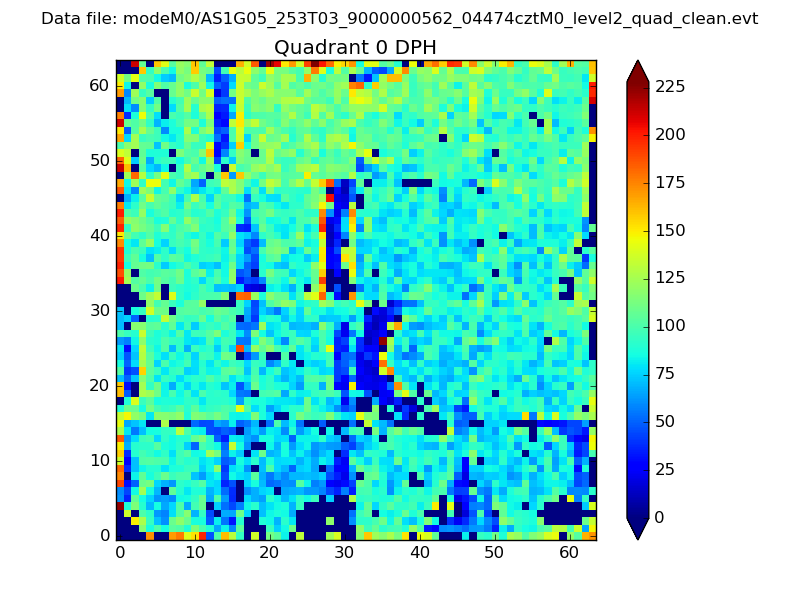 |
 |
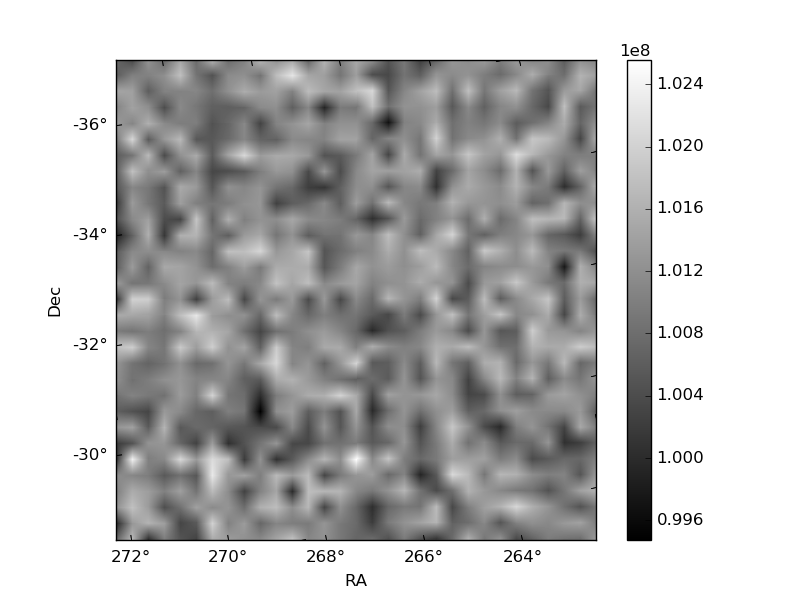
Quadrant B |
|---|---|---|---|
| Quadrant D | 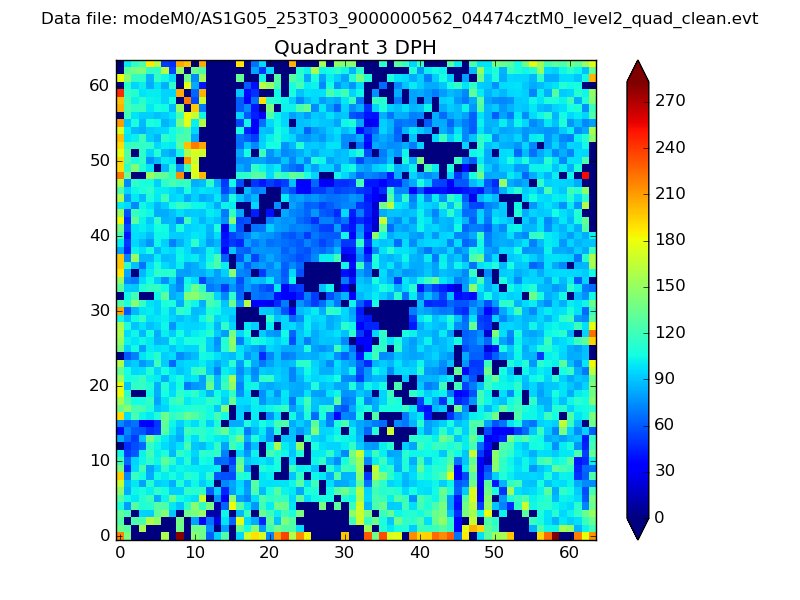 |
 |
Quadrant C |
| Plot type | Count rate plots | Images |
|---|---|---|
| Comparison with Poisson distribution Blue bars denote a histogram of data divided into 1 sec bins. Red curve is a Poisson curve with rate = median count rate of data. |
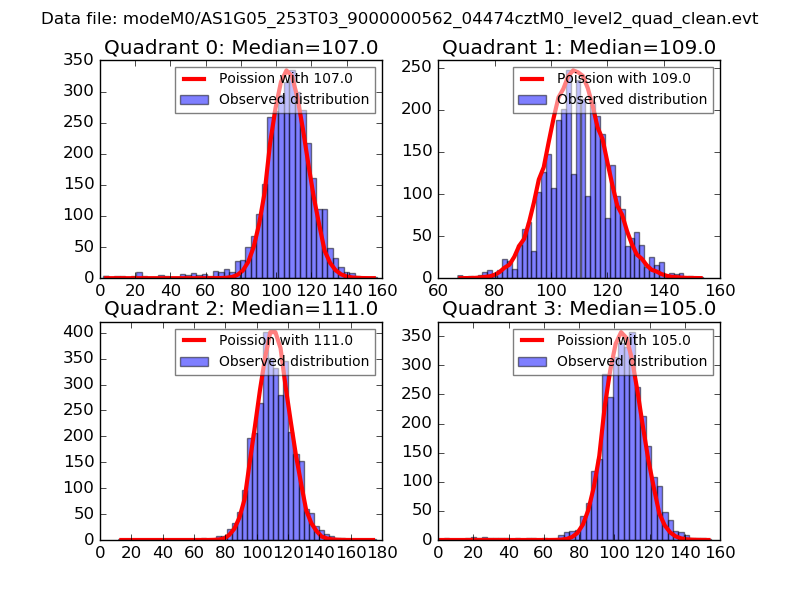 |
 |
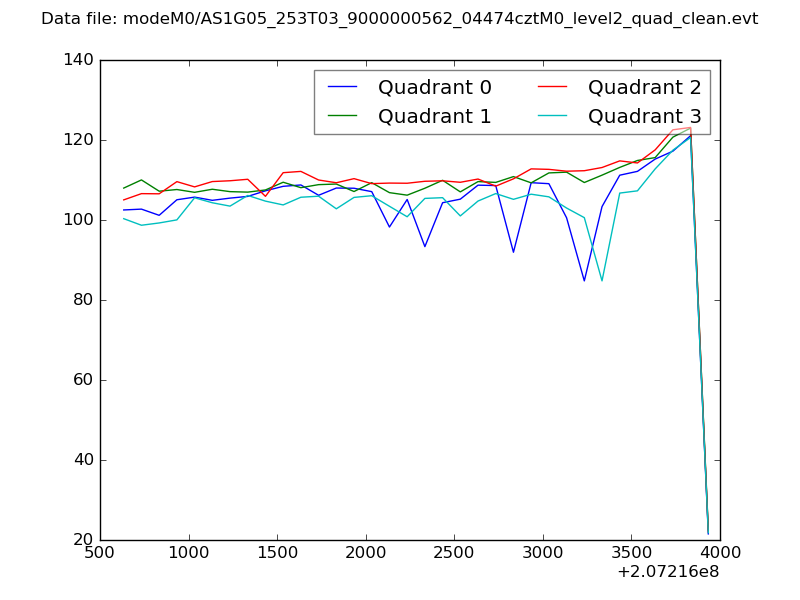
| Quadrant-wise count rates Data is divided into 100 sec bins |
 |
|
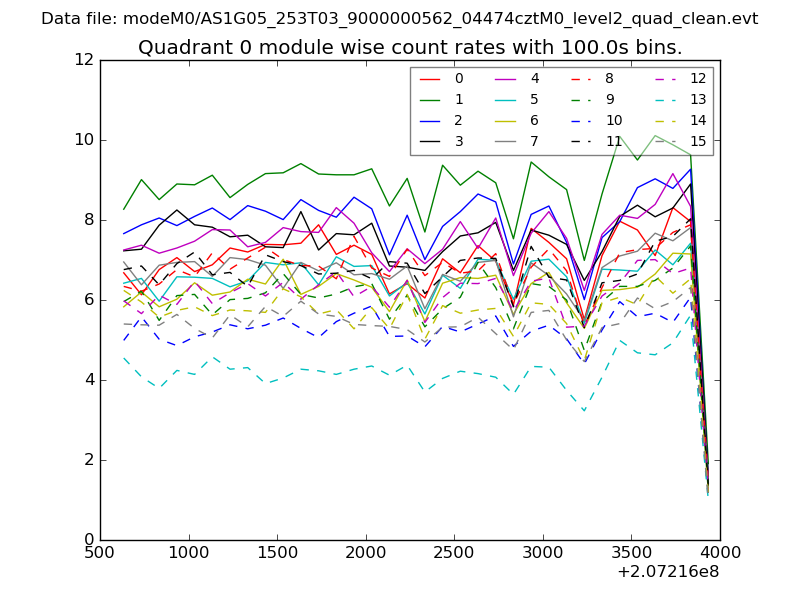
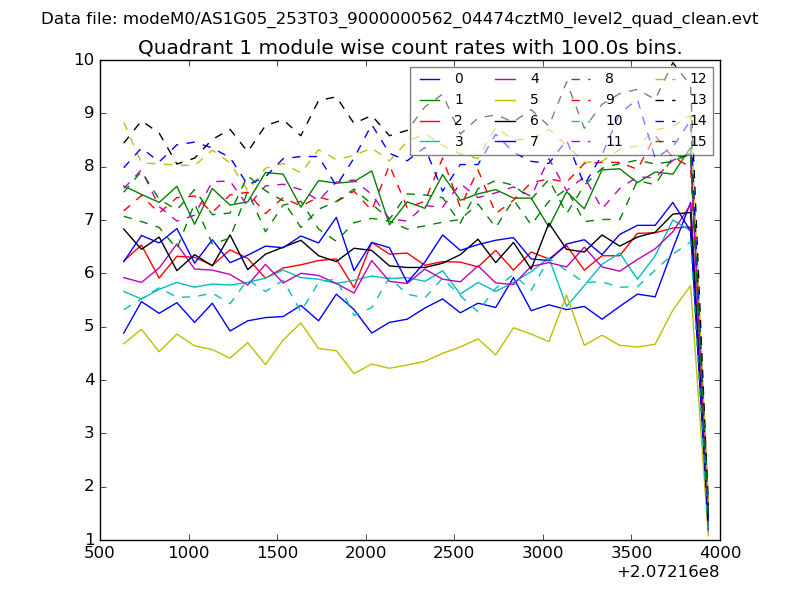
| Module-wise count rates for Quadrant A Data is divided into 100 sec bins |
 |
 |
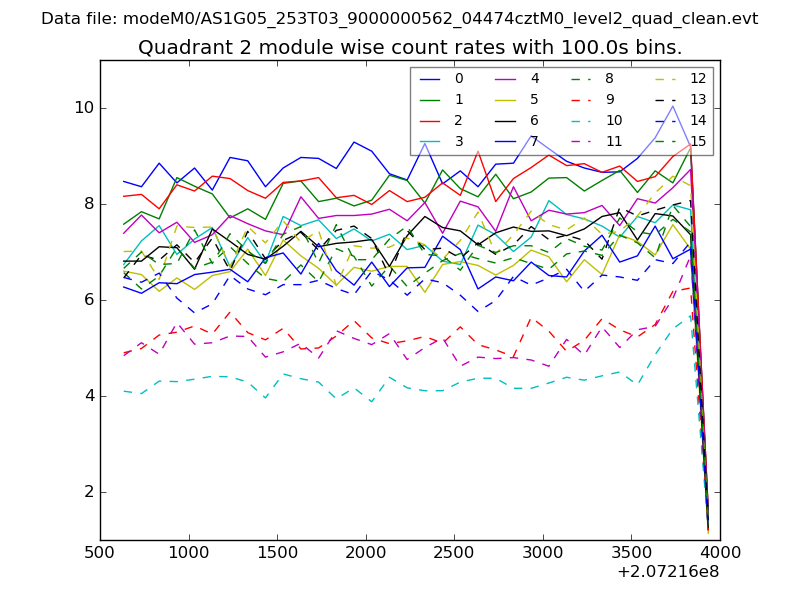
| Module-wise count rates for Quadrant B Data is divided into 100 sec bins |
 |
 |
| Module-wise count rates for Quadrant C Data is divided into 100 sec bins |
 |
 |
| Module-wise count rates for Quadrant D Data is divided into 100 sec bins |
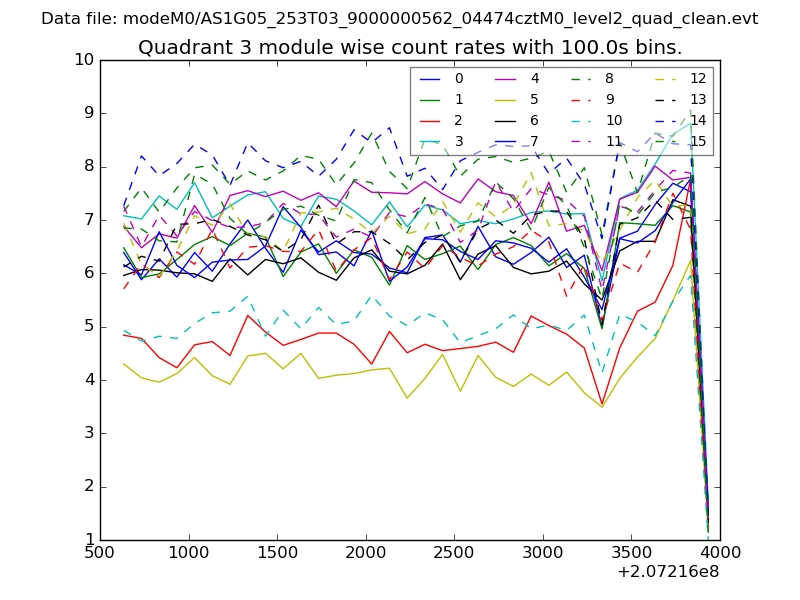 |
 |
| Parameter | Plot |
|---|---|
| CZT HV Monitor | 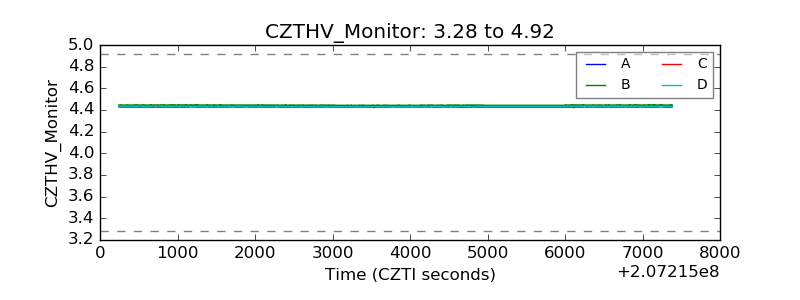 |
| D_VDD | 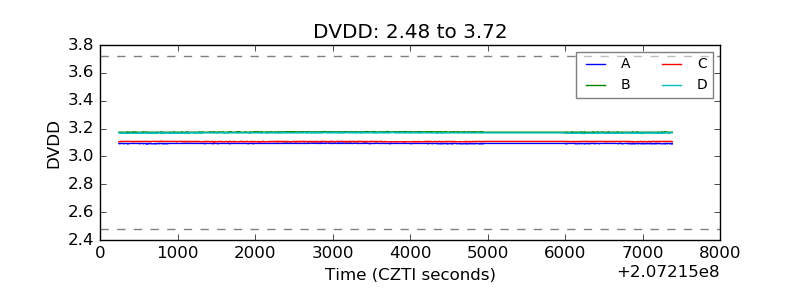 |
| Temperature 1 | 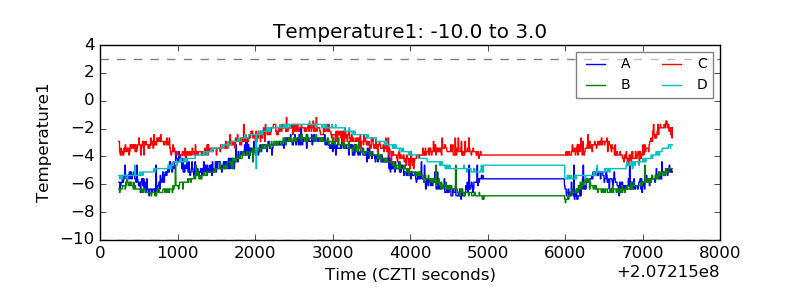 |
| Veto HV Monitor | 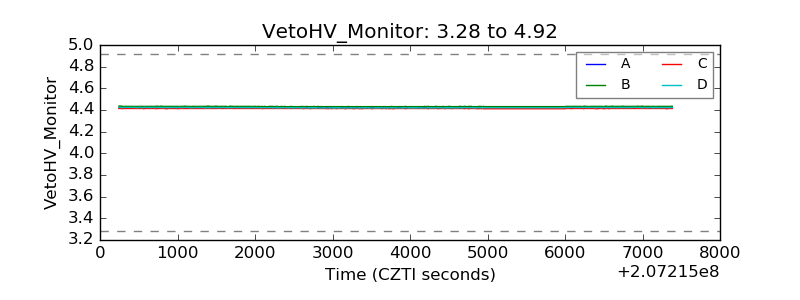 |
| Veto LLD | 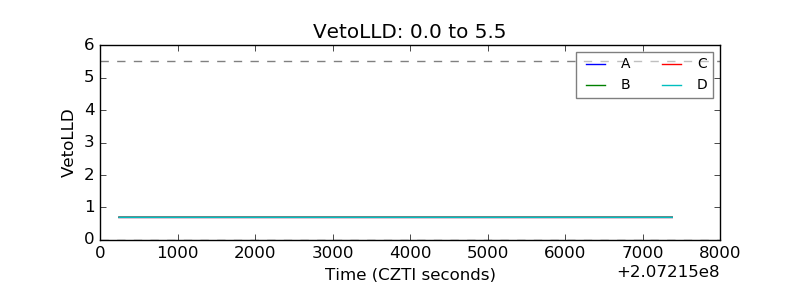 |
| Alpha Counter | 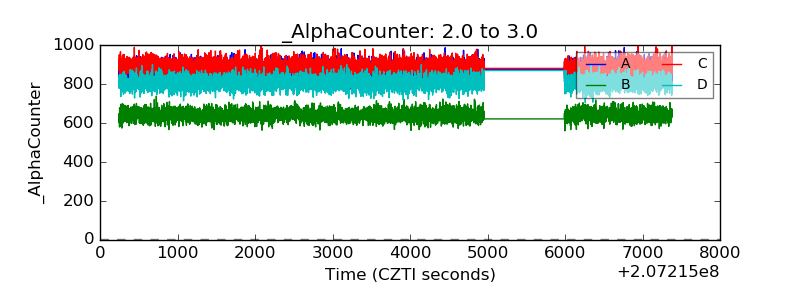 |
| _CPM_Rate | 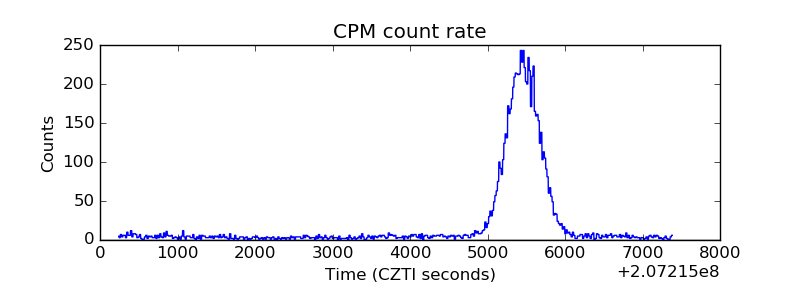 |
| CZT Counter | 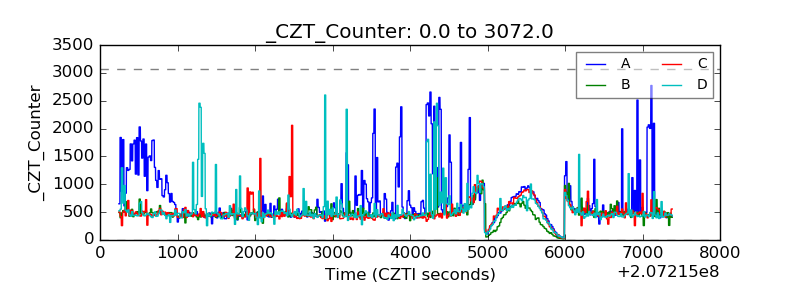 |
| +2.5 Volts monitor |  |
| +5 Volts monitor |  |
| _ROLL_ROT | 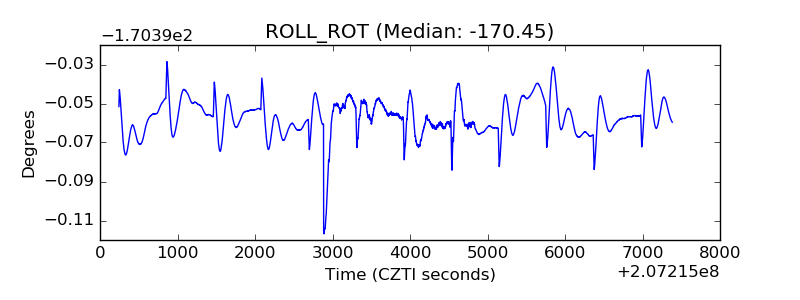 |
| _Roll_DEC | 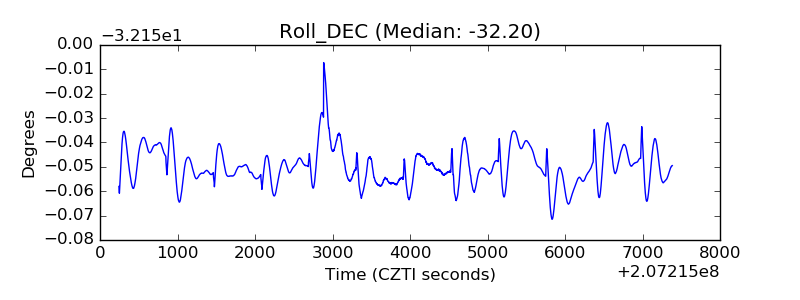 |
| _Roll_RA | 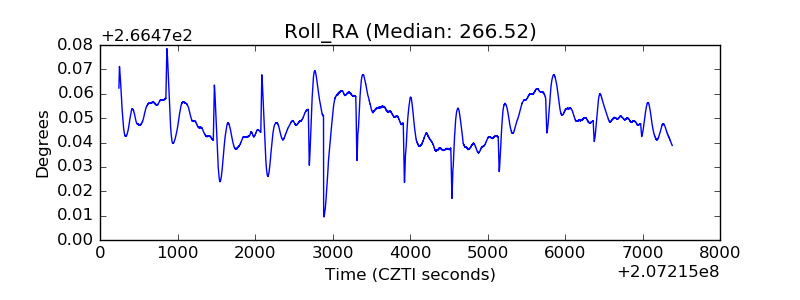 |
| Veto Counter | 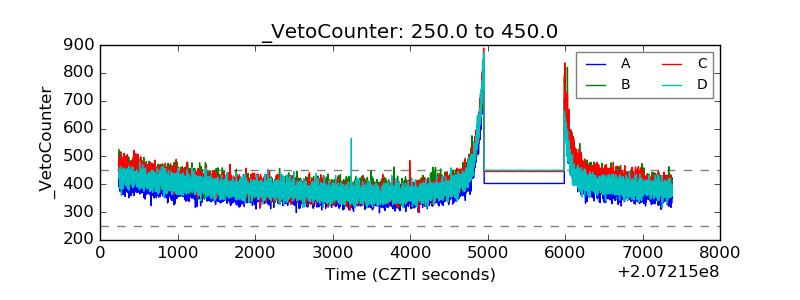 |