| Param | Original file | Final file |
|---|---|---|
| Filename | modeM0/AS1G05_253T03_9000000562_04475cztM0_level2.evt | modeM0/AS1G05_253T03_9000000562_04475cztM0_level2_quad_clean.evt |
| Size (bytes) | 497,643,840 | 69,589,440 |
| Size | 474.6 MB | 66.4 MB |
| Events in quadrant A | 4,863,992 | 390,179 |
| Events in quadrant B | 3,204,476 | 425,469 |
| Events in quadrant C | 3,075,552 | 428,269 |
| Events in quadrant D | 3,482,287 | 406,573 |
| Mode SS | |||
|---|---|---|---|
| Quadrant | BADHDUFLAG | Total packets | Discarded packets |
| A | 0 | 134 | 0 |
| B | 0 | 134 | 0 |
| C | 0 | 134 | 0 |
| D | 0 | 134 | 0 |
| Mode M9 | |||
|---|---|---|---|
| Quadrant | BADHDUFLAG | Total packets | Discarded packets |
| A | 0 | 6 | 0 |
| B | 0 | 6 | 0 |
| C | 0 | 6 | 0 |
| D | 0 | 6 | 0 |
| Mode M0 | |||
|---|---|---|---|
| Quadrant | BADHDUFLAG | Total packets | Discarded packets |
| A | 0 | 18946 | 10 |
| B | 0 | 13687 | 2 |
| C | 0 | 13700 | 2 |
| D | 0 | 14949 | 2 |
| Quadrant | Total seconds | Saturated seconds | Saturation percentage |
|---|---|---|---|
| A | 6537 | 886 | 13.553618% |
| B | 6539 | 168 | 2.569200% |
| C | 6539 | 159 | 2.431564% |
| D | 6539 | 261 | 3.991436% |
Noise dominated data is calculated using 1-second bins in cleaned event files. If a bin has >2000 counts, and if more than 50% of those come from <1% of pixels, then it is considered to be noise-dominated and hence unusable.
| Quadrant | # 1 sec bins | Bins with >0 counts | Bins with >2000 counts | High rate bins dominated by noise | Noise dominated (total time) | Noise dominated (detector-on time) | Marked lightcurve |
|---|---|---|---|---|---|---|---|
| A | 7204 | 6541 | 520 | 520 | 7.22% | 7.95% | 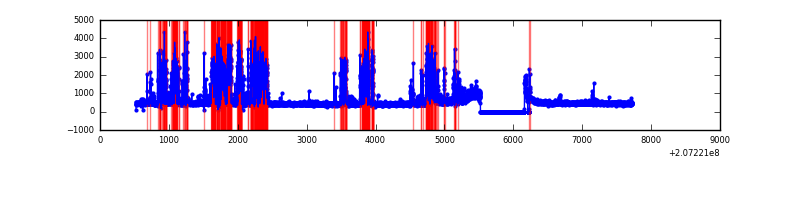 |
| B | 7204 | 6541 | 3 | 3 | 0.04% | 0.05% | 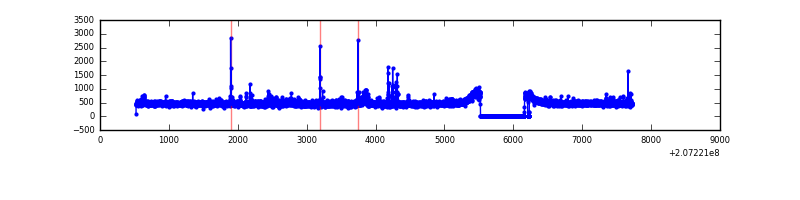 |
| C | 7204 | 6541 | 13 | 13 | 0.18% | 0.20% | 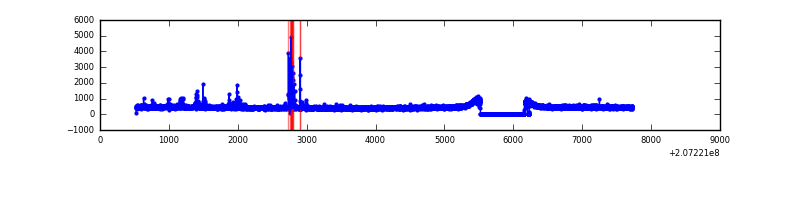 |
| D | 7204 | 6541 | 88 | 88 | 1.22% | 1.35% | 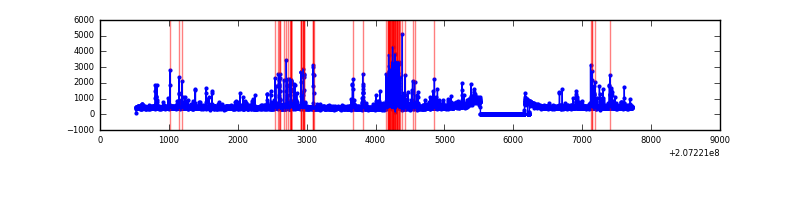 |
Top three noisy pixels from each quadrant. If the there are fewer than three noisy pixels in the level2.evt file, extra rows are filled as -1
| Pixel properties | Quadrant properties | ||||||
|---|---|---|---|---|---|---|---|
| Quadrant | DetID | PixID | Counts | Sigma | Mean | Median | Sigma |
| A | 0 | 13 | 1986129 | 13102.3 | 733 | 719 | 151.5 |
| A | 0 | 50 | 28820 | 185.45 | 733 | 719 | 151.5 |
| A | 13 | 251 | 20779 | 132.38 | 733 | 719 | 151.5 |
| B | 15 | 185 | 62767 | 412.51 | 779 | 761 | 150.3 |
| B | 15 | 204 | 35919 | 233.89 | 779 | 761 | 150.3 |
| B | 4 | 48 | 30911 | 200.58 | 779 | 761 | 150.3 |
| C | 9 | 16 | 103363 | 581.95 | 755 | 759 | 176.3 |
| C | 7 | 247 | 13413 | 71.77 | 755 | 759 | 176.3 |
| C | 9 | 247 | 6209 | 30.91 | 755 | 759 | 176.3 |
| D | 13 | 235 | 371939 | 2043.79 | 746 | 724 | 181.6 |
| D | 5 | 51 | 99556 | 544.14 | 746 | 724 | 181.6 |
| D | 12 | 79 | 41950 | 226.98 | 746 | 724 | 181.6 |
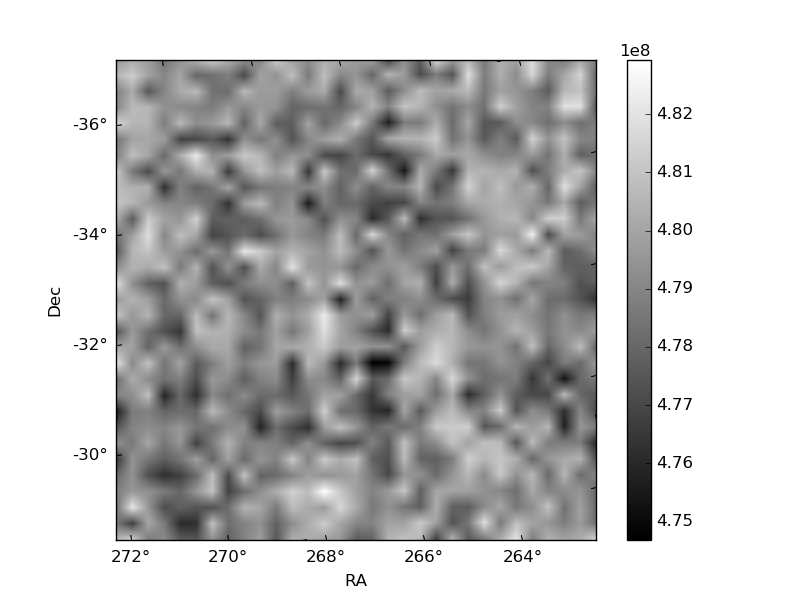
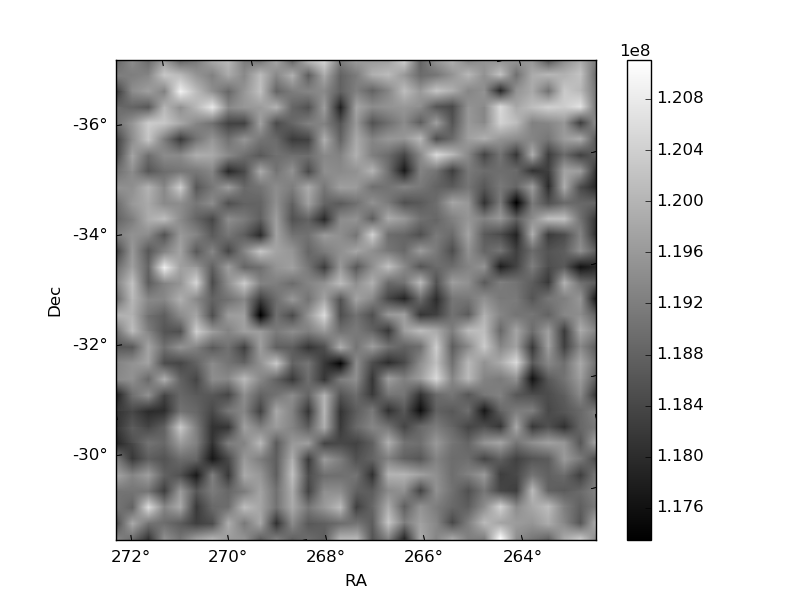
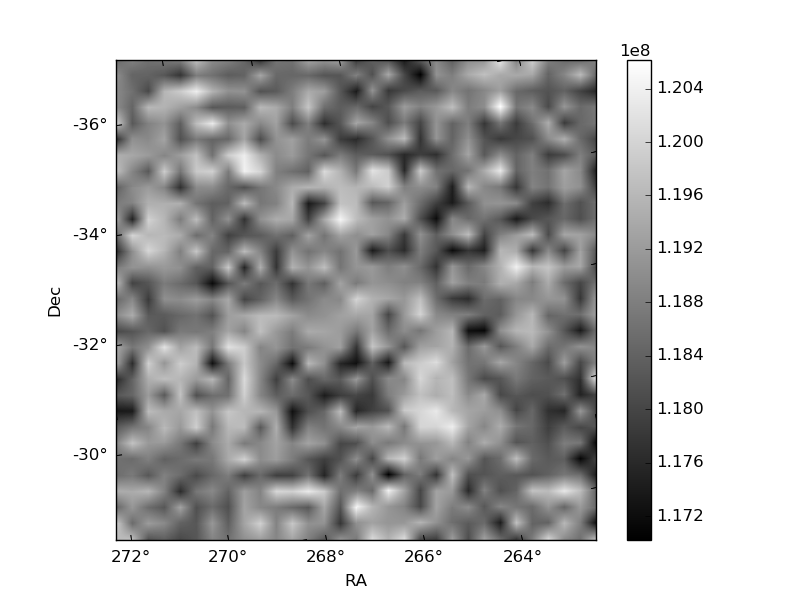
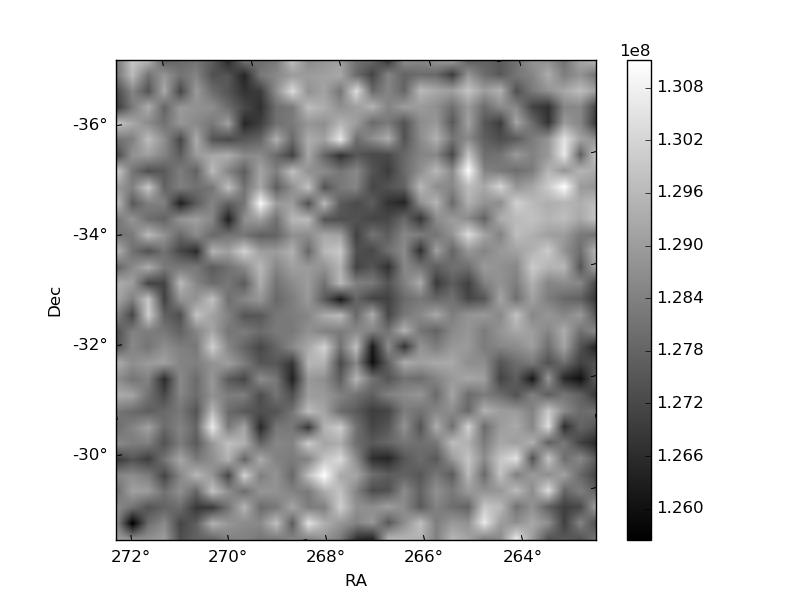
Histogram calculated using DETX and DETY for each event in the final _common_clean file
| Quadrant A | 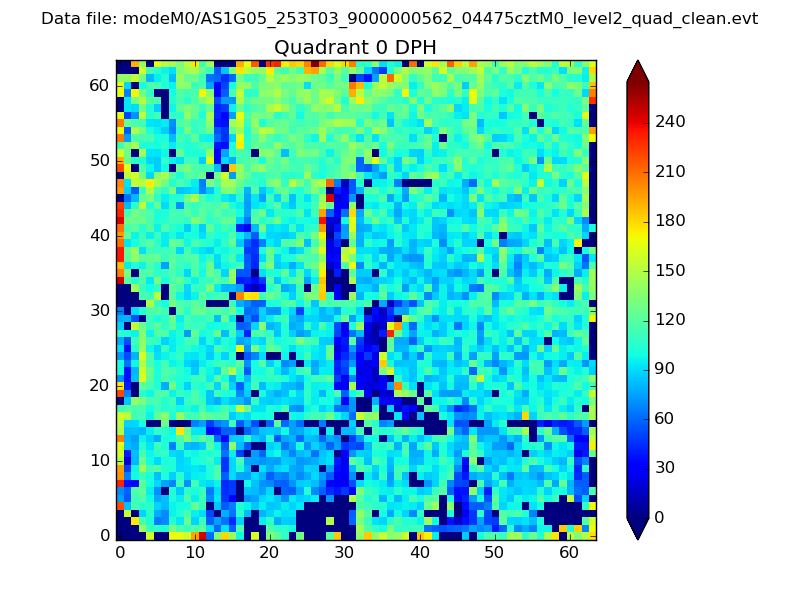 |
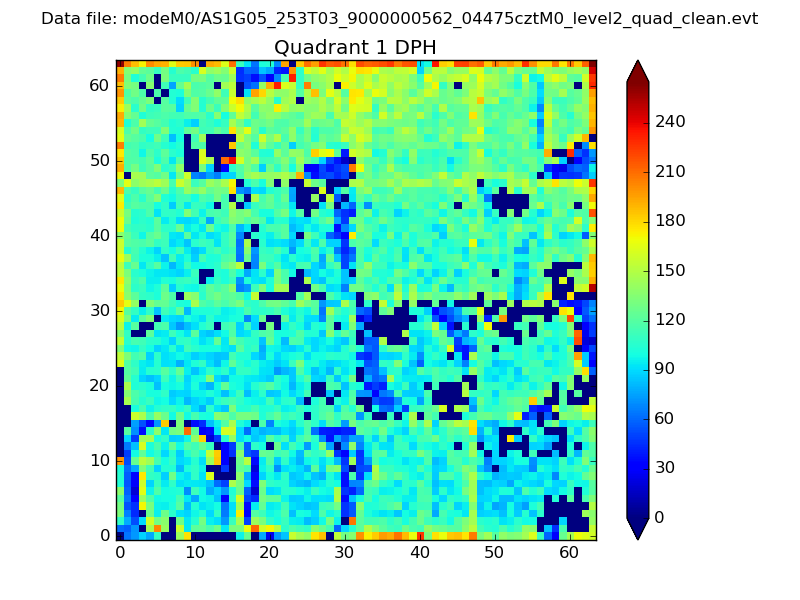 |
Quadrant B |
|---|---|---|---|
| Quadrant D | 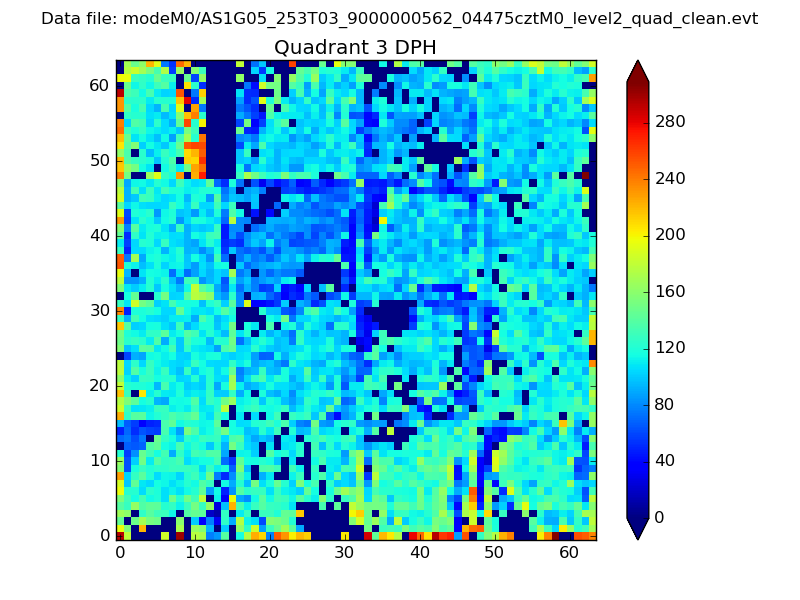 |
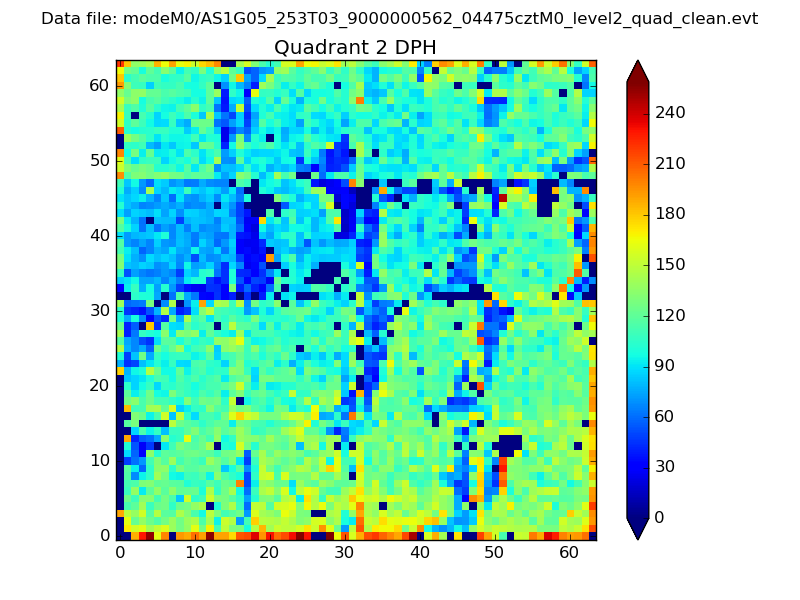 |
Quadrant C |
| Plot type | Count rate plots | Images |
|---|---|---|
| Comparison with Poisson distribution Blue bars denote a histogram of data divided into 1 sec bins. Red curve is a Poisson curve with rate = median count rate of data. |
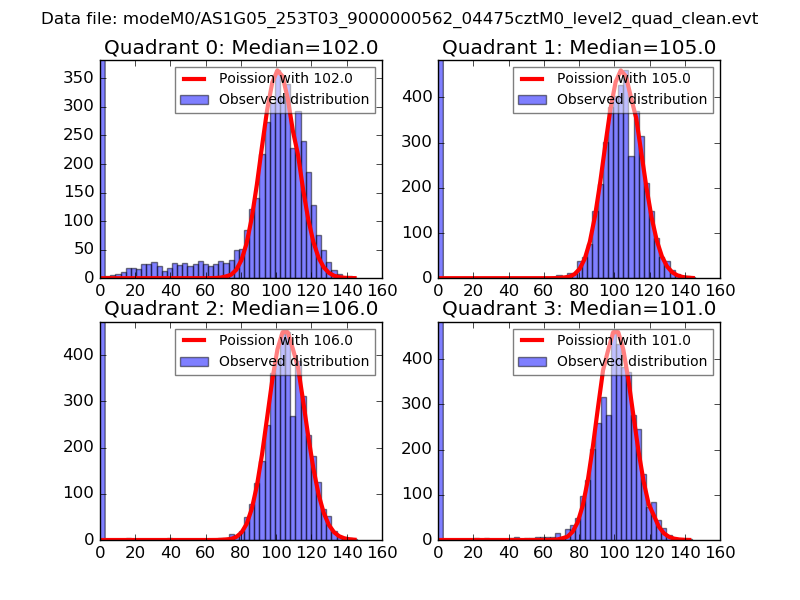 |
 |
| Quadrant-wise count rates Data is divided into 100 sec bins |
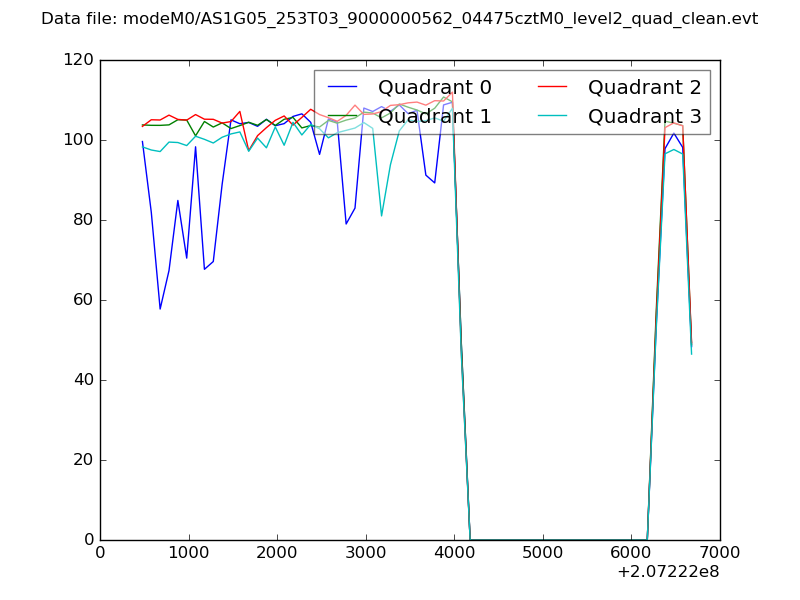 |
|
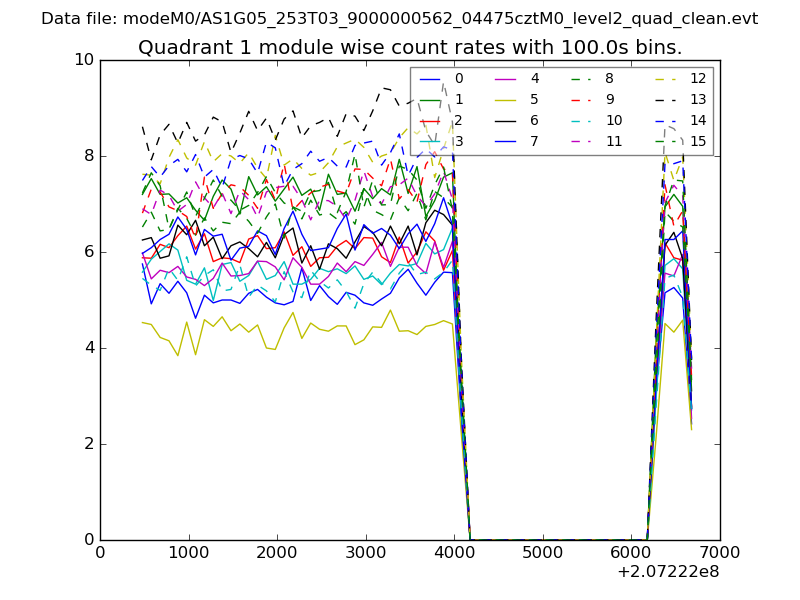
| Module-wise count rates for Quadrant A Data is divided into 100 sec bins |
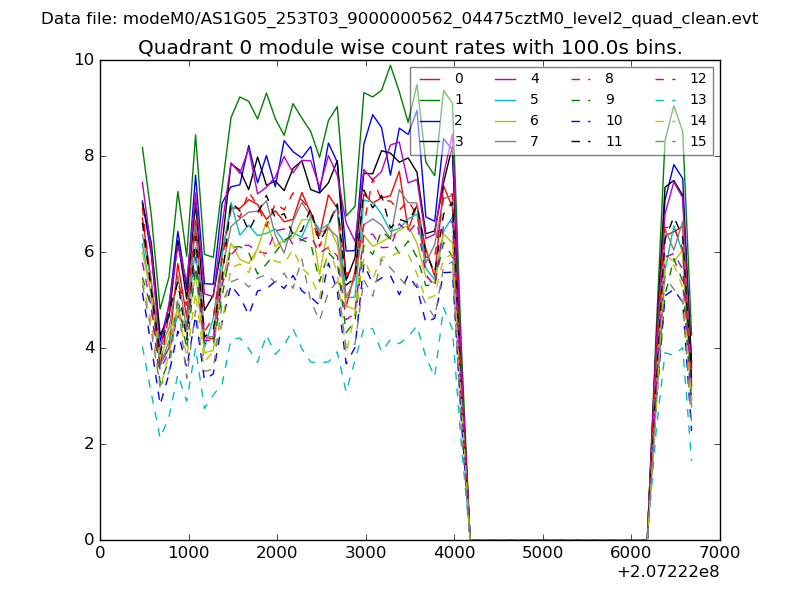 |
 |
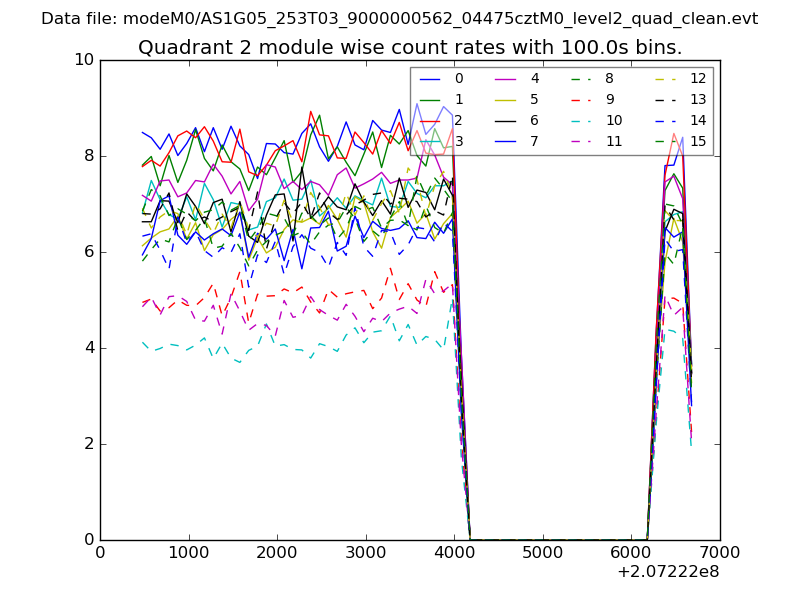
| Module-wise count rates for Quadrant B Data is divided into 100 sec bins |
 |
 |
| Module-wise count rates for Quadrant C Data is divided into 100 sec bins |
 |
 |
| Module-wise count rates for Quadrant D Data is divided into 100 sec bins |
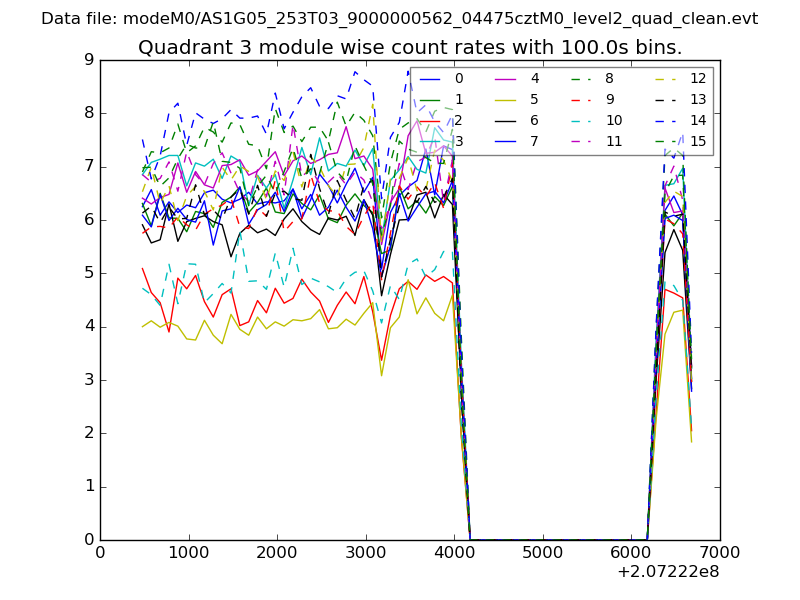 |
 |
| Parameter | Plot |
|---|---|
| CZT HV Monitor | 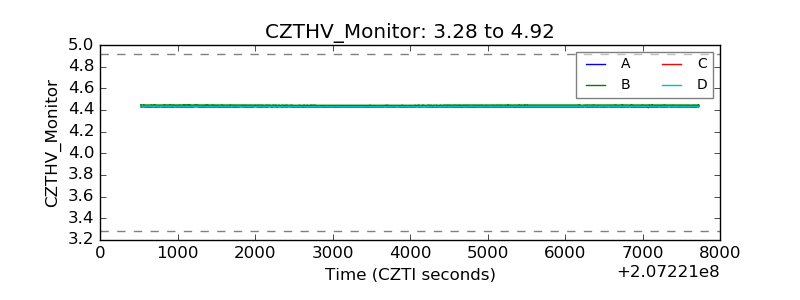 |
| D_VDD | 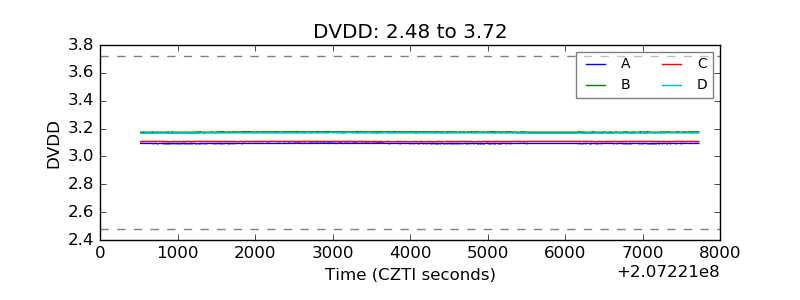 |
| Temperature 1 | 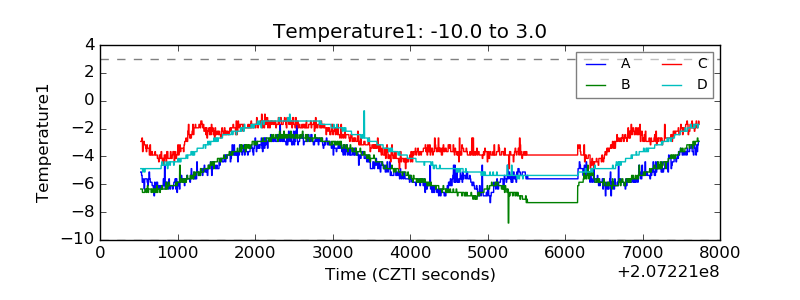 |
| Veto HV Monitor | 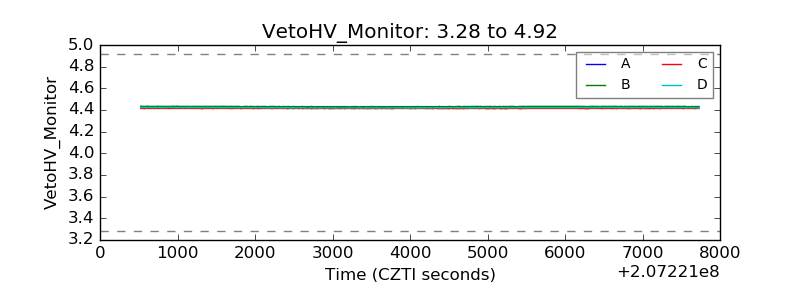 |
| Veto LLD | 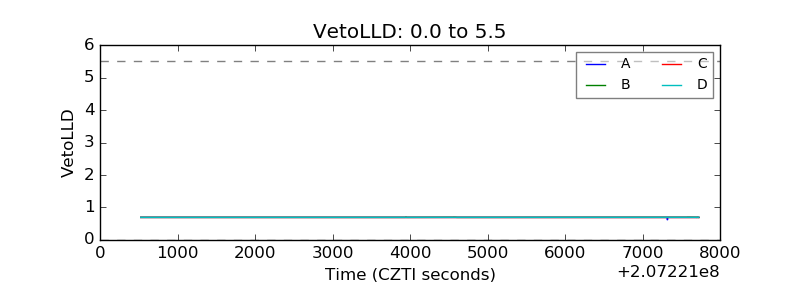 |
| Alpha Counter | 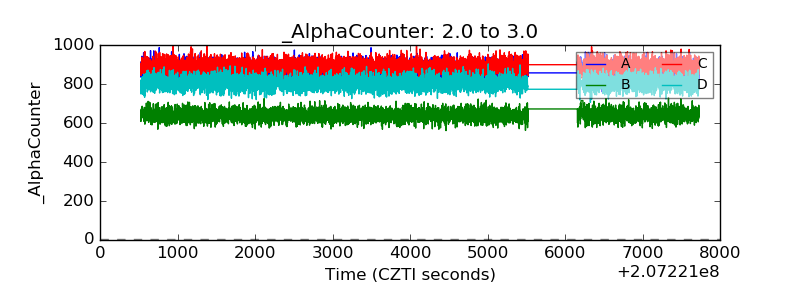 |
| _CPM_Rate | 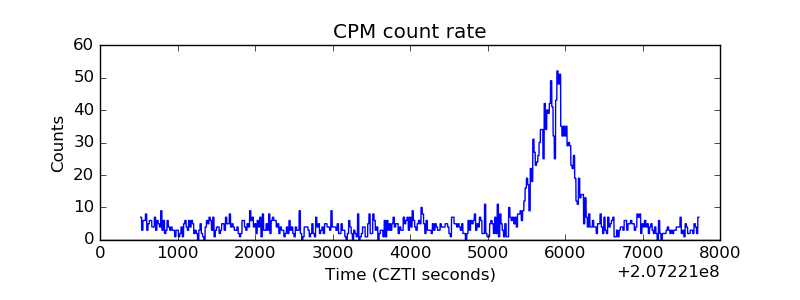 |
| CZT Counter | 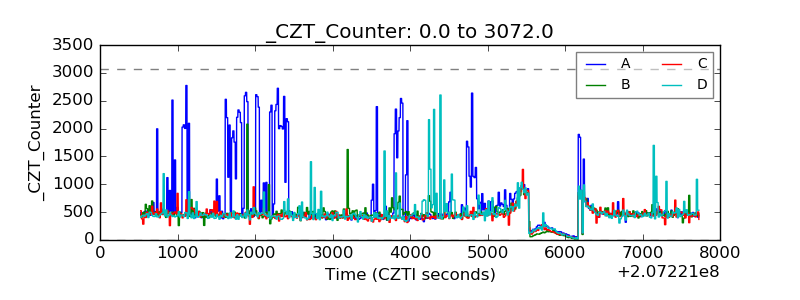 |
| +2.5 Volts monitor |  |
| +5 Volts monitor |  |
| _ROLL_ROT | 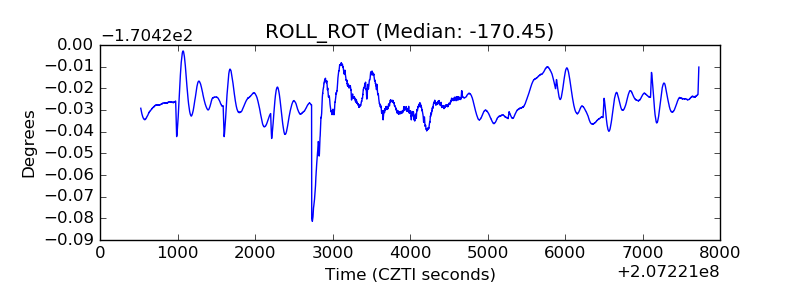 |
| _Roll_DEC | 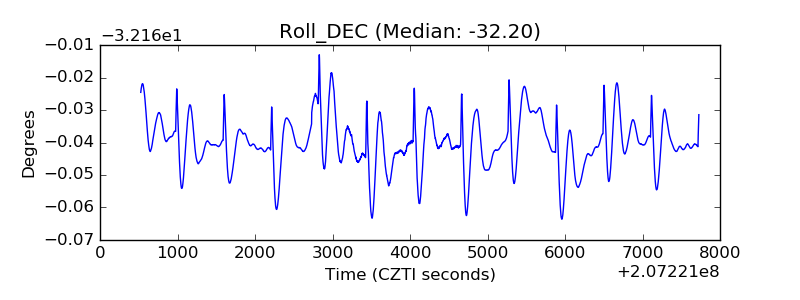 |
| _Roll_RA | 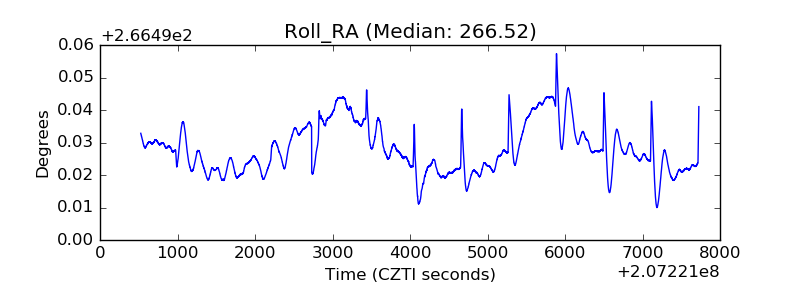 |
| Veto Counter | 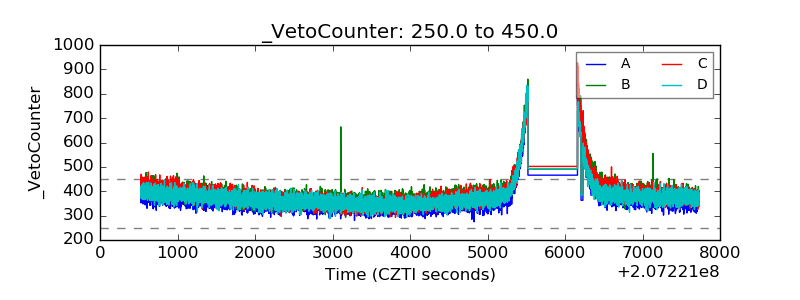 |