| Param | Original file | Final file |
|---|---|---|
| Filename | modeM0/AS1G05_253T03_9000000562_04476cztM0_level2.evt | modeM0/AS1G05_253T03_9000000562_04476cztM0_level2_quad_clean.evt |
| Size (bytes) | 474,572,160 | 75,867,840 |
| Size | 452.6 MB | 72.4 MB |
| Events in quadrant A | 3,383,577 | 454,106 |
| Events in quadrant B | 3,362,431 | 458,739 |
| Events in quadrant C | 3,188,845 | 462,785 |
| Events in quadrant D | 3,962,930 | 435,315 |
| Mode SS | |||
|---|---|---|---|
| Quadrant | BADHDUFLAG | Total packets | Discarded packets |
| A | 0 | 140 | 0 |
| B | 0 | 140 | 0 |
| C | 0 | 140 | 0 |
| D | 0 | 140 | 0 |
| Mode M9 | |||
|---|---|---|---|
| Quadrant | BADHDUFLAG | Total packets | Discarded packets |
| A | 0 | 3 | 0 |
| B | 0 | 3 | 0 |
| C | 0 | 3 | 0 |
| D | 0 | 3 | 0 |
| Mode M0 | |||
|---|---|---|---|
| Quadrant | BADHDUFLAG | Total packets | Discarded packets |
| A | 0 | 14860 | 2 |
| B | 0 | 14607 | 7 |
| C | 0 | 14413 | 1 |
| D | 0 | 16625 | 1 |
| Quadrant | Total seconds | Saturated seconds | Saturation percentage |
|---|---|---|---|
| A | 6988 | 221 | 3.162564% |
| B | 6985 | 197 | 2.820329% |
| C | 6988 | 137 | 1.960504% |
| D | 6988 | 286 | 4.092730% |
Noise dominated data is calculated using 1-second bins in cleaned event files. If a bin has >2000 counts, and if more than 50% of those come from <1% of pixels, then it is considered to be noise-dominated and hence unusable.
| Quadrant | # 1 sec bins | Bins with >0 counts | Bins with >2000 counts | High rate bins dominated by noise | Noise dominated (total time) | Noise dominated (detector-on time) | Marked lightcurve |
|---|---|---|---|---|---|---|---|
| A | 7248 | 6990 | 24 | 24 | 0.33% | 0.34% | 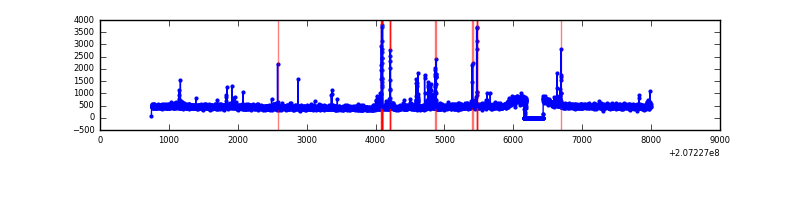 |
| B | 7248 | 6990 | 6 | 6 | 0.08% | 0.09% | 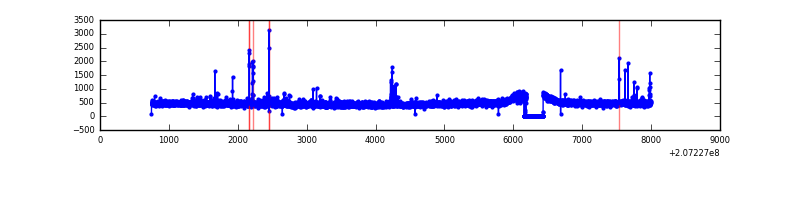 |
| C | 7248 | 6990 | 0 | 0 | 0.00% | 0.00% | 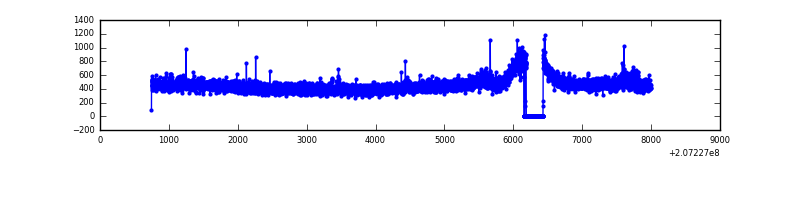 |
| D | 7248 | 6990 | 110 | 110 | 1.52% | 1.57% | 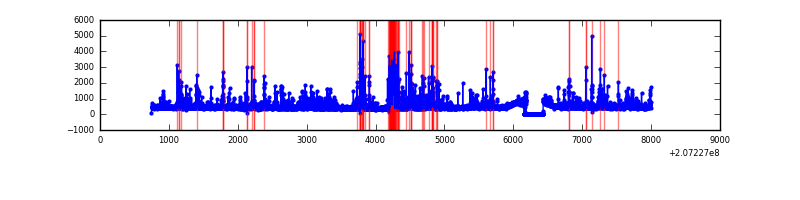 |
Top three noisy pixels from each quadrant. If the there are fewer than three noisy pixels in the level2.evt file, extra rows are filled as -1
| Pixel properties | Quadrant properties | ||||||
|---|---|---|---|---|---|---|---|
| Quadrant | DetID | PixID | Counts | Sigma | Mean | Median | Sigma |
| A | 0 | 13 | 186914 | 1096.28 | 819 | 800 | 169.8 |
| A | 15 | 234 | 21410 | 121.4 | 819 | 800 | 169.8 |
| A | 0 | 226 | 8494 | 45.32 | 819 | 800 | 169.8 |
| B | 15 | 185 | 32333 | 194.31 | 830 | 810 | 162.2 |
| B | 15 | 54 | 32175 | 193.33 | 830 | 810 | 162.2 |
| B | 4 | 48 | 28860 | 172.9 | 830 | 810 | 162.2 |
| C | 9 | 247 | 28657 | 148.65 | 802 | 807 | 187.4 |
| C | 9 | 16 | 13177 | 66.03 | 802 | 807 | 187.4 |
| C | 9 | 54 | 10125 | 49.74 | 802 | 807 | 187.4 |
| D | 13 | 235 | 526408 | 2730.62 | 791 | 767 | 192.5 |
| D | 5 | 51 | 114320 | 589.89 | 791 | 767 | 192.5 |
| D | 8 | 112 | 81717 | 420.52 | 791 | 767 | 192.5 |
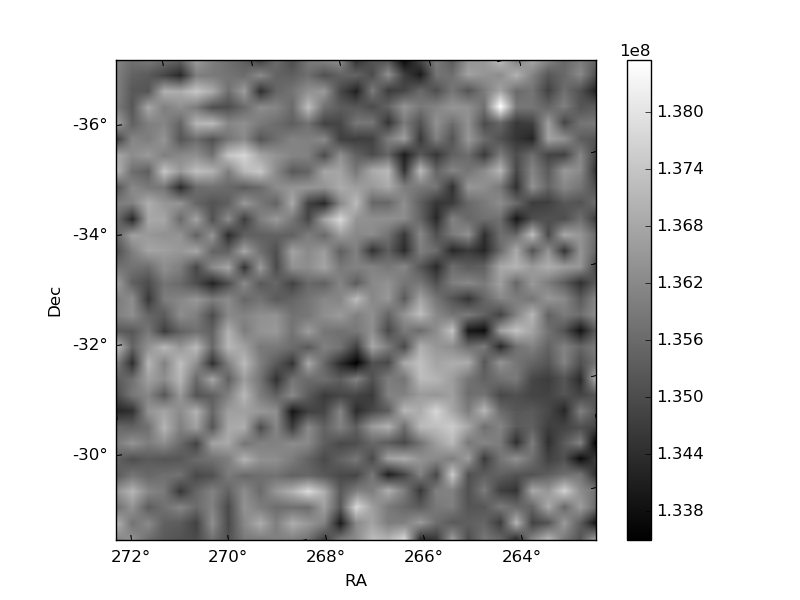
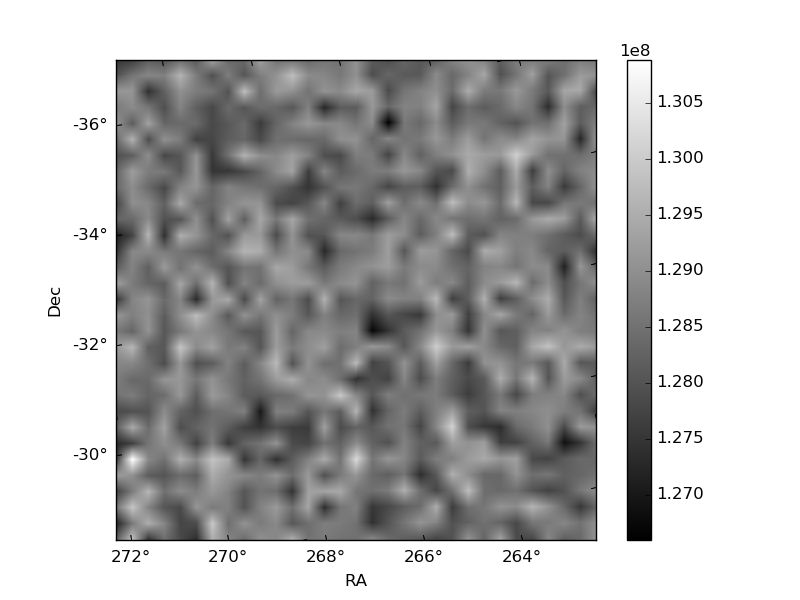
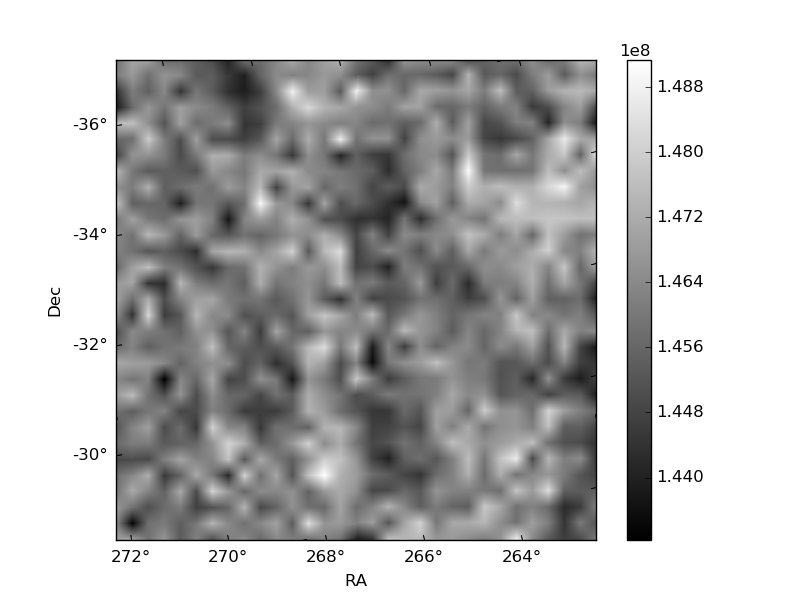
Histogram calculated using DETX and DETY for each event in the final _common_clean file
| Quadrant A | 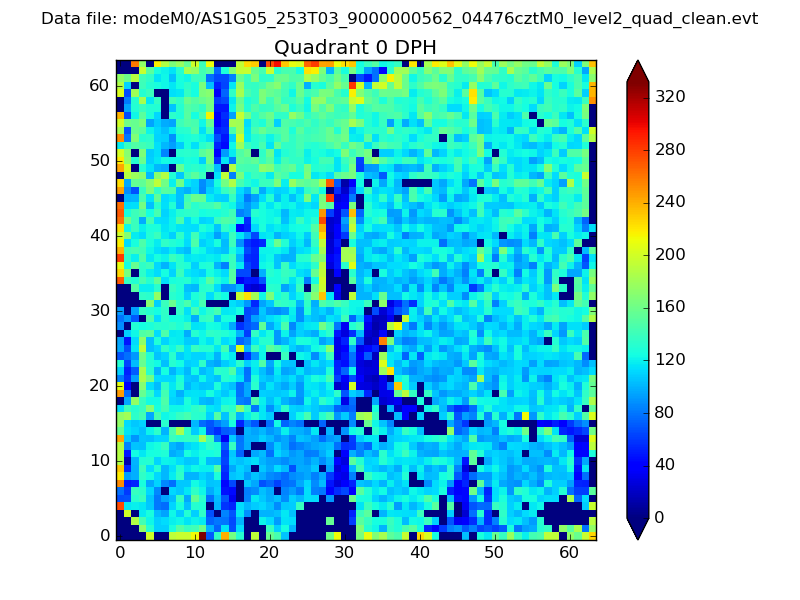 |
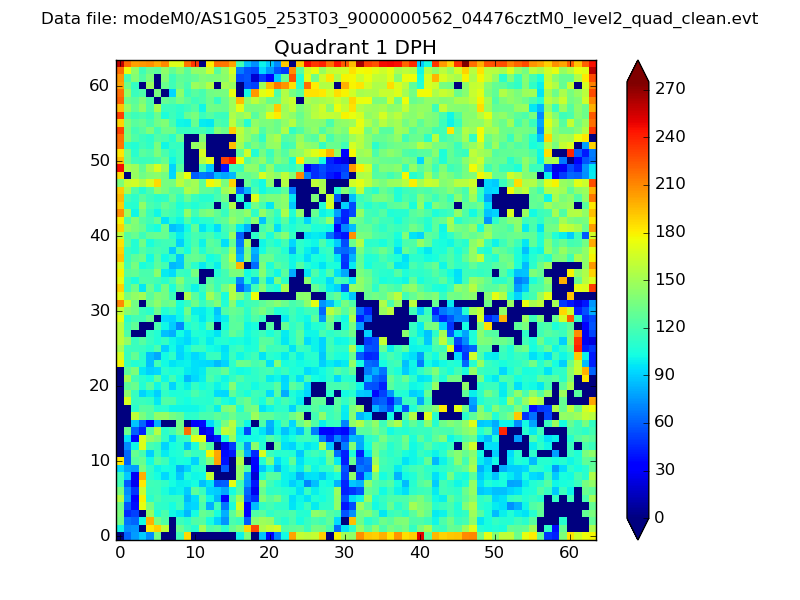 |
Quadrant B |
|---|---|---|---|
| Quadrant D | 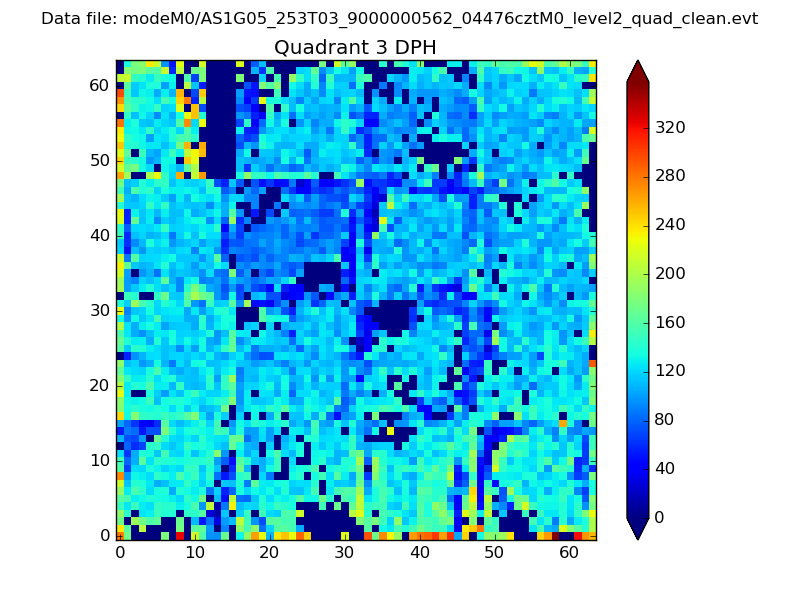 |
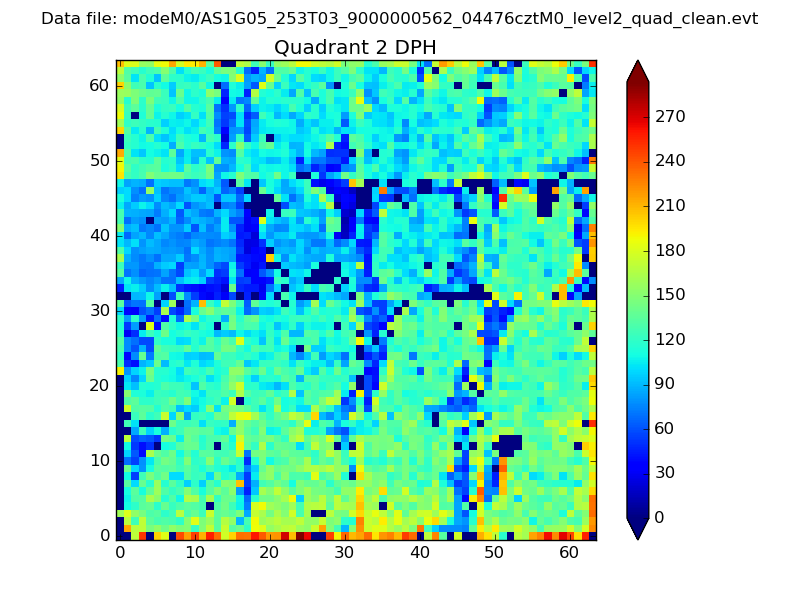 |
Quadrant C |
| Plot type | Count rate plots | Images |
|---|---|---|
| Comparison with Poisson distribution Blue bars denote a histogram of data divided into 1 sec bins. Red curve is a Poisson curve with rate = median count rate of data. |
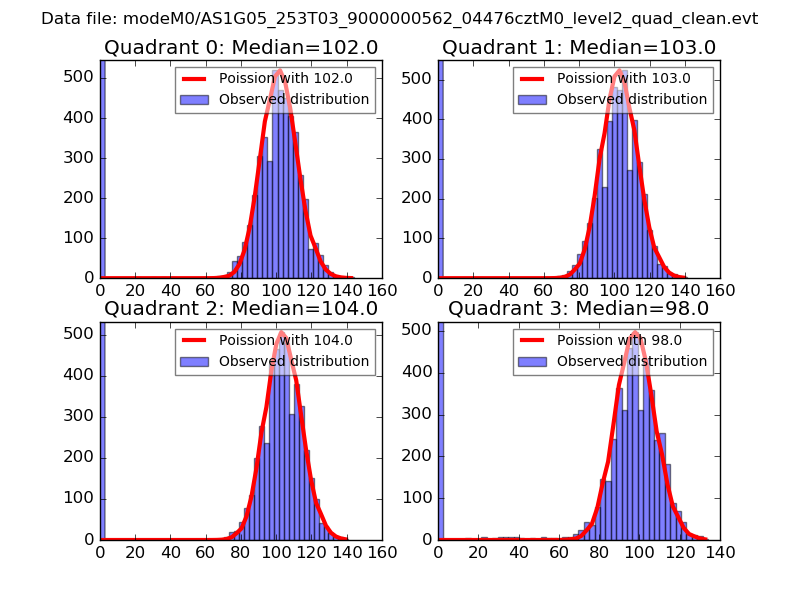 |
 |
| Quadrant-wise count rates Data is divided into 100 sec bins |
 |
|
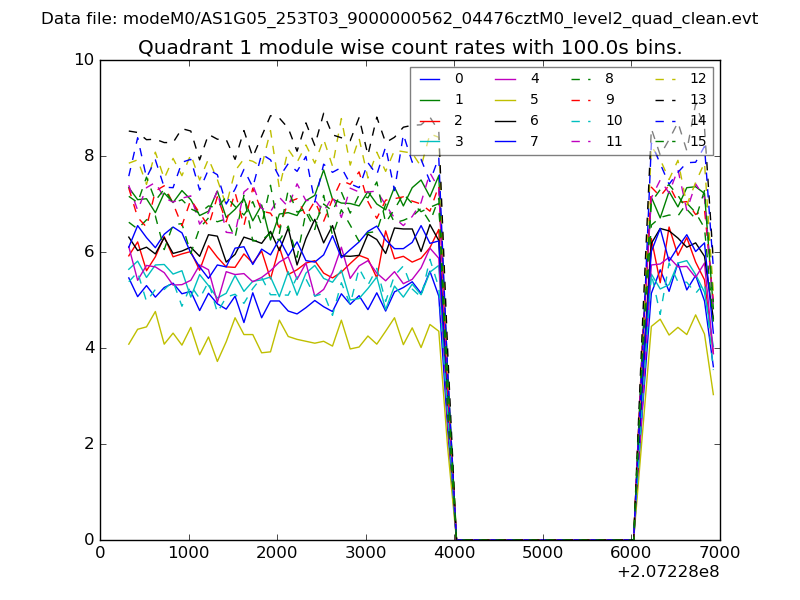
| Module-wise count rates for Quadrant A Data is divided into 100 sec bins |
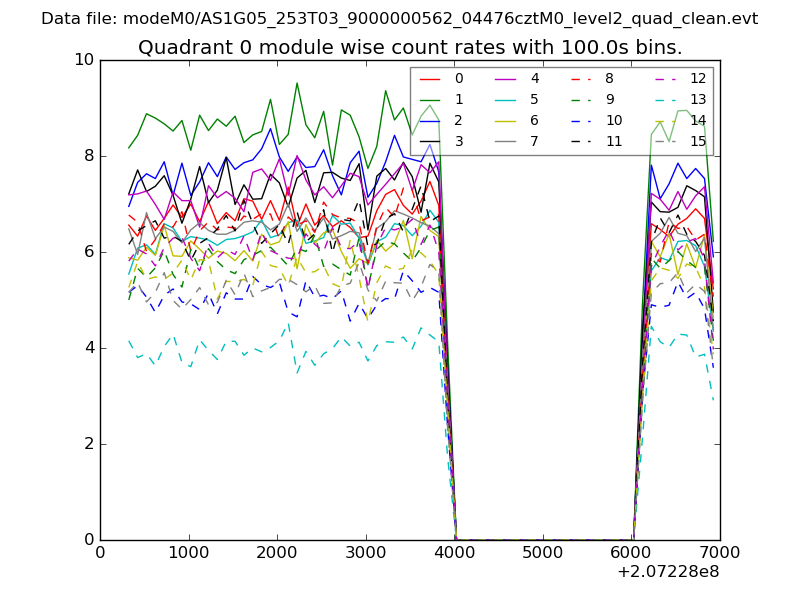 |
 |
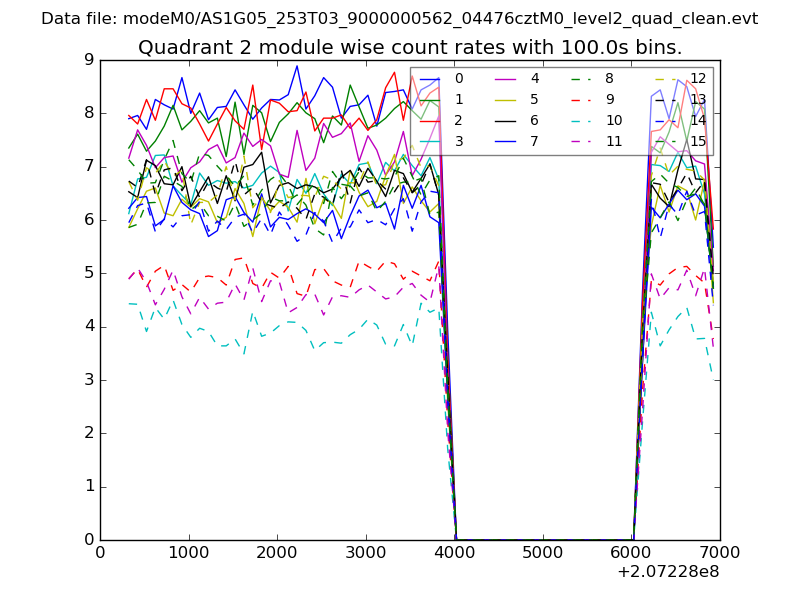
| Module-wise count rates for Quadrant B Data is divided into 100 sec bins |
 |
 |
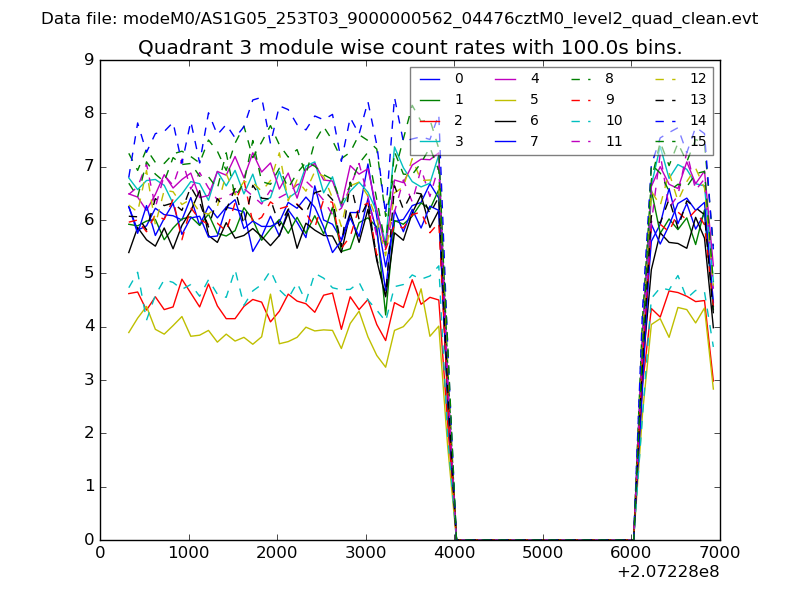
| Module-wise count rates for Quadrant C Data is divided into 100 sec bins |
 |
 |
| Module-wise count rates for Quadrant D Data is divided into 100 sec bins |
 |
 |
| Parameter | Plot |
|---|---|
| CZT HV Monitor | 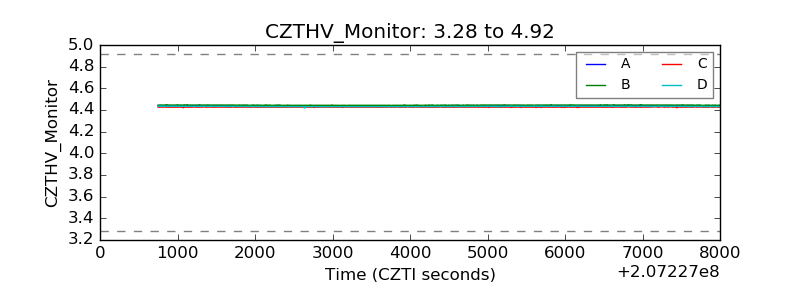 |
| D_VDD | 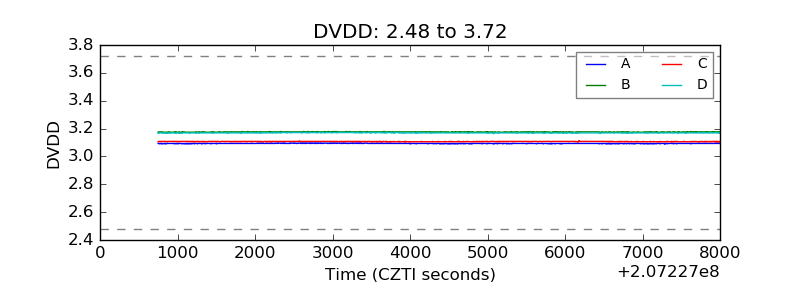 |
| Temperature 1 | 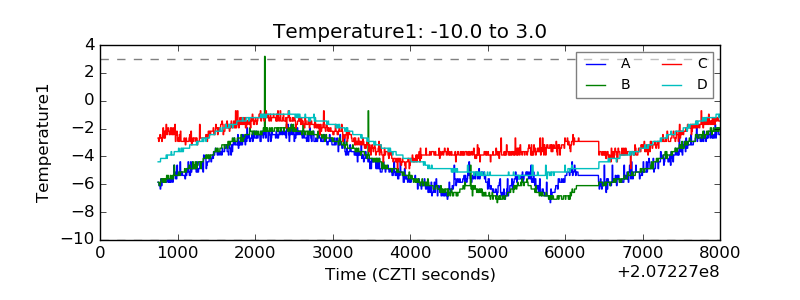 |
| Veto HV Monitor | 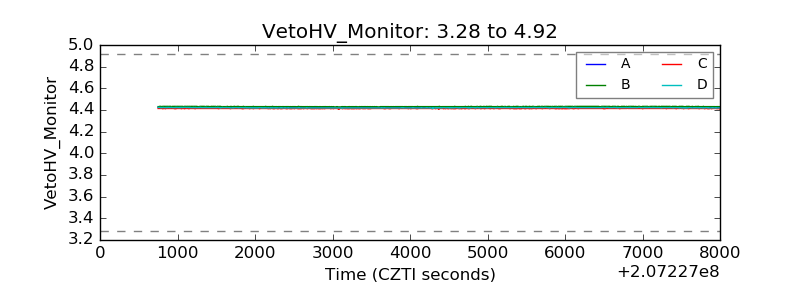 |
| Veto LLD | 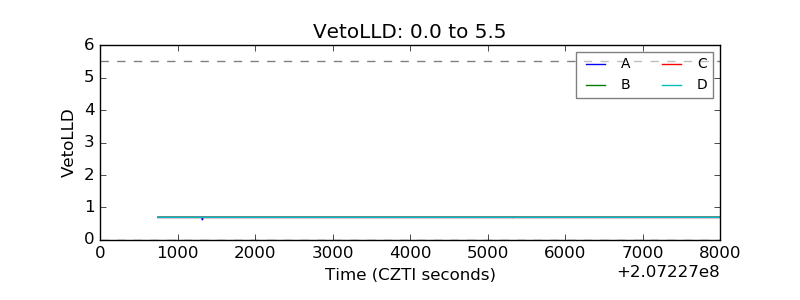 |
| Alpha Counter | 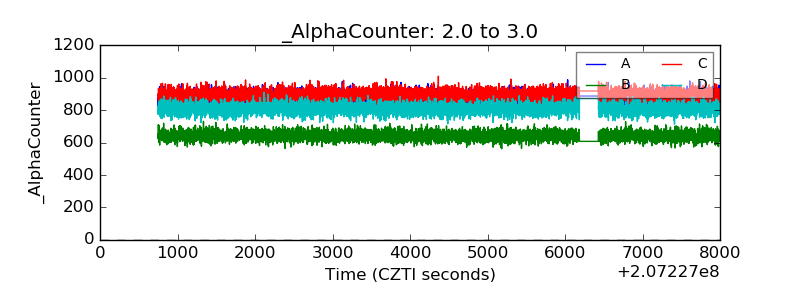 |
| _CPM_Rate | 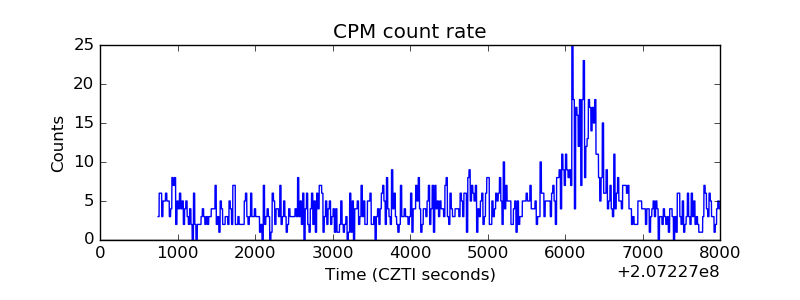 |
| CZT Counter | 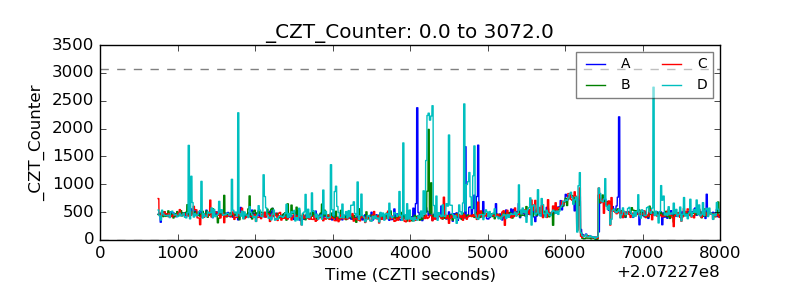 |
| +2.5 Volts monitor |  |
| +5 Volts monitor |  |
| _ROLL_ROT | 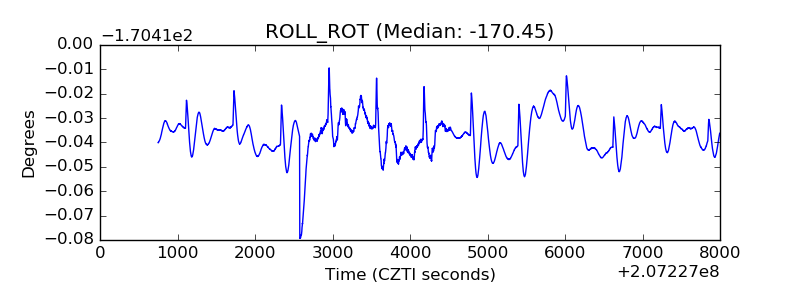 |
| _Roll_DEC | 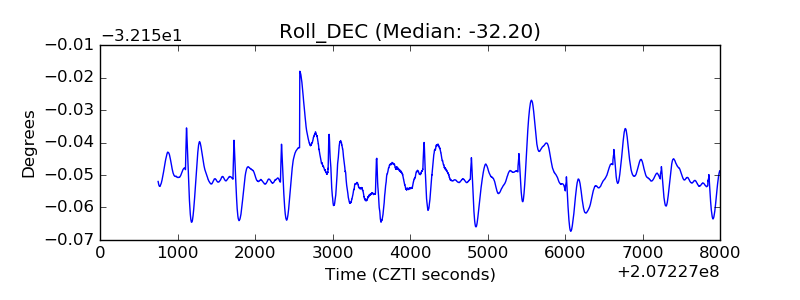 |
| _Roll_RA | 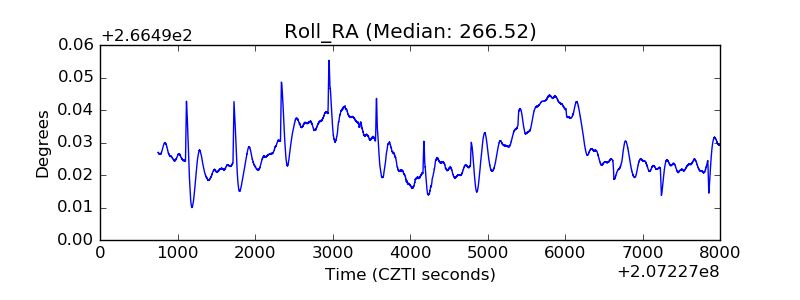 |
| Veto Counter | 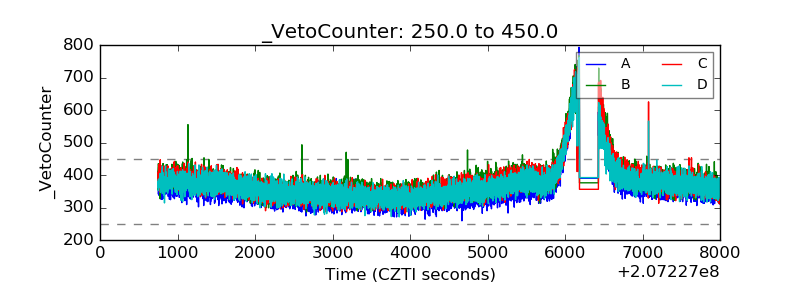 |